Ethereum Price Analysis: ETH Stalls Below $180, Are The Bears Back?
Ethereum has seen a small decline of about 1% over the past 24 hours, bringing its price to $177.67. ETH had struggled to break above $187.84 level which caused the market to fall. Despite the recent price drop, Ethereum has started to crawl higher after increasing by around 6% over the past 7 days.
Ethereum remains the second-largest cryptocurrency with a market cap of $19.27 billion.
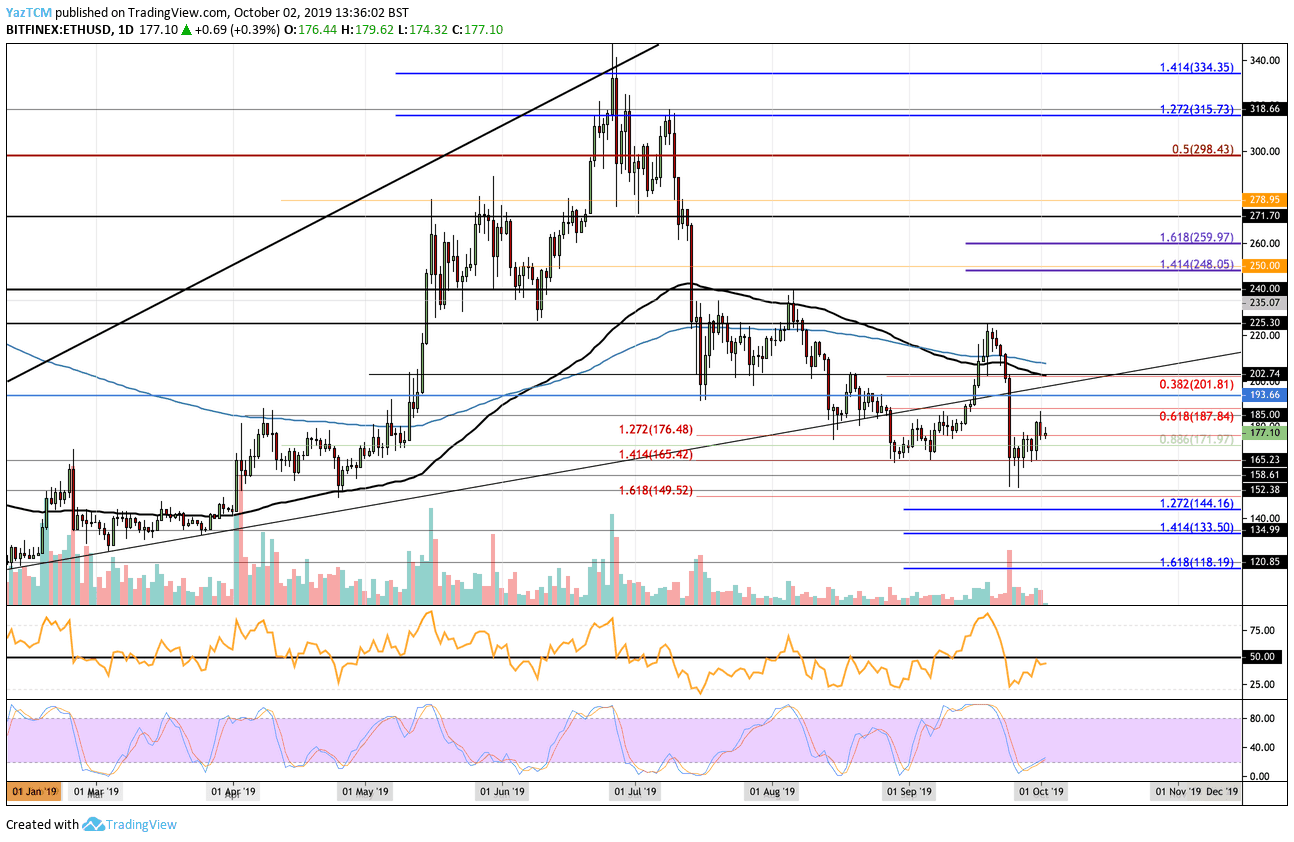
Looking at the ETH/USD 1-day chart:
- Since our previous ETH/USD analysis, the cryptocurrency continued to break above the resistance at $176.48 and climbed higher to meet resistance at $187.84. ETH has since rolled over as it now rests at the support around $176.
- From above: The nearest levels of resistance lie at $180 and $187.84. Above this, higher resistance lies at $193.66 and $200. If the bulls can climb above $200, resistance is expected at $202-$210 (contains 100-days and 200-days EMA), $225 (September 2019 high), $235, $240, $248.05, and $260.
- From below: The nearest level of support lies at $176. Beneath this, support can be found at $172, $170, $165, and $160. IF the sellers break $160, support is located at $158.61, $152.38, $149.52, $144.16, and $133.50.
- The trading volume has started to rise toward the end of September.
- The RSI is currently beneath the 50 level as it attempts to break above. A break above 50 would show that the bulls are back in control over the market momentum. Furthermore, the Stochastic RSI has recently produced a bullish crossover signal which should send the market higher.

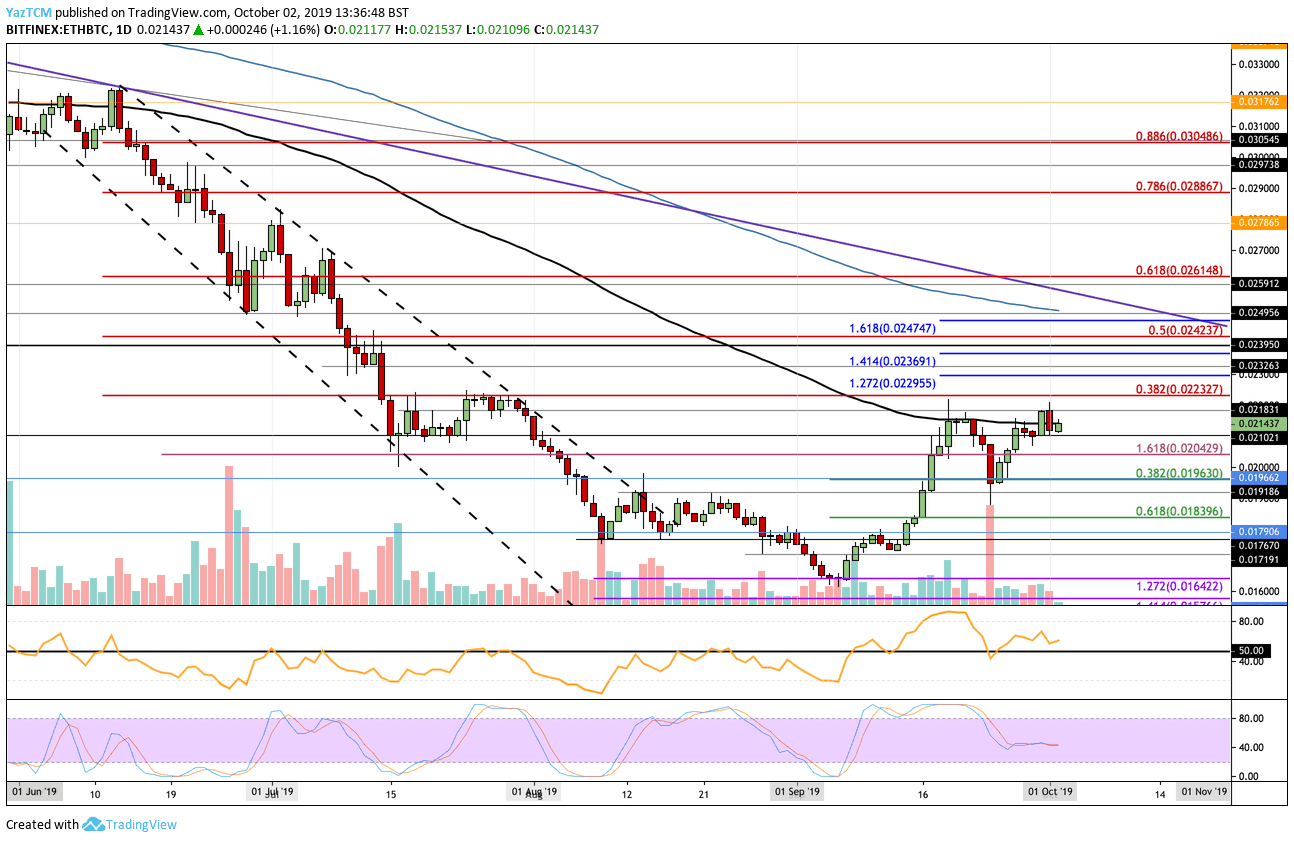
Looking at the ETH/BTC 1-day chart:
- Against BTC, ETH has attempted to break above the 100-days EMA but failed to make any progress above 0.02183 BTC. Ethereum is now trading back below the 100-days EMA as it tries to break above.
- From above: If the bulls climb above the 100-days EMA, higher resistance lies at 0.02183 BTC and 0.022 BTC. Above this, higher resistance lies at 0.02232 BTC (bearish .382 Fib Retracement), 0.02295 BTC (1.272 Fib Extension), 0.02326 BTC, 0.02369 (1.414 Fib Extension), 0.024 BTC, and 0.02423 BTC (bearish .5 Fibonacci Retracement level).
- From below: The nearest level of support lies at 0.021 BTC. Beneath this, further support can be found at 0.02042 BTC, 0.020 BTC, and 0.01963 BTC (short term .382 Fib Retracement). Lower support is expected at 0.01918 BTC, 0.019 BTC, 0.01839 BTC, and 0.0179 BTC.
- The trading volume remains low, beneath the average level.
- The RSI is above 50 which shows that the bulls are in control over the market momentum. However, to break above the 100-days EMA, we would need to see the RSI rise higher to show the bulls are increasing in momentum.

The post Ethereum Price Analysis: ETH Stalls Below $180, Are The Bears Back? appeared first on CryptoPotato.


