Ethereum Price Analysis: ETH Stable Above $1050 Support, Big Move Incoming?
ETH/USD – Bulls Holding Strong Above .382 Fib Support
Key Support Levels: $1047, $1000, $952.
Key Resistance Levels: $1100, $1165, $1200.
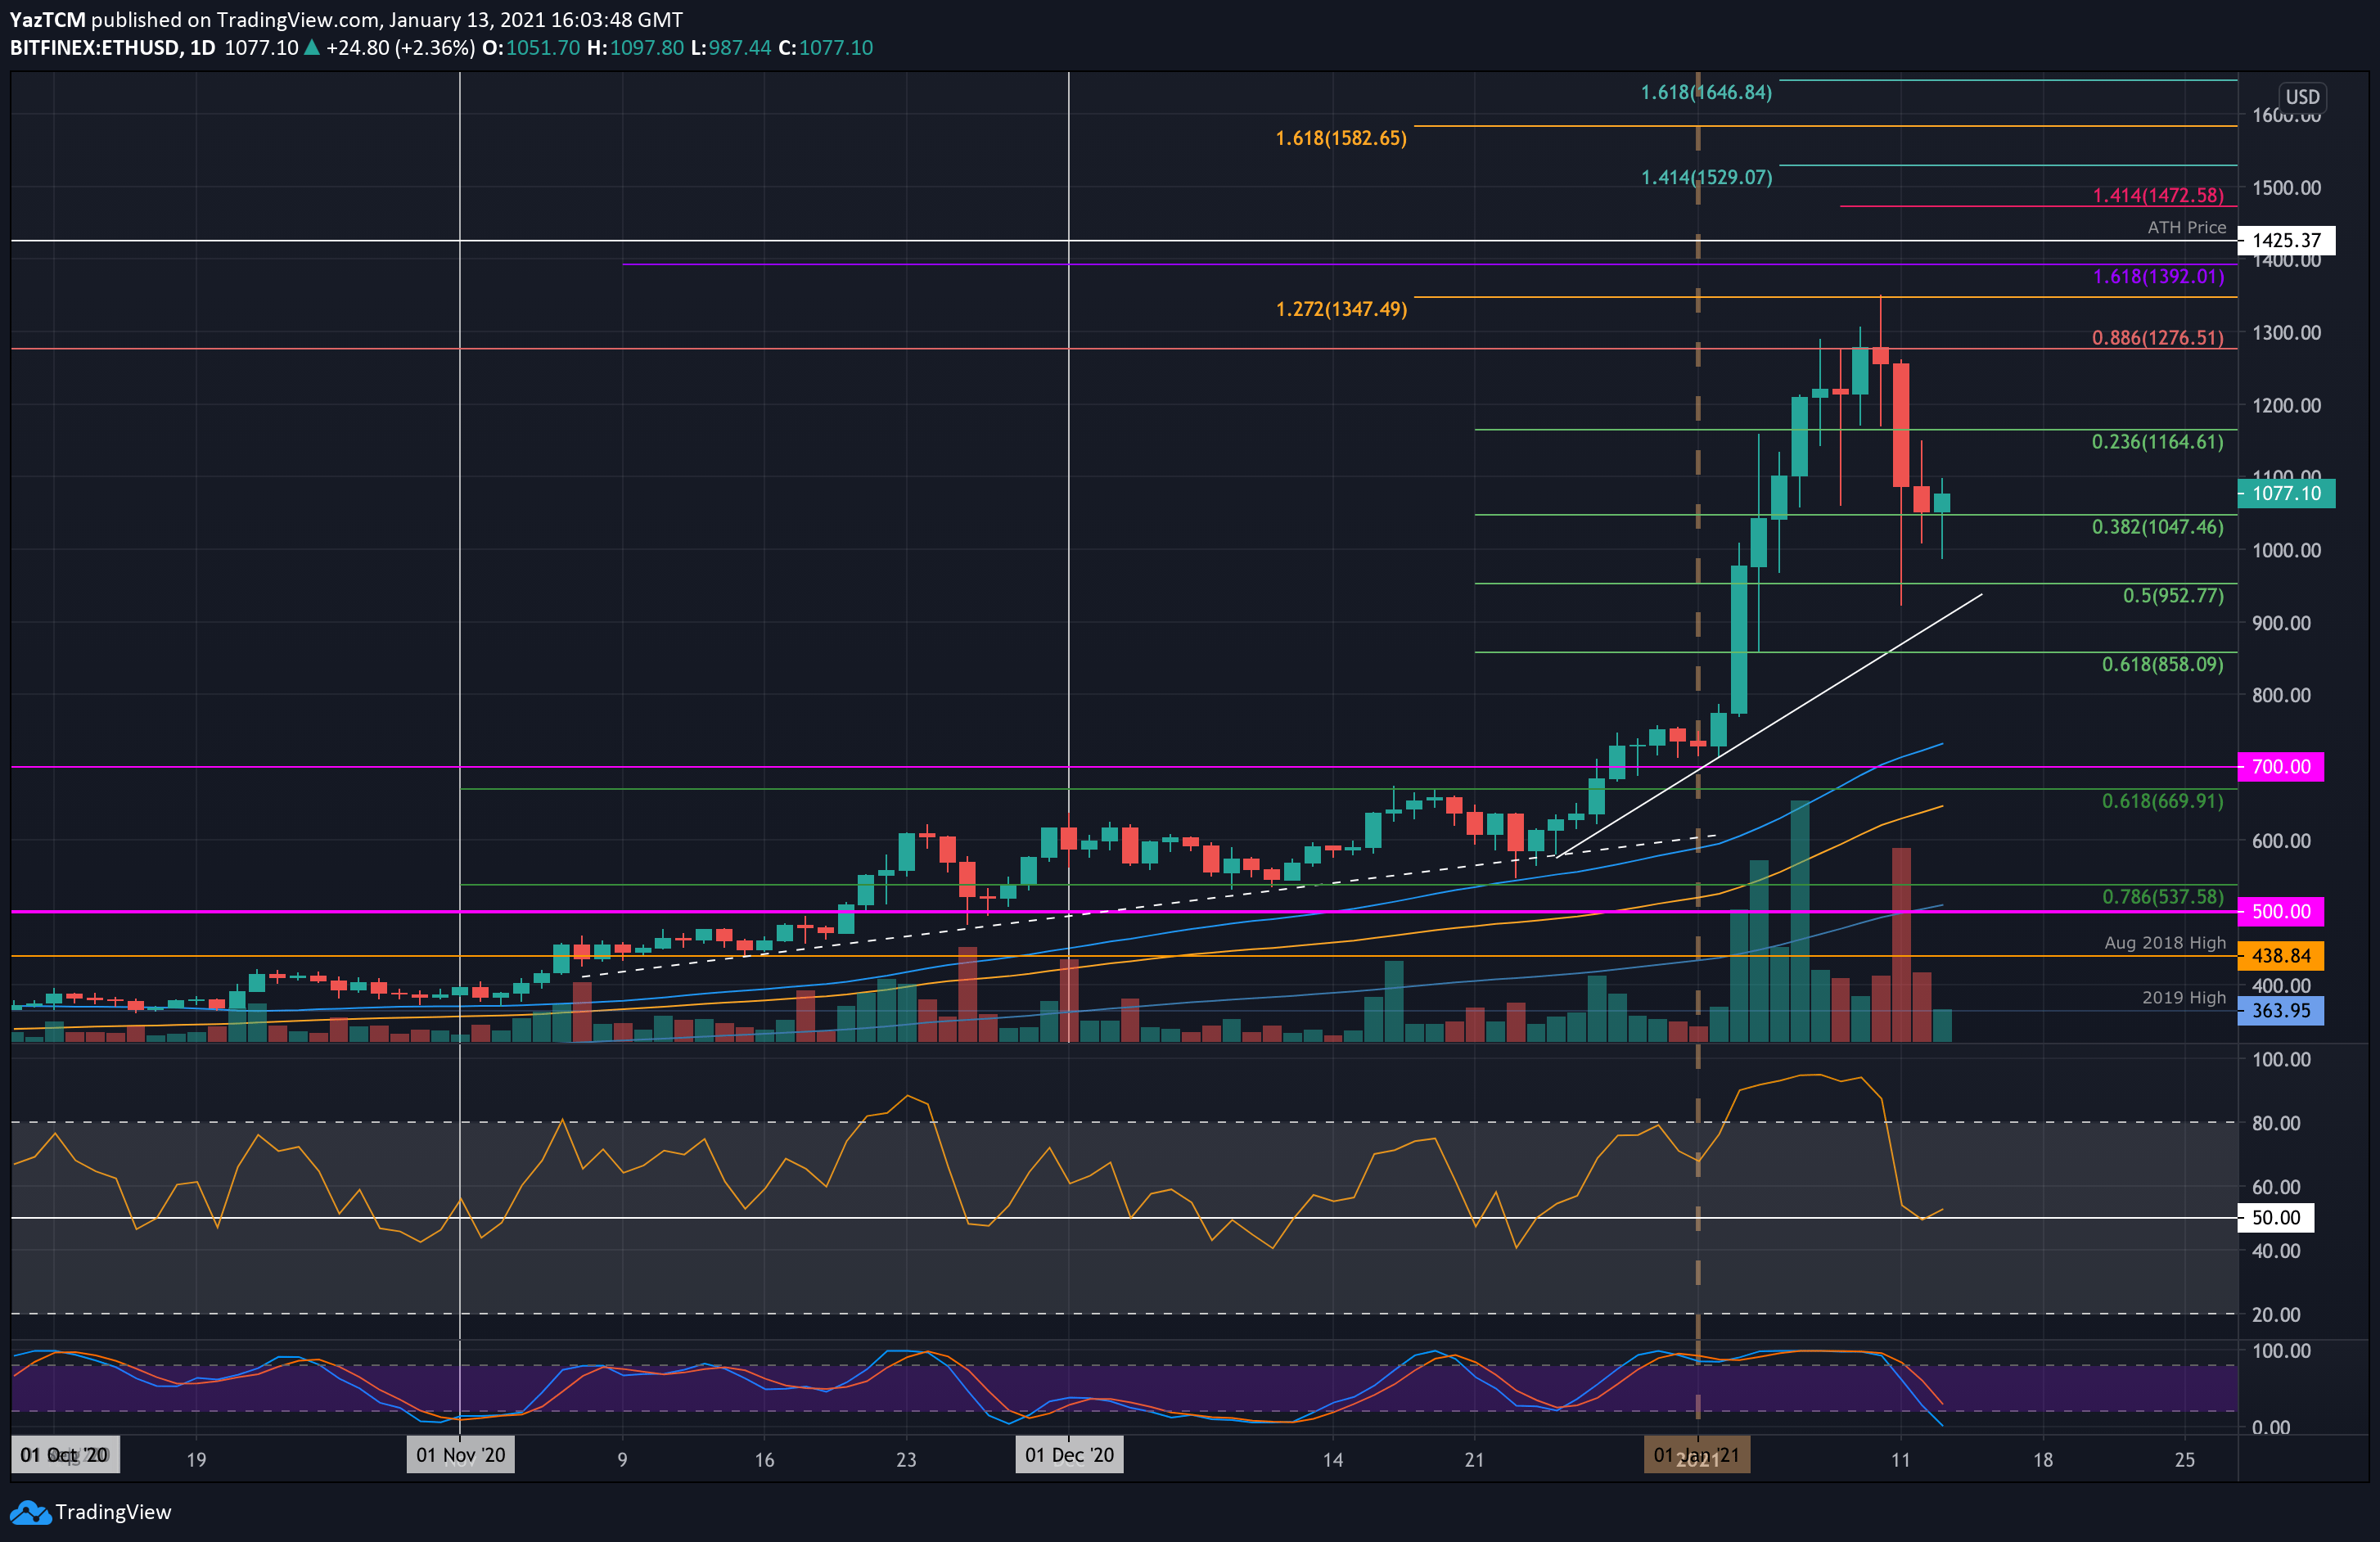
Last week, Ethereum was climbing higher as it surged into the $1350 resistance (1.272 Fib Extension). More specifically, it struggled to close a daily candle above resistance at $1276 (bearish .886 Fib Retracement) and started to roll over from here at the weekend.
On Monday, the sudden Bitcoin price plummet caused ETH to spike as low as $930. Luckily, the bulls had regrouped by the end of the day to close that daily candle at around $1090. From there, ETH has dropped slightly lower into support at $1047 (.382 Fib Retracement) and has held here for the past two days.

ETH-USD Short Term Price Prediction
Looking ahead, if the bulls can continue to rebound, the first level of resistance lies at $1100. This is followed by $1165, $1200, and $1276 (bearish .886 Fib Retracement). Beyond $1300, additional resistance lies at $1350 (1.272 Fib Extension), $1392, and $1425 (ATH price).
On the other side, the first level of support lies at $1047 (.382 Fib). This is followed by $1000, $952 (.5 Fib Retracement), a rising trend line, $900, and $858 (.618 Fib Retracement).
The daily RSI has plummeted into the mid-line as the bullish momentum fades from the market. It is holding above the mid-line, which suggests that the bulls are still unwilling to give control to the bears right now.
ETH/BTC – Bulls Fail At 0.033 BTC
Key Support Levels: 0.0303 BTC, 0.03 BTC, 0.0295 BTC.
Key Resistance Levels: 0.0318 BTC, 0.033 BTC, 0.0337 BTC.
Against Bitcoin, Ethereum also surged higher last week to reach the resistance at 0.033 BTC (November high-day closing price).
After double topping there, ETH started to head lower this week as it dropped into the support at 0.030 BTC, provided by the .382 Fib Retracement. It has since bounced slightly from there to trade at 0.0308 BTC.

ETH-BTC Short Term Price Prediction
Moving forward, if the buyers push higher again, the first level of resistance lies at 0.0318 BTC (December 2020 high). This is followed by resistance at 0.033 BTC, 0.0337 BTC (November 2020 Highs), 0.034 BTC, and 0.035 BTC.
On the other side, the first level of support lies at 0.0303 BTC (.382 Fib). This is followed by support at 0.03 BTC, 0.0295 BTC (200-days EMA), 0.0289 BTC (.5 Fib), and 0.0285 BTC (Feb 2020 High).
The daily RSI also returned to the mid-line this week after printing a bearish divergence signal a couple of days ago. It would need to break beneath the mid-line before bearish momentum sets into the market.


