Ethereum Price Analysis: ETH Spikes To 3-Year High, Only 20% From ATH
ETH/USD – Ethereum Breaks $1000 and Surges As High As $1,161.
Key Support Levels: $1100, $1042, $975.
Key Resistance Levels: $1140, $1161, $1200.
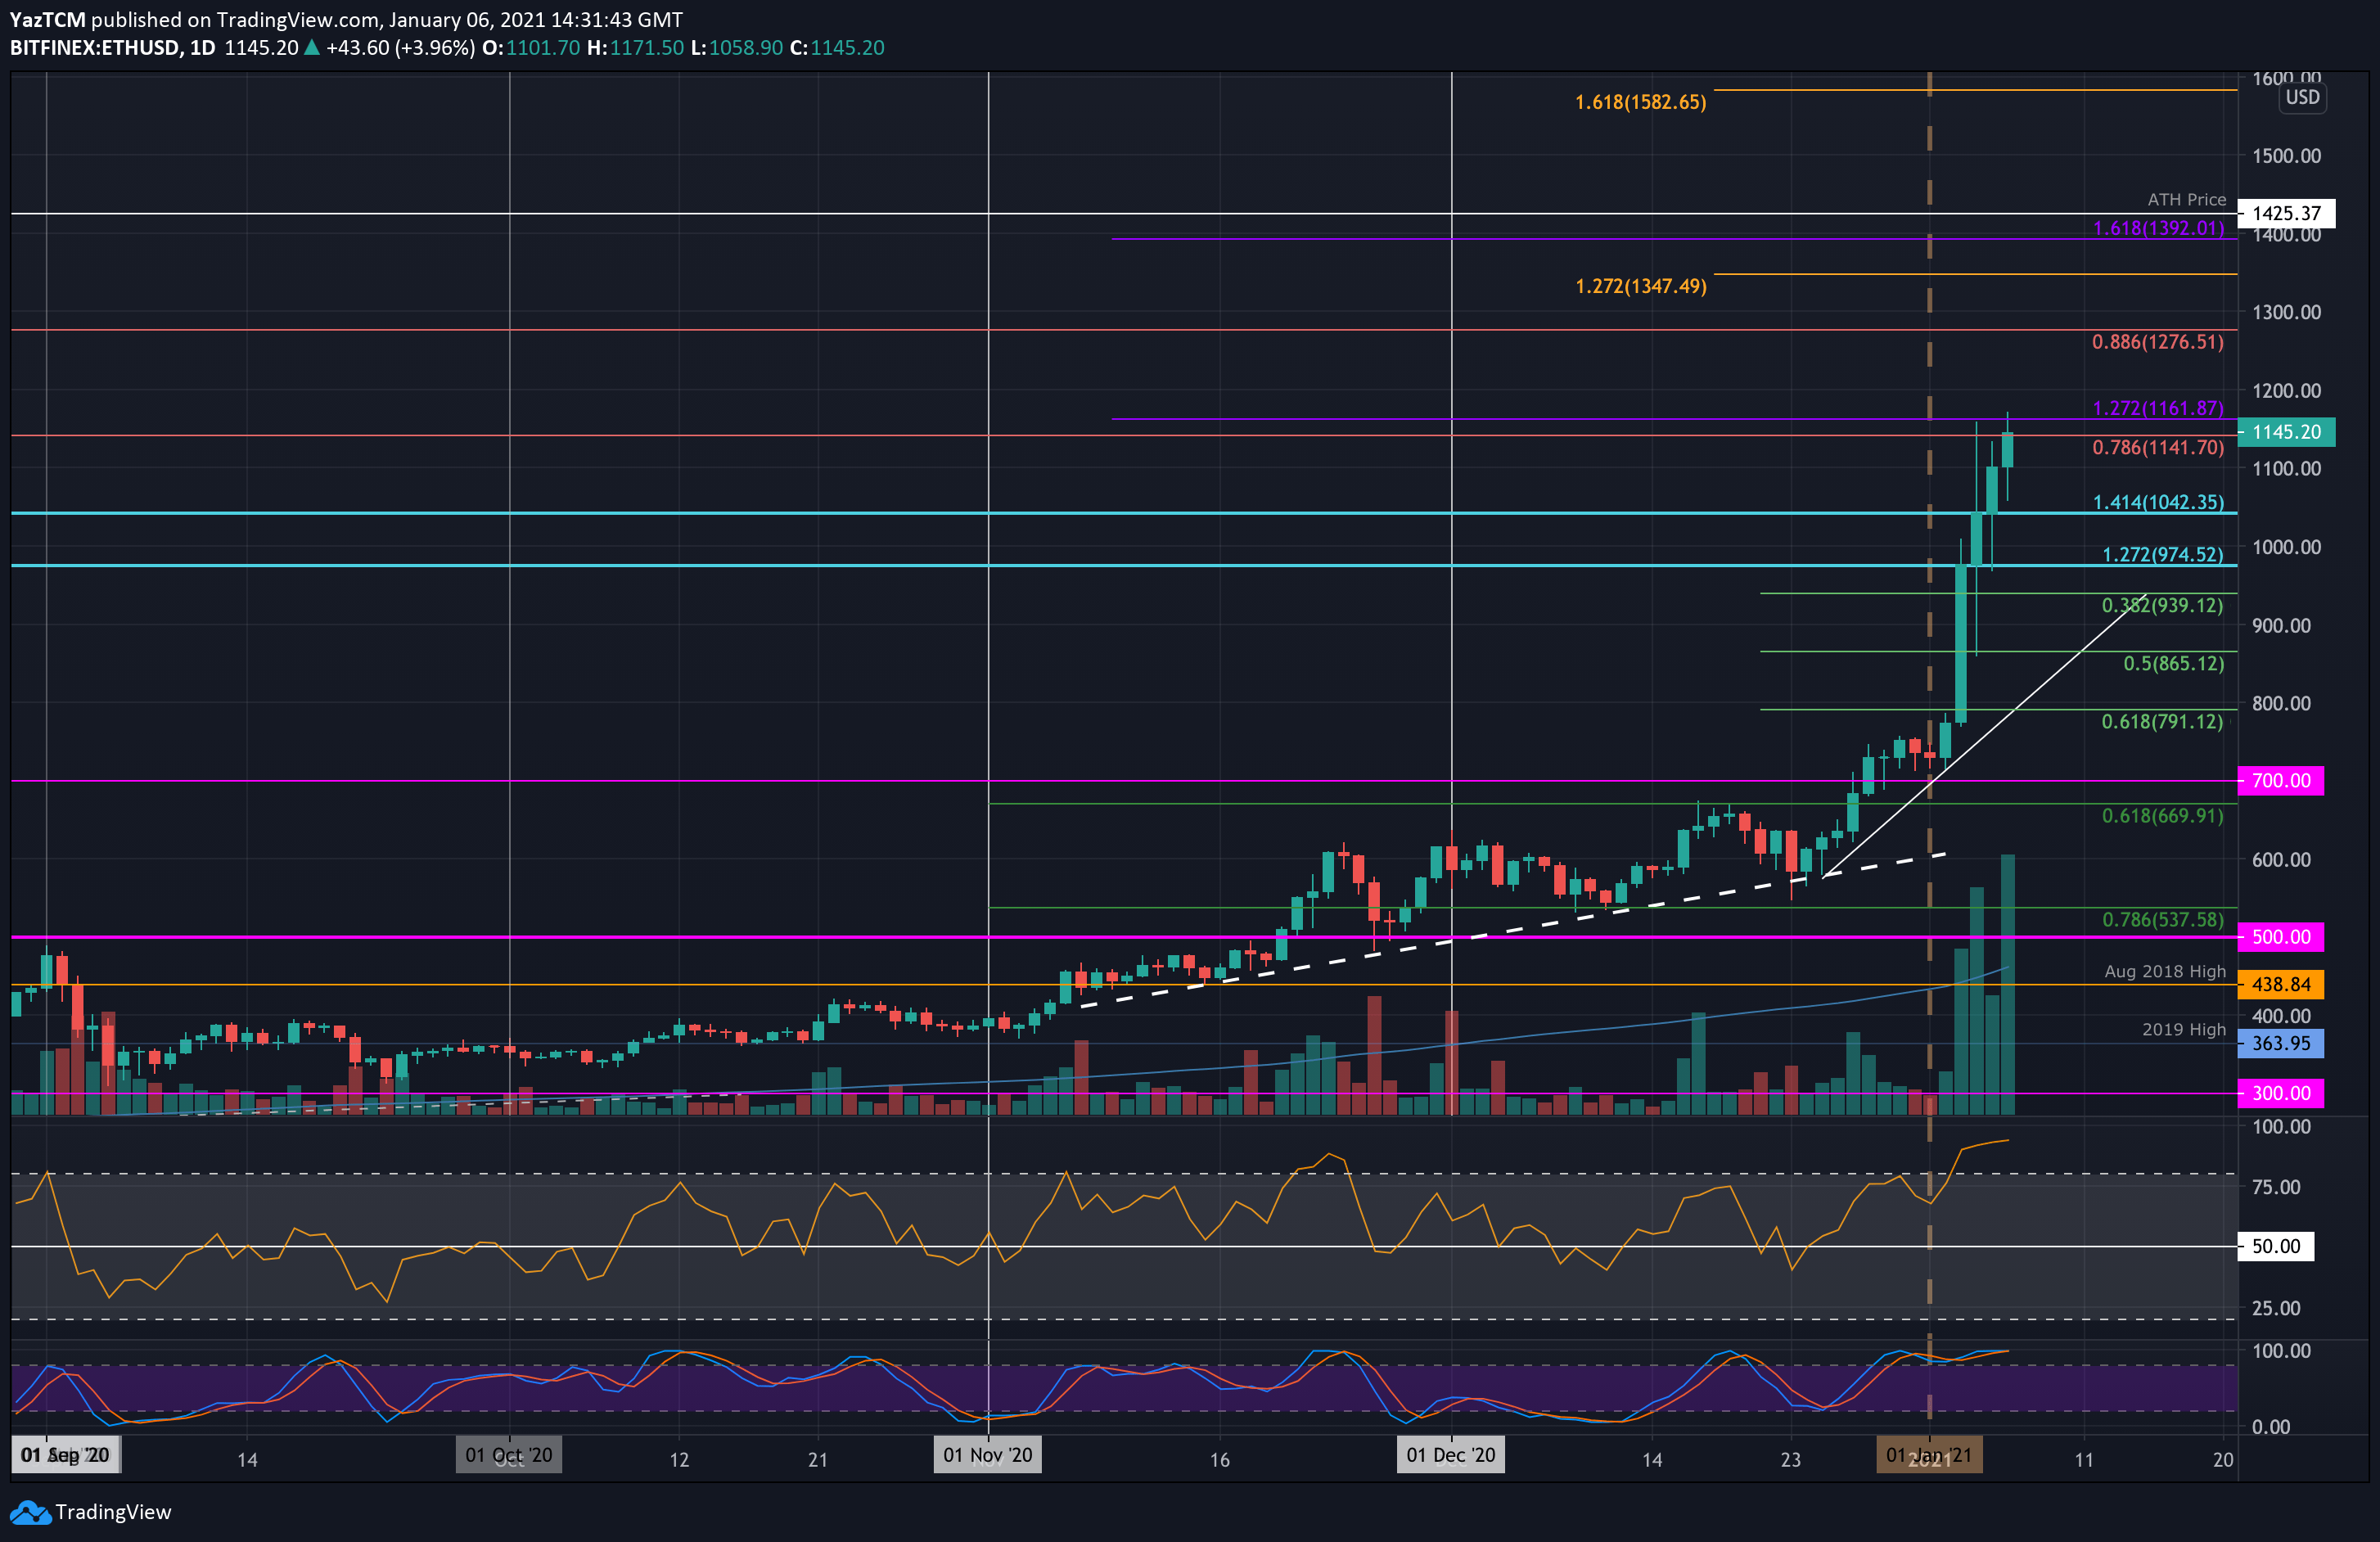
Ethereum continued to push higher today as it broke past yesterday’s closing price at $1100 to reach as high as $1170. It has since dropped slightly as it battles with the resistance near $1140 – provided by a long term bearish .786 Fib Retracement level.
The coin has been making higher highs over the past month and has surged by a total of 55.5% in the past 7-days alone. On the way up, it penetrated above long term resistance at $975 (1.272 Fib Extension), $1000, and $1042 (1.414 Fib Extension) to reach the current $1140 level. It’s a 3-year high for ETH as well.
It is now just underneath 20% of its previous ATH at $1425 and could reach this level this week.
ETH-USD Short Term Price Prediction
Looking ahead, once $1140 is cleared, the first level of resistance lies at $1161 (1.272 Fib Extension). This is followed by $1200, $1275 (bearish .886 Fib Retracement), and $1300.
Beyond $1300, added resistance lies at $1350 (short term 1.272 Fib Extension), $1192 (1.618 Fib Extension), and $1425 (ATH price).
On the other side, support is first expected at $1100. This is followed by $1042, $1000, and $975.
As expected, the RSI is now extremely overbought and is at levels not seen since August 2020.
ETH/BTC – Bulls Battle To Close Above November Highs
Key Support Levels: 0.0321 BTC, 0.0318 BTC, 0.0303 BTC
Key Resistance Levels: 0.0337 BTC, 0.035 BTC, 0.0357 BTC.
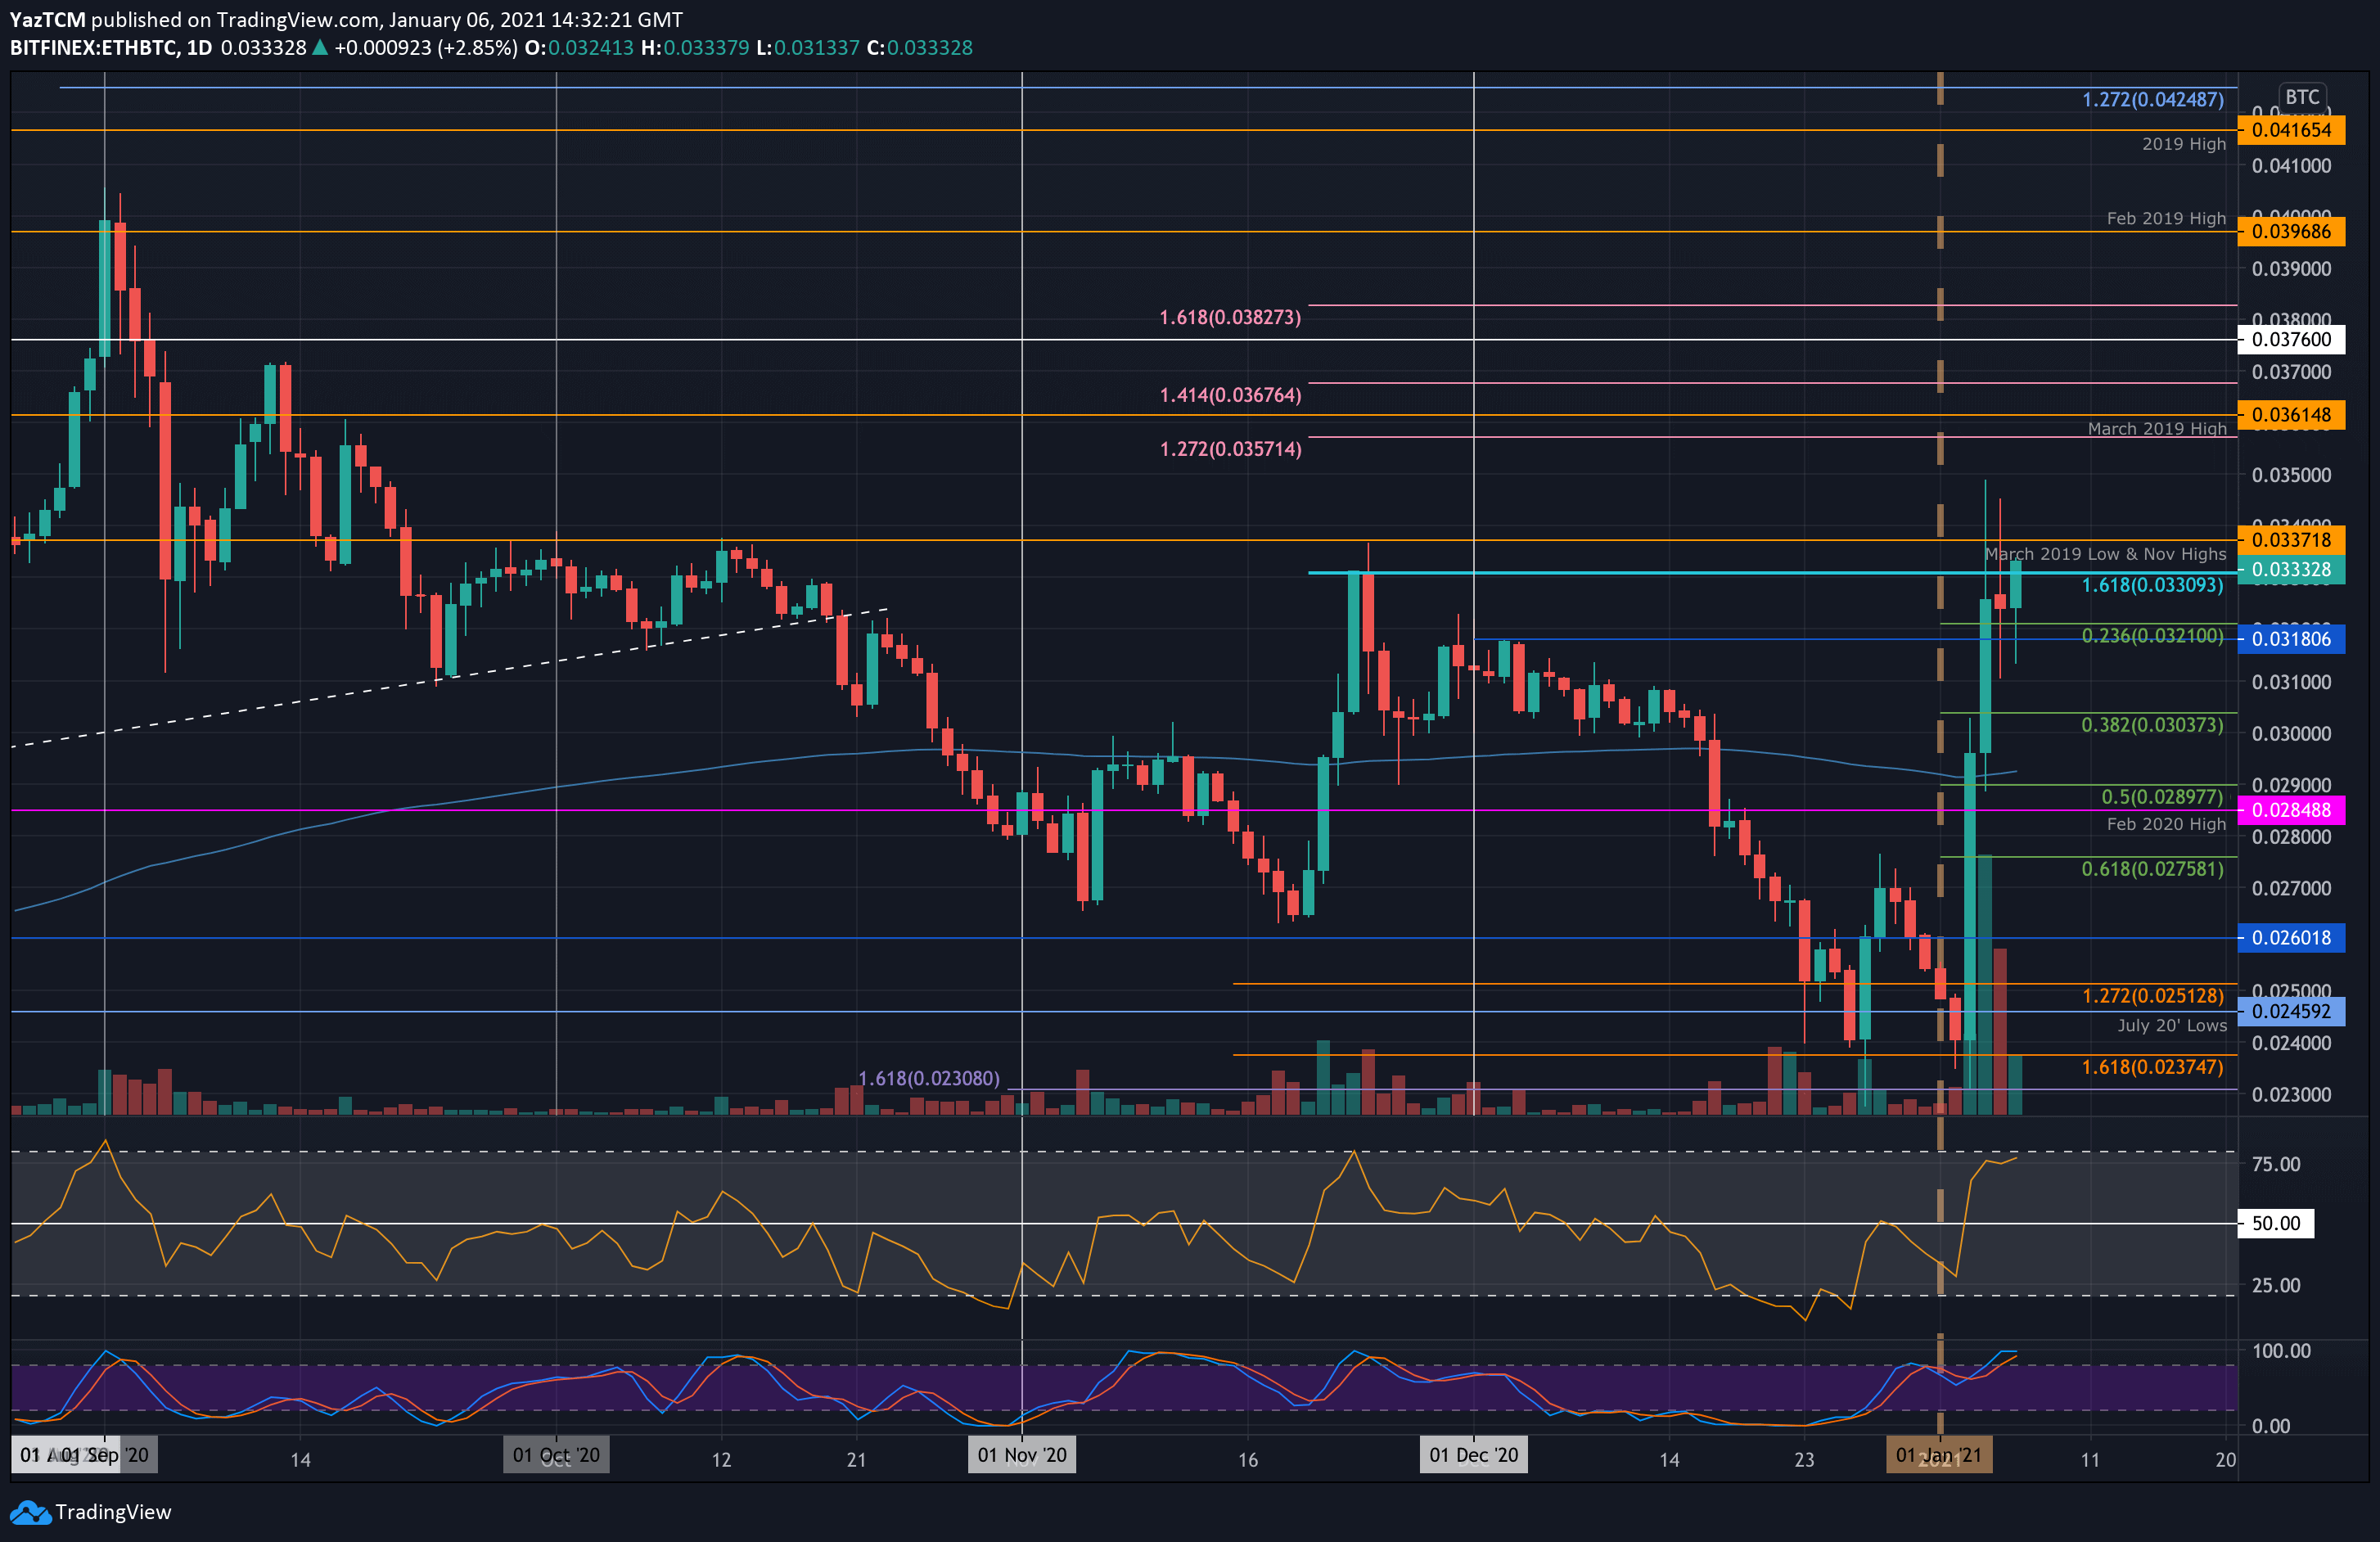
Against Bitcoin, Ethereum continued to propel upward from the 2021 support at 0.024 BTC. On Sunday, ETH closed above the 200-days EMA at around 0.029 BTC and continued higher to the 0.033 BTC (Nov 2020 High-day Closing price) resistance at the start of this week. It did spike higher above here on Monday, creating a new 3-month high near 0.035 BTC but is still yet to close above 0.033 BTC.
Today, ETH penetrated further above the 0.033 BTC resistance as it now trades at 0.0333 BTC. A closing candle above 0.033 BTC is required to confirm the break higher toward the November highs.
ETH-BTC Short Term Price Prediction
Moving forward, the first level of resistance lies at 0.0337 BTC (Nov 2020 Highs). This is followed by 0.035 BTC, 0.0357 BTC (1.272 Fib Extension), and 0.0361 BTC (March 2019 Highs). Added resistance is expected at 0.0367 BTC and 0.0376 BTC.
On the other side, the first level of support lies at 0.0321 BTC (.236 Fib). This is followed by 0.0318 BTC (December 2020 highs), 0.0303 BTC (.382 Fib), and 0.029 BTC (200-days EMA).
The RSI is also approaching overbought conditions here but still has room for the bullish momentum push ETH higher before becoming overextended.