Ethereum Price Analysis: ETH Shows Strong Performance, Is $235 At Sight?
Ethereum has seen a 2% price rise over the past 24 hours and it’s currently trading at around $219. The cryptocurrency had managed to remain above a rising support trend line which helped its price increase by a total of 11% throughout the previous 6 days.
Ethereum remains the second-largest cryptocurrency with a market cap of $23.64 billion. ETH is still up by a total of 37% over the past 3 months making it the strongest performer in the top 5 projects behind Bitcoin.
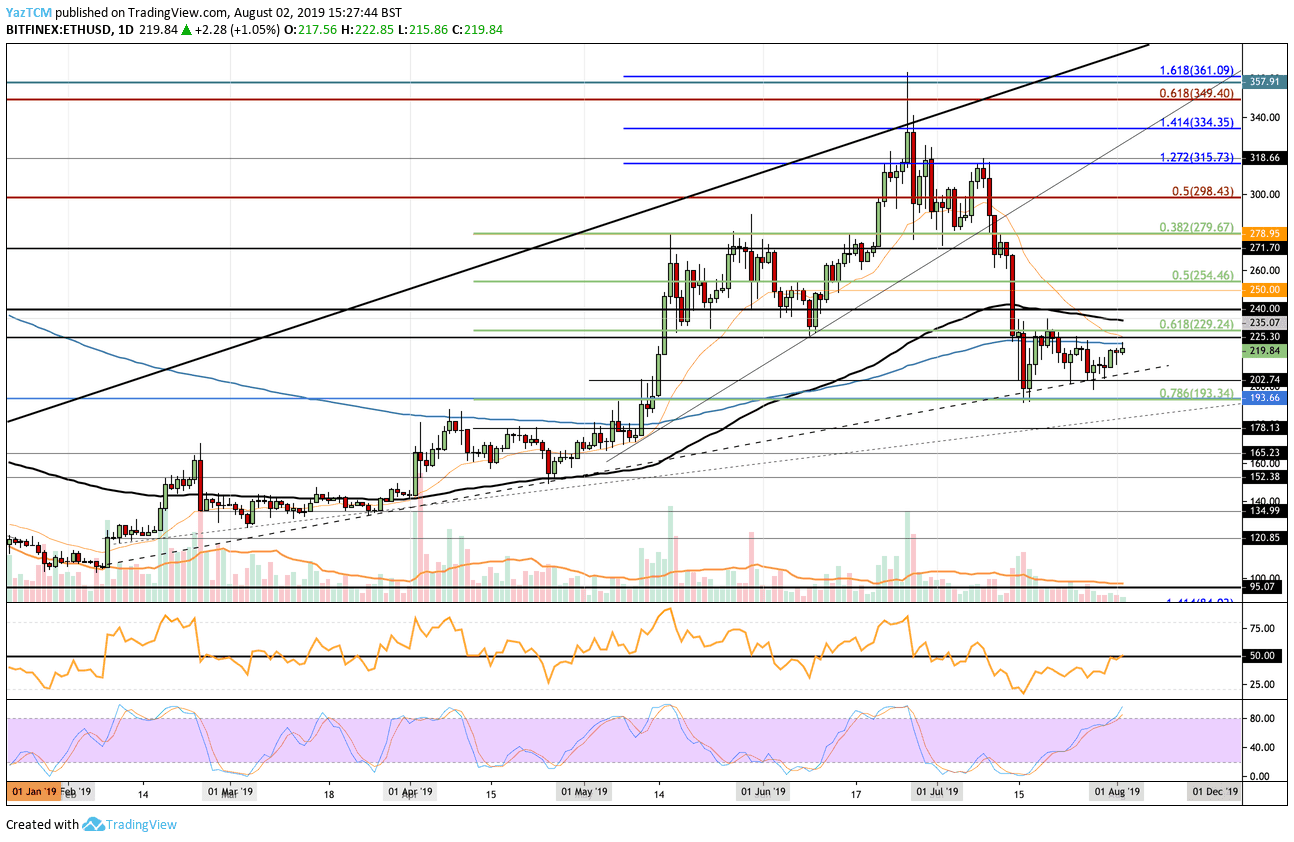
Looking at the ETH/USD 1-Day Chart:
- Since our previous ETH/USD analysis, we can see that the support at $202 and the rising trend line held very well which allowed ETH to rise to where it currently trades at resistance provided by the 200 days EMA at $220.
- From above: If the bulls can break above $220 and the subsequent resistance at $230, we can expect immediate resistance at $235 which is provided by the 100 days EMA. This is then followed by resistance at $240. Once ETHUSD has cleared this congestion, higher resistance lies at $250, $271, $279, and $298.
- From below: The nearest level of support lies at the rising trend line (around $205). This is then followed up with strong support at $202 and $200. If the sellers break beneath $200, further support is found at $193 (.786 Fib Retracement), $178, $165, and $152.
- The trading volume still remains very low with no signs of increasing.
- The RSI has recently risen toward the 50 level as the bulls attempt to gain control of the momentum. However, the Stochastic RSI suggests that the market may be extremely overbought as we wait for a bearish crossover signal to confirm this.
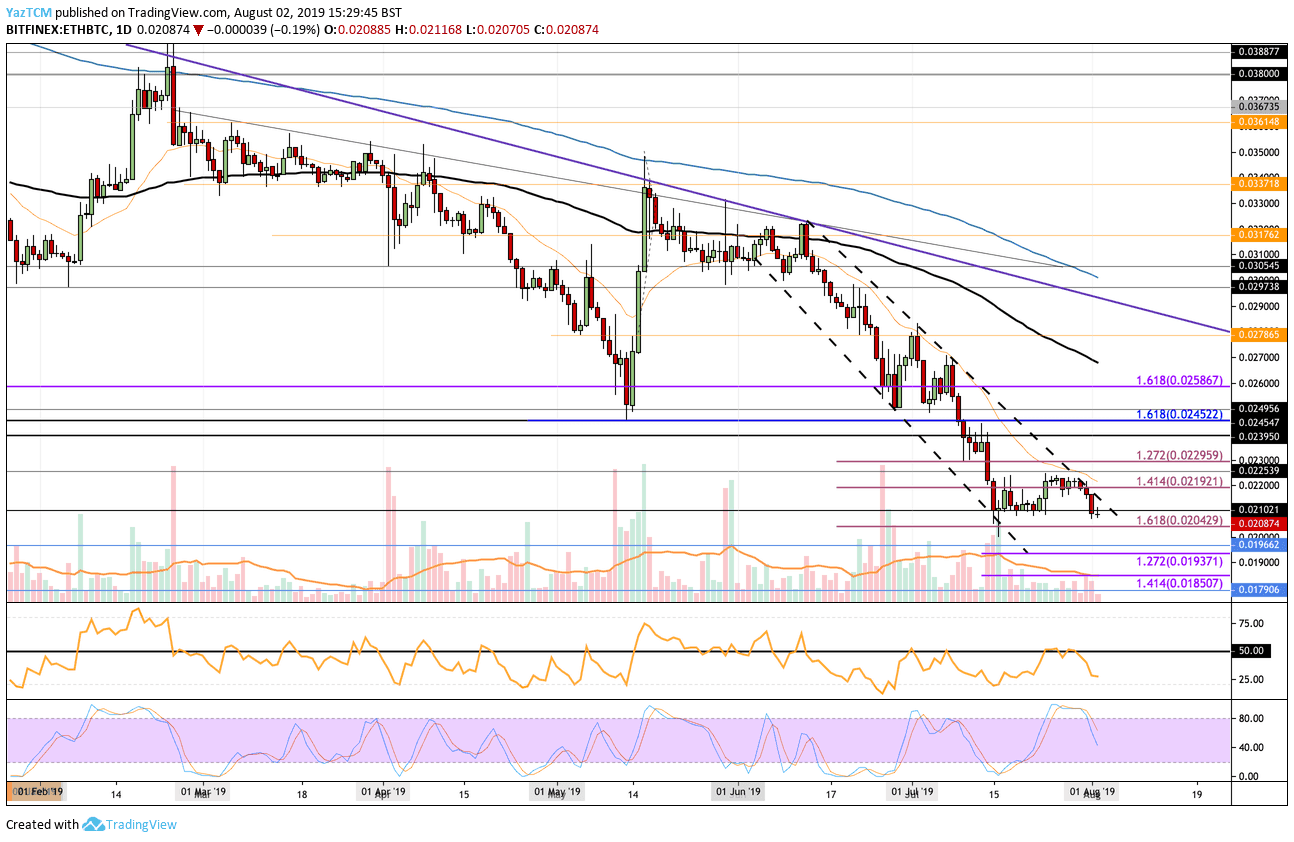
Looking at the ETH/BTC 1-Day Chart:
- Against Bitcoin, we can see that the resistance at 0.022 BTC was too strong for the bulls which caused ETH to reverse and fall. The market has fallen along the contour of our steep descending trend line and was unable to break above this level.
- From above: The nearest level of resistance lies at 0.021 BTC. Above this, higher resistance is found at the upper boundary of the steep downtrend channel. If the bulls can break above the channel, resistance lies at 0.02192 BTC, 0.0225 BTC, 0.023 BTC, and 0.02390 BTC.
- From below: The nearest level of support lies at the downside 1.618 Fibonacci Extension level at 0.02042 BTC. If the sellers continue further below 0.02 BTC, we can find support at 0.01966 BTC, 0.01937 BTC, and 0.018507 BTC.
- The RSI had recently been turned away from the 50 level which confirms that the sellers are still in complete control of the market momentum.
The post Ethereum Price Analysis: ETH Shows Strong Performance, Is $235 At Sight? appeared first on CryptoPotato.