Ethereum Price Analysis: ETH Showing Strength Against BTC, Still 30% Below Feb Highs
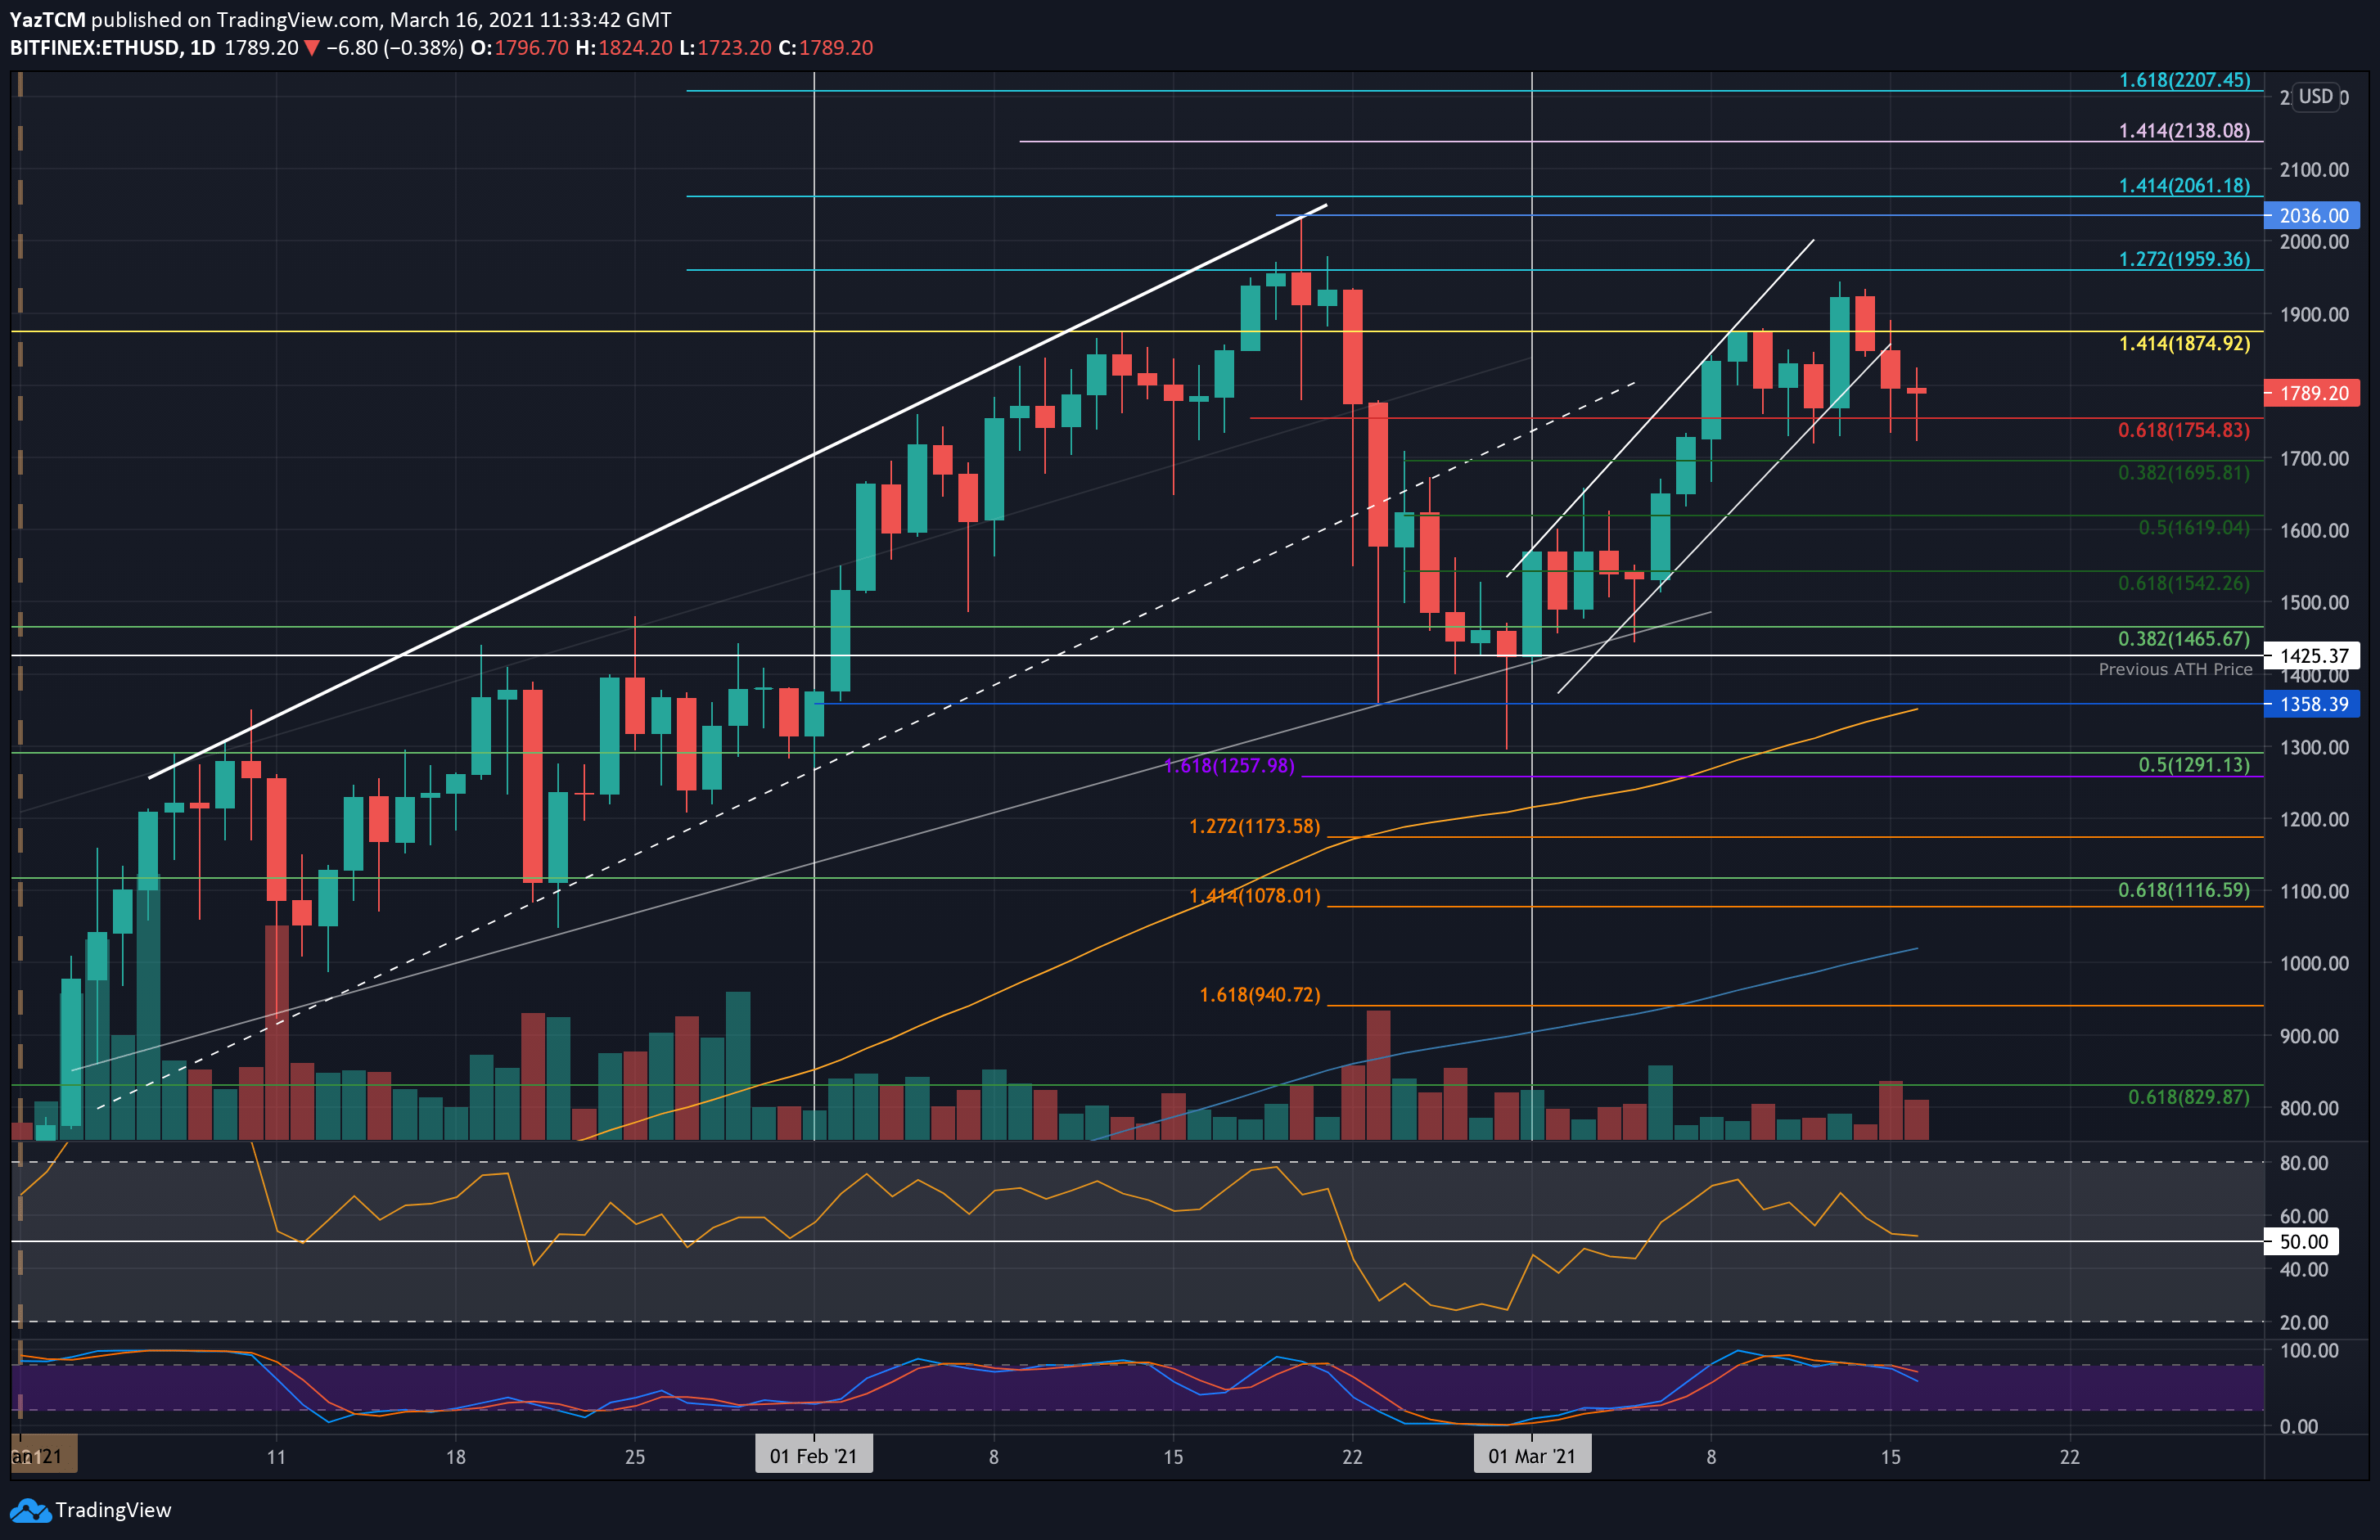
ETH/USD – Market Falls Beneath Ascending Price Channel
Key Support Levels: $1755, $1695, $1620.
Key Resistance Levels: $1800, $1875, $1940.
Ethereum performed well over the weekend, clocking in a fresh March high at $1940 on Saturday. It dropped back below $1900 on Sunday and continued to break beneath the March ascending price channel yesterday with the 5.2% price fall.
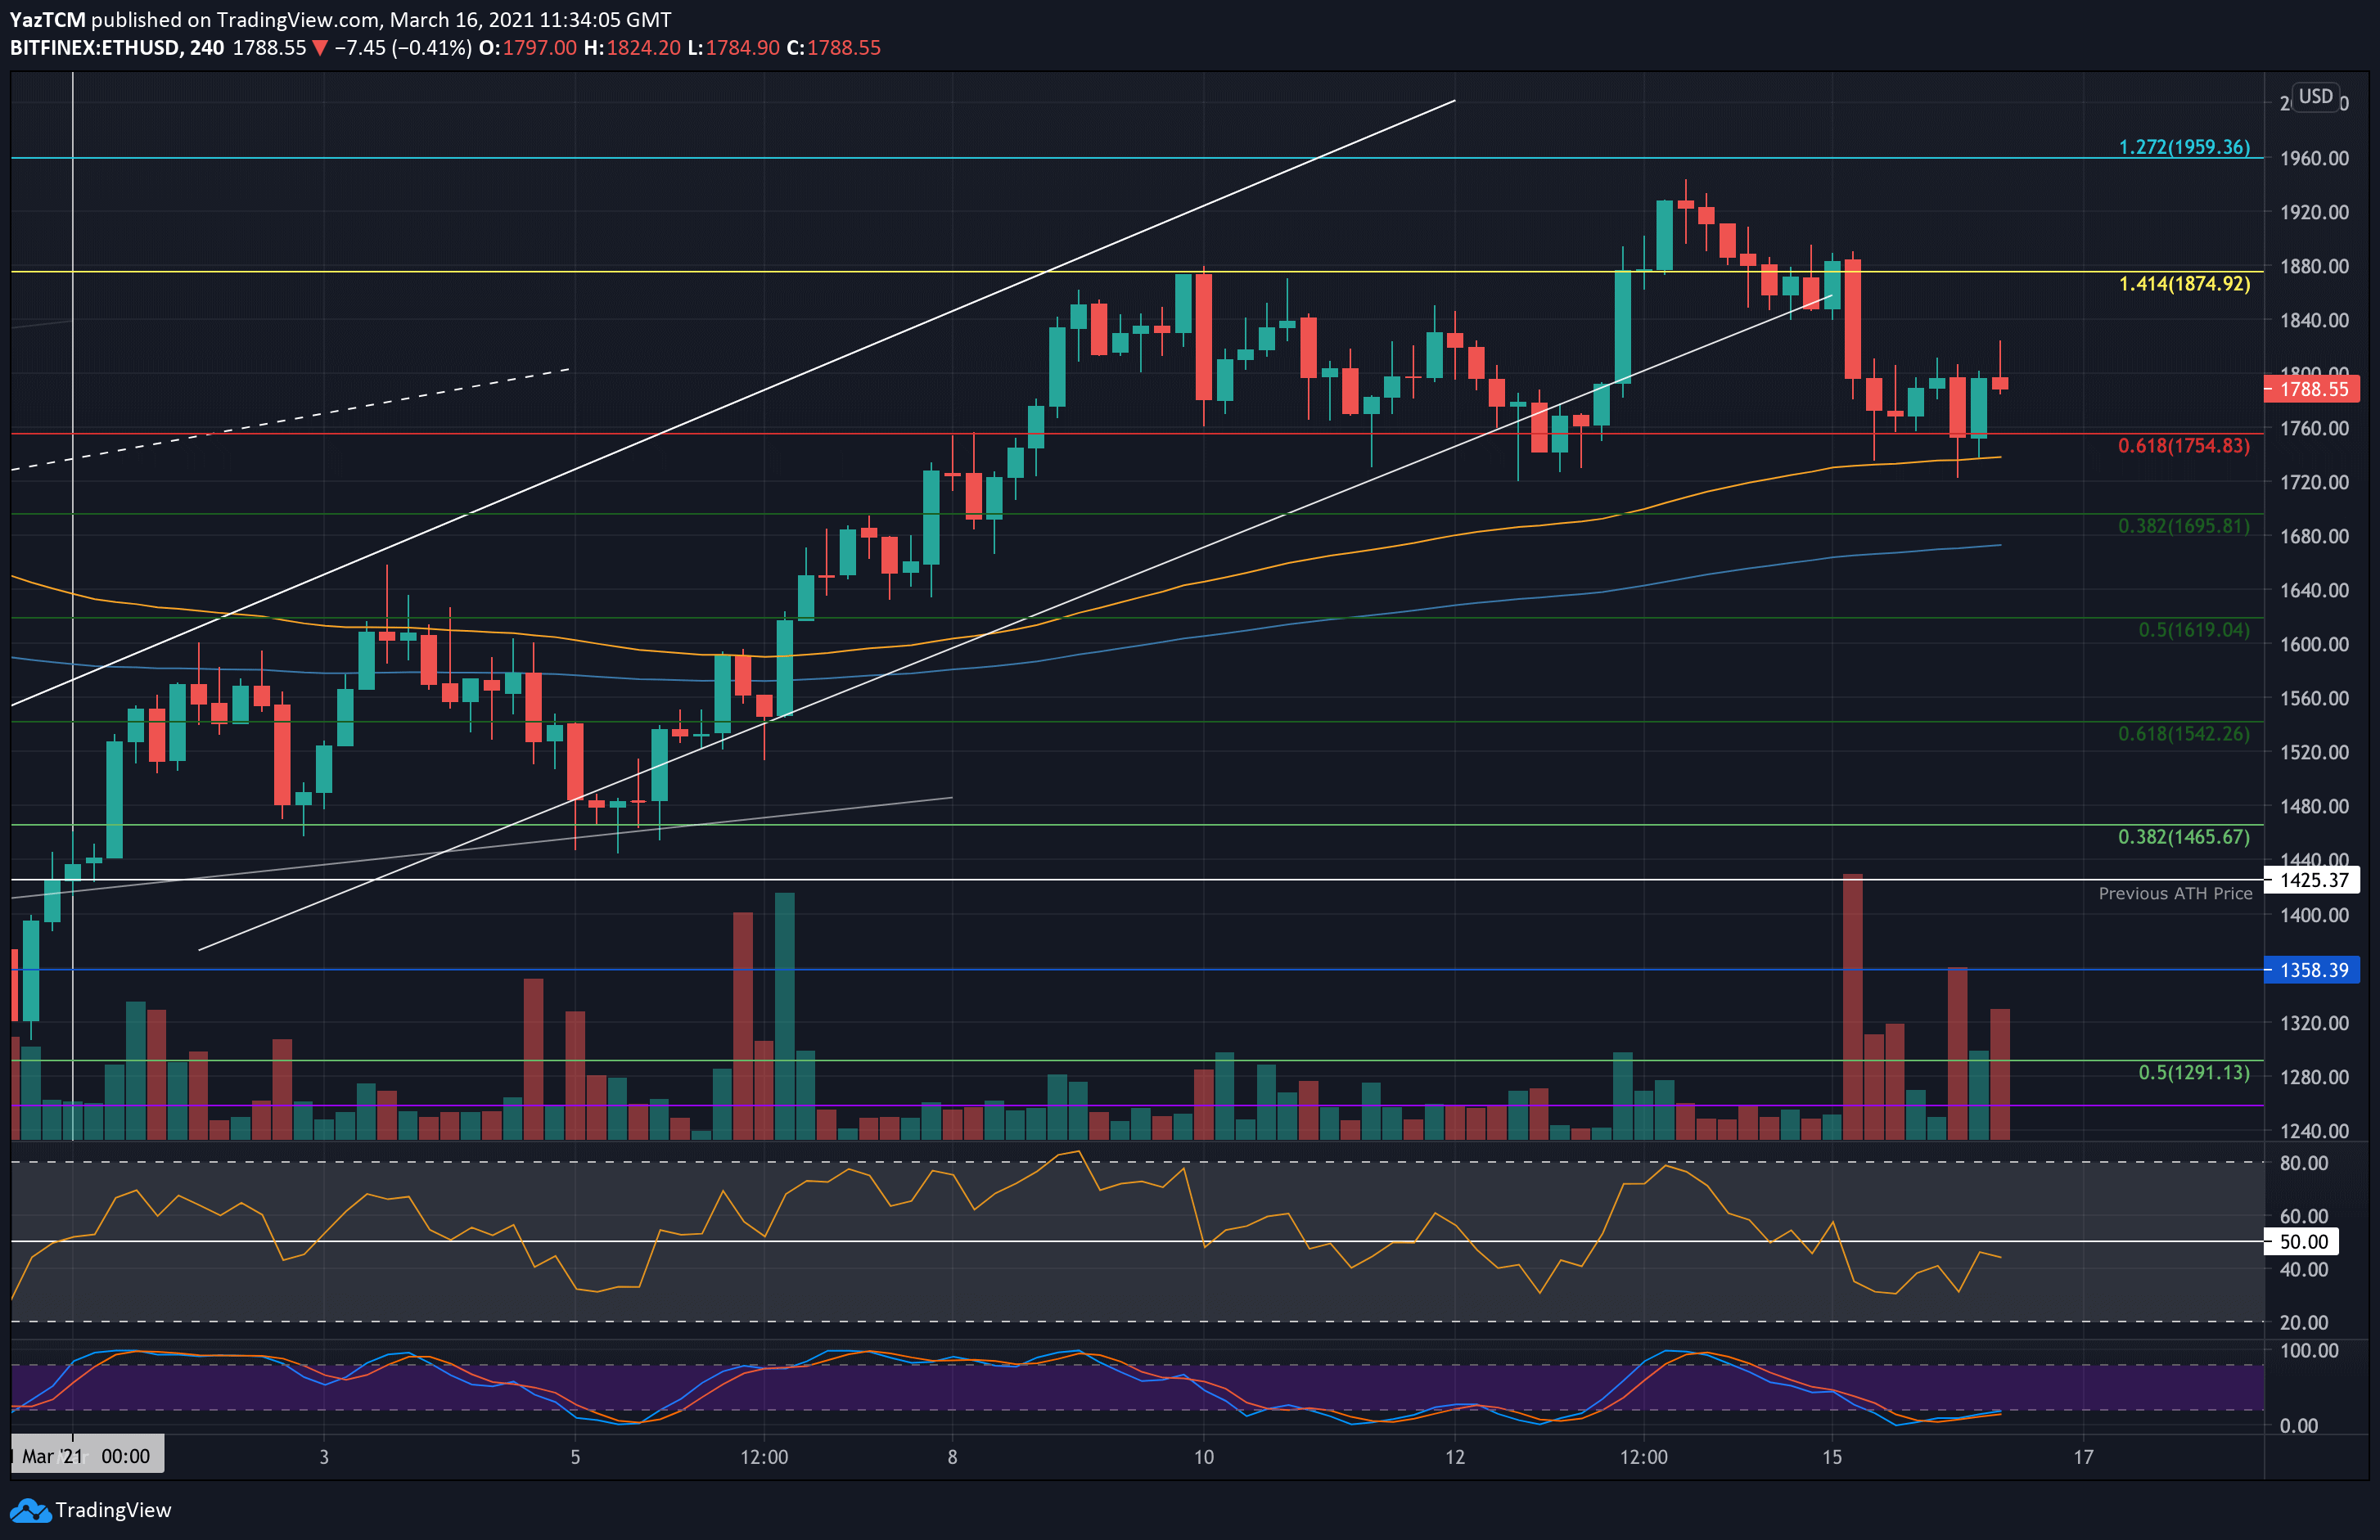
The price drop caused ETH to head back into previous resistance at $1755, which had provided support for the market throughout last week. This level is best seen on the 4-hour charts. It has since rebounded from there and is trading around $1790.


ETH-USD Short Term Price Prediction
Looking ahead, the first level of support lies at $1755. This is followed by $1695 (.382 Fib), $1620 (.5 Fib), and $1540 (.618 Fib).
On the other side, the first resistance is expected at $1800. This is followed by $1875 (1.414 Fib Extension), $1940 (March 2021 highs), and $1960 (1.272 Fib Extension & All-time high-day opening price).
The RSI has plummeted into the midline, indicating indecision within the market. If it drops beneath 50, the bearish momentum will increase and is likely to drive ETH beneath last week’s support.
ETH/BTC – Bulls Break Above 200-days EMA.
Key Support Levels: 0.0318 BTC, 0.031 BTC, 0.0305 BTC.
Key Resistance Levels: 0.0337 BTC, 0.035 BTC, 0.0361 BTC.
Ethereum has been struggling against Bitcoin since early-Feb when it dropped from 0.046 BTC to reach as low as 0.03 BTC by the end of the month. In the first week of March, ETH rebounded but could not overcome the resistance at 0.035 BTC last week.
It rolled over from there during the week to find support at 0.0305 BTC (.886 Fib) over the weekend. It has since rebounded from 0.0305 BTC and recently broke back above the 200-day EMA at 0.0323 BTC.

ETH-BTC Short Term Price Prediction
Looking ahead, the first level of resistance above 0.0323 BTC (200-days EMA) lies at 0.0337 BTC (November 2020 Highs & 100-days EMA). This is followed by 0.035 BTC, 0.0361 BTC (March 2019 Highs), and 0.038 (bearish .5 Fib).
On the other side, the first support is located at 0.0318 BTC (December 2020 highs). This is followed by 0.031 BTC (.786 Fib), 0.0305 BTC (.886 Fib), and 0.03 BTC.
The RSI is now back at the midline, indicating indecision within the market. For the price to continue above the 200-day EMA, the RSI must push higher to indicate bullish momentum.


