Ethereum Price Analysis: ETH Rejected at $620 Again as Price Crashes 5% Daily
ETH/USD – Ethereum Bulls Struggle With $620
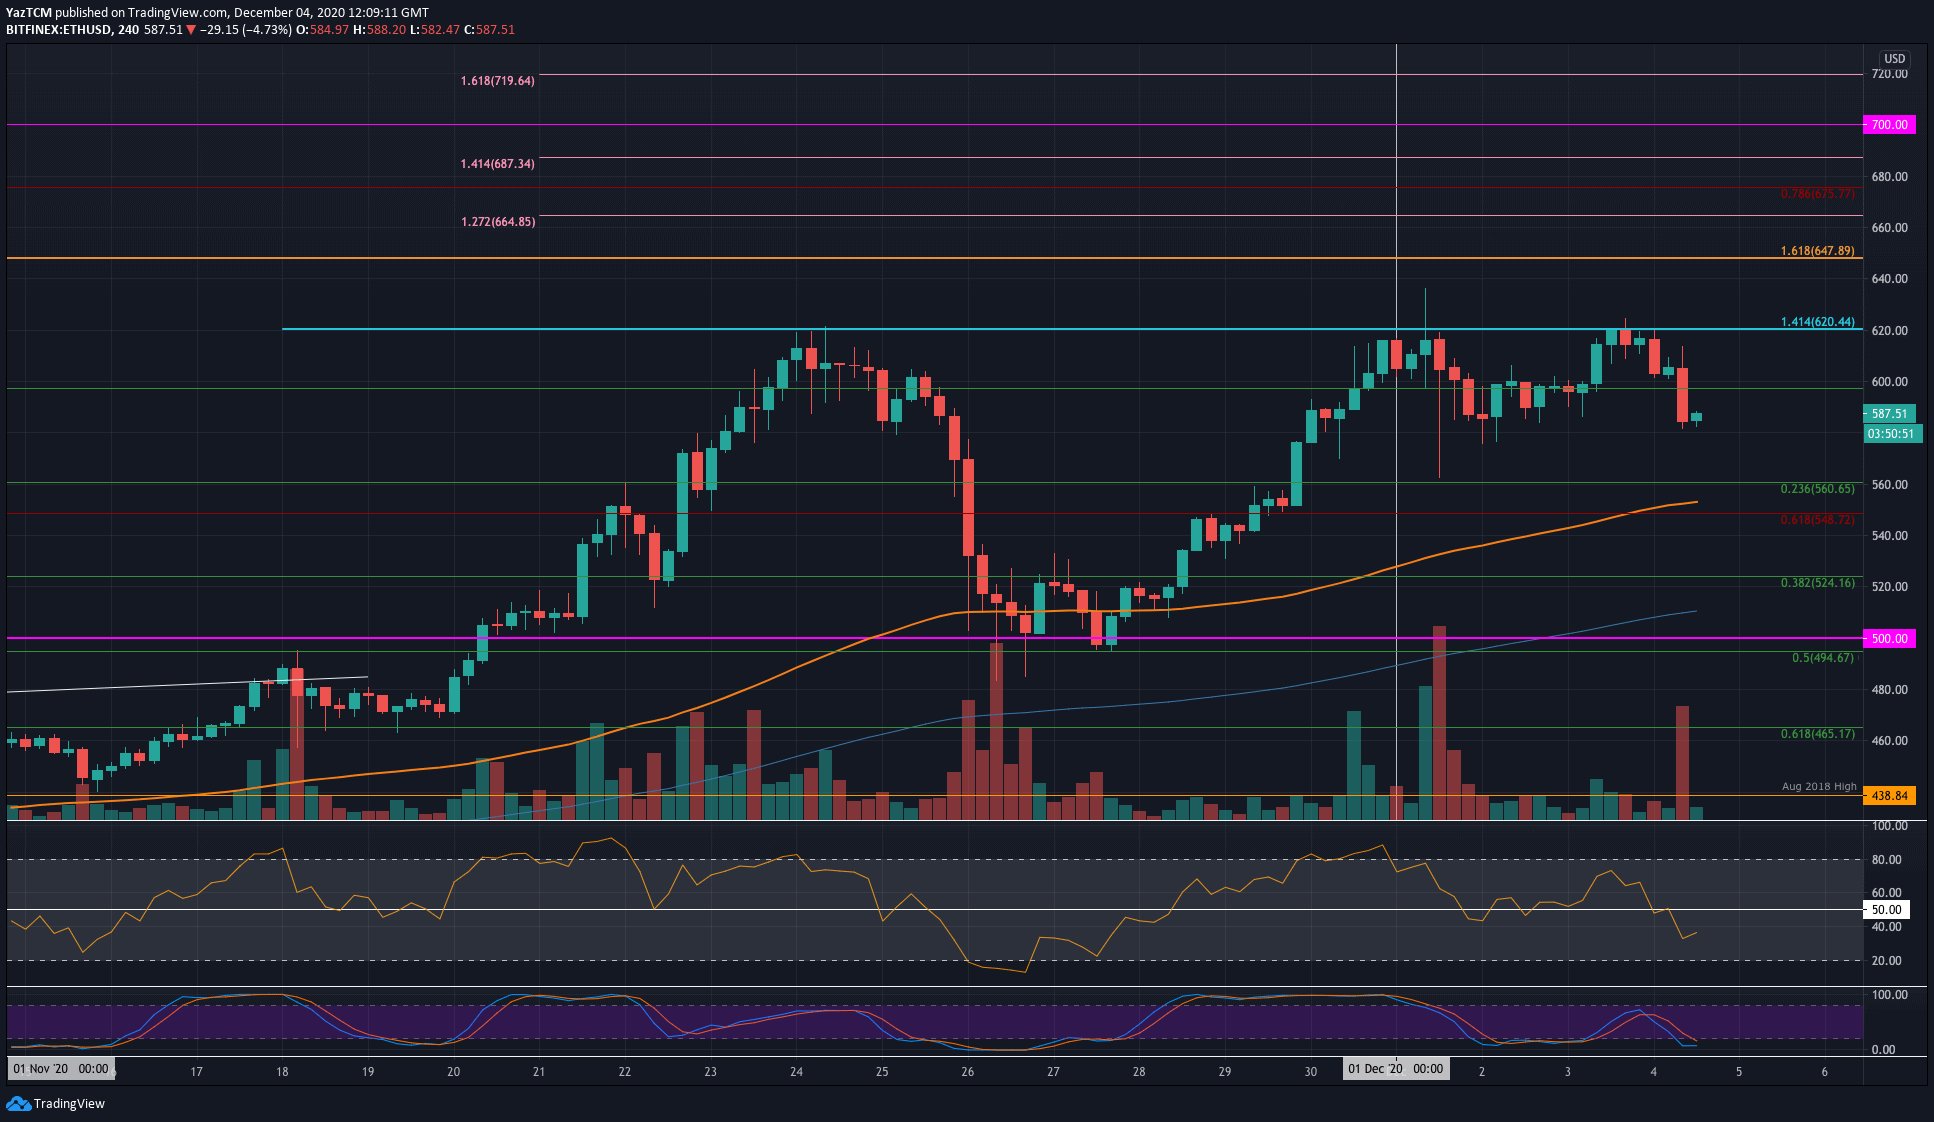
Key Support Levels: $585, $560, $550.
Key Resistance Levels: $600, $620, $650.
Yesterday, Ethereum moved higher to test the resistance at $620 (1.414 Fib Extension). This level had stalled the market during November and early December and is the next price point to break above to turn bullish again.
It was unable to break $620 on the third attempt and fell lower today as it crashed beneath $600 to hit the $585 support.
ETH-USD Short Term Price Prediction
Looking ahead, if the bulls can defend $585 and push higher, the first level of resistance lies at $600. This is followed by $620, $650, and $665.
If the sellers break $585, support is expected at $560 (.236 Fib). This is followed by $550, $525 (.382 Fib), and $500.
The 4HR RSI penetrated beneath the mid-line today, suggesting the sellers have taken control of the market momentum.
ETH/BTC – Rangebound Between 0.0318 BTC and 0.031 BTC
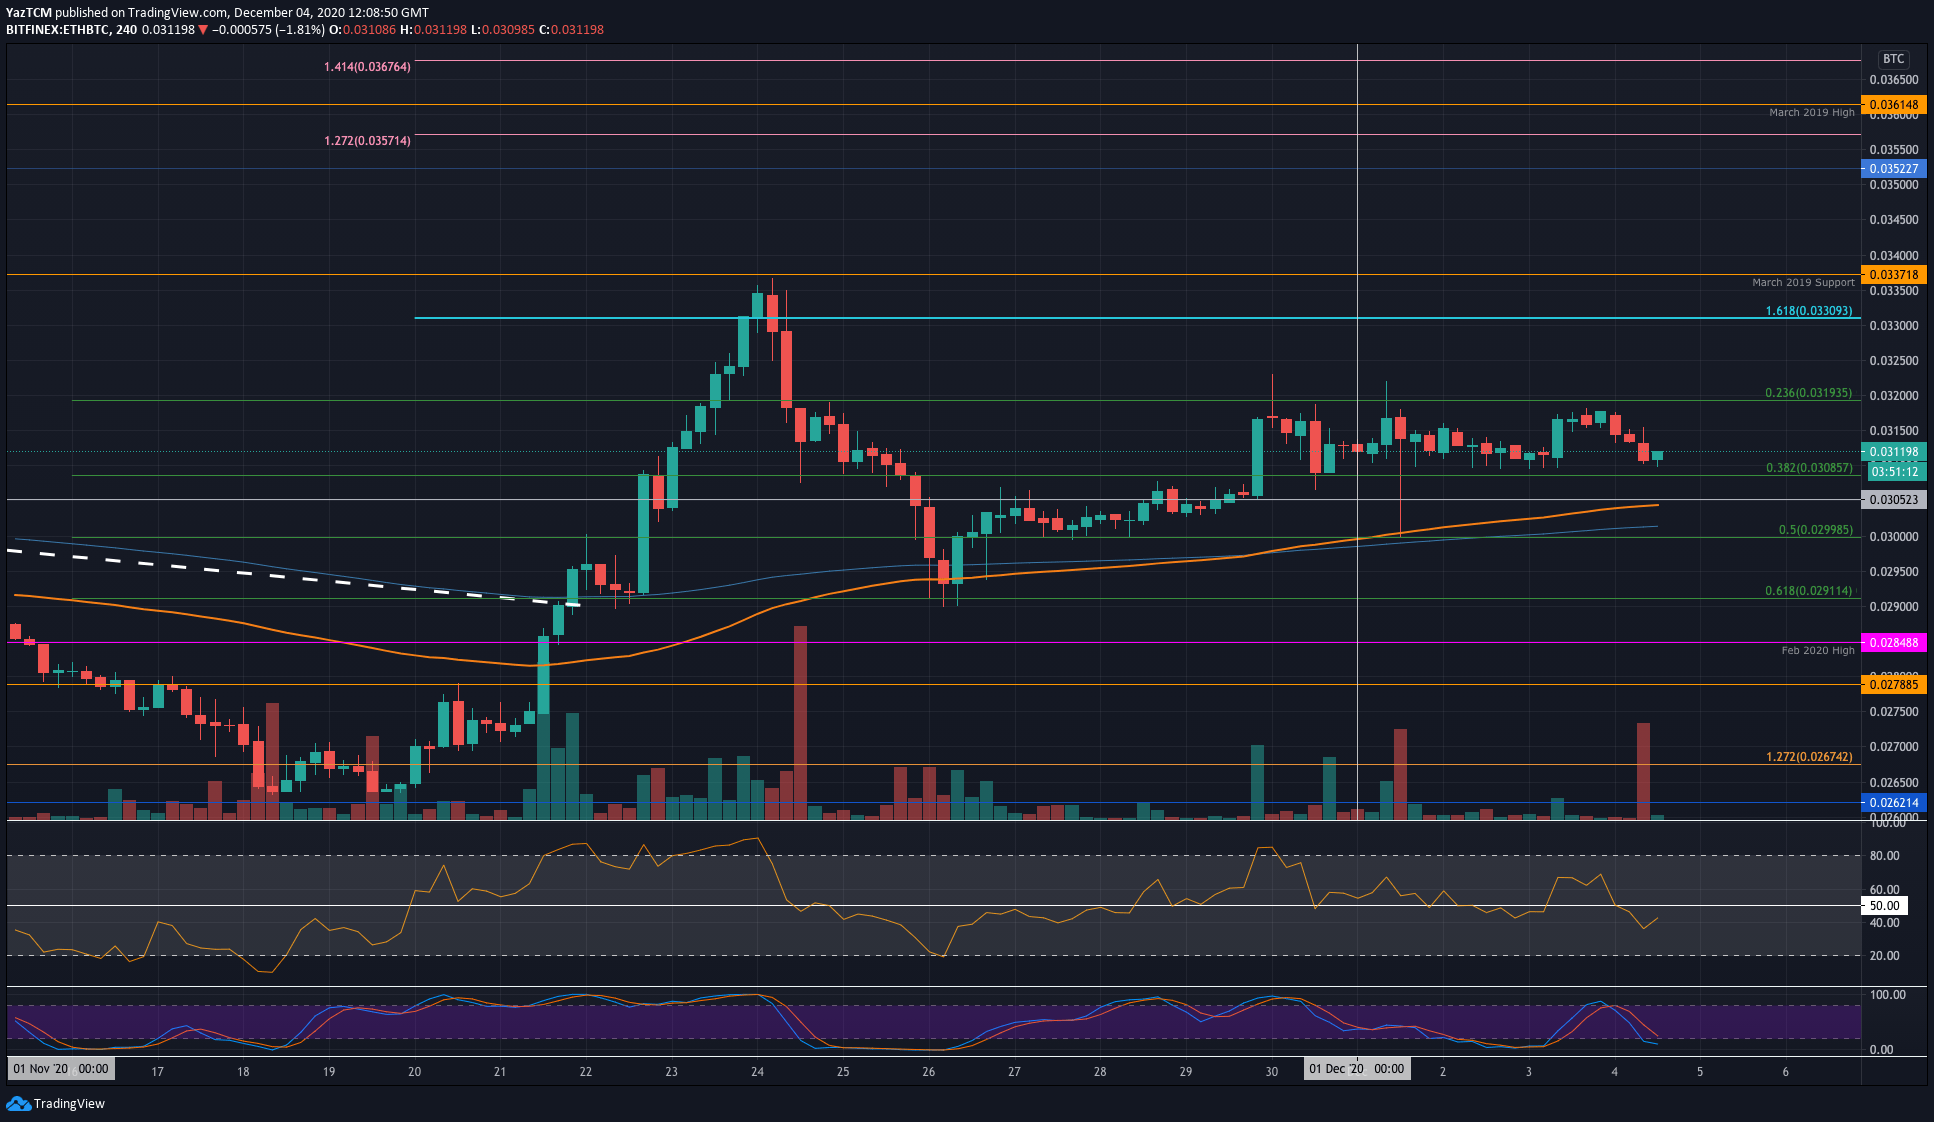
Key Support Levels: 0.0308 BTC, 0.0305 BTC, 0.03 BTC.
Key Resistance Levels: 0.0315 BTC, 0.032 BTC, 0.033 BTC.
Ethereum has been rangebound in December between 0.0318 BTC and 0.031 BTC. The cryptocurrency will need to break out of this range to establish the next direction for the market.
A breakout toward the upside would allow ETH to go ahead and test the November resistance at 0.0337 BTC, but a break beneath 0.031 BTC might see the coin heading beneath 0.03 BTC.
ETH-BTC Short Term Price Prediction
Looking ahead, the first level of resistance lies at 0.0315 BTC. Above 0.032 BTC, resistance lies at 0.033 BTC, 0.0337 BTC (March 2019 Support & November 2020 High), and 0.0345 BTC.
On the other side, support is first expected at 0.0308 BTC (.382 Fib). Beneath this, support lies at 0.0305 BTC, 0.03 BTC (.5 Fib), and 0.0291 BTC (.618 Fib).
The 4HR RSI is above the mid-line and is rising to indicate increased bullish momentum within the market.