Ethereum Price Analysis: ETH Rejected at $4K Again, Is $3.5K Next?
Ethereum recently faced a minor rejection at the critical $4K resistance zone, underscoring the presence of sellers at this level.
A pullback toward the $3.5K support area may follow, providing an opportunity for buyers to re-enter the market with the goal of reclaiming the $4K threshold.
Technical Analysis
By Shayan
The Daily Chart
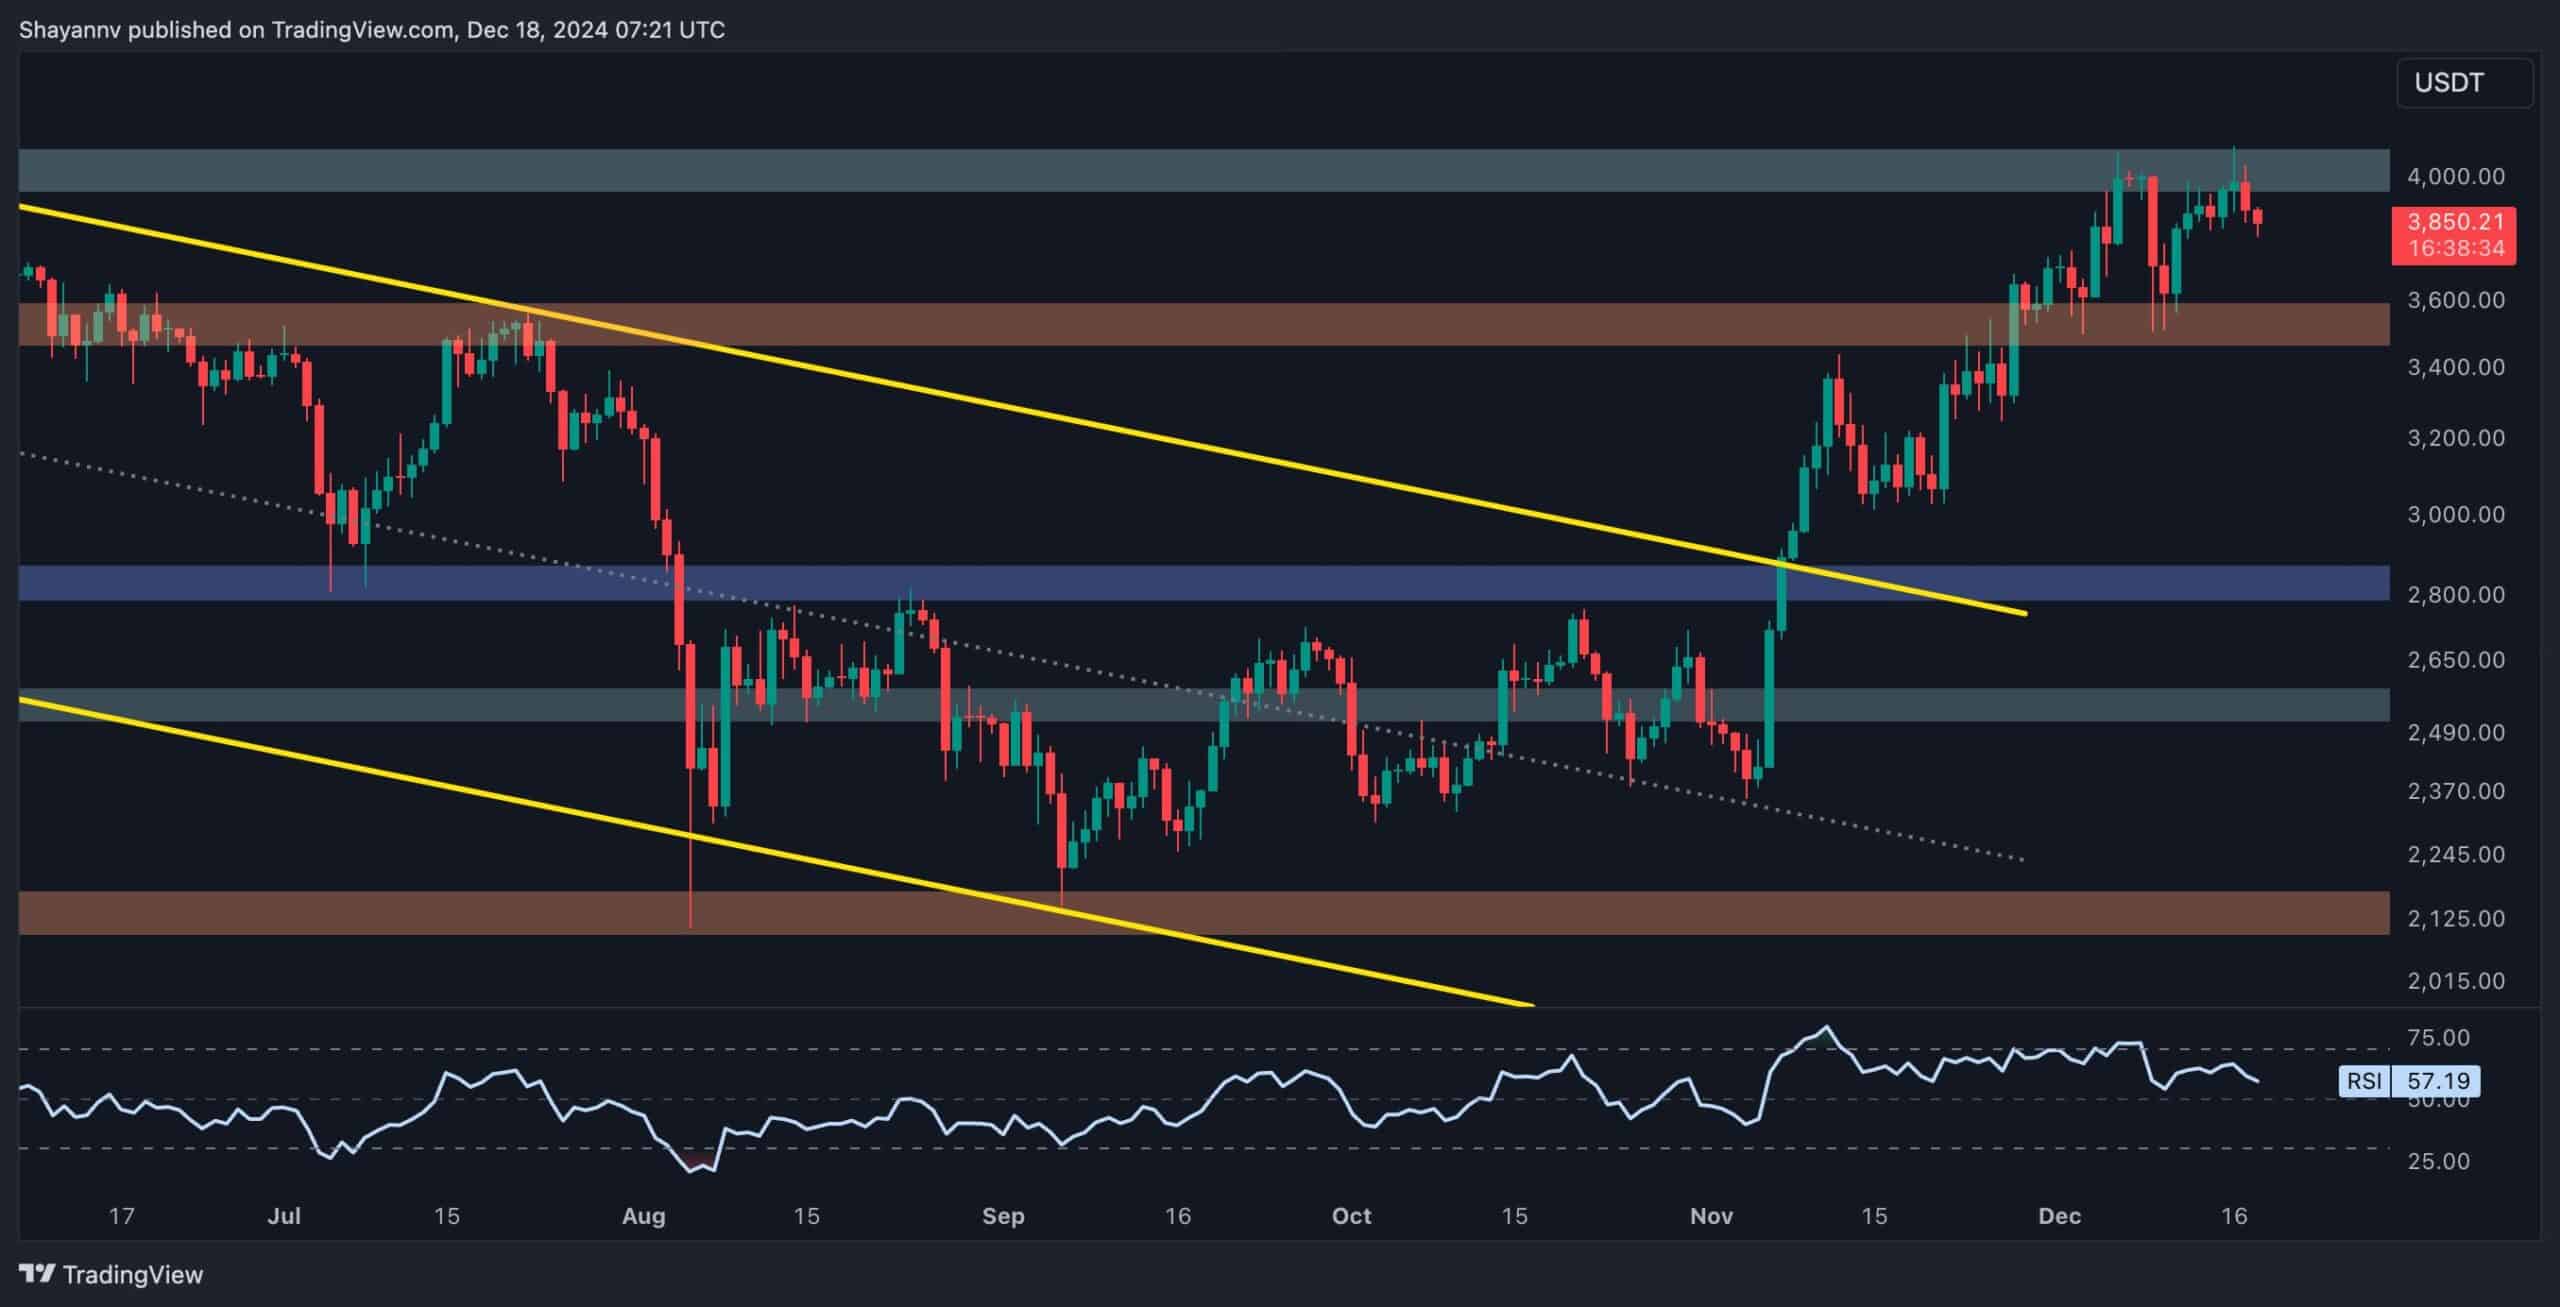
Ethereum recently faced another rejection at the pivotal $4K resistance level, highlighting the strong presence of sellers in this zone. This has created a challenging environment for buyers attempting to sustain the uptrend toward a new all-time high.
The price action suggests the formation of a double-top bearish reversal pattern, signaling the potential for a retracement toward the $3.5K support zone. Ethereum remains range-bound between $3.5K and $4K, with a breakout likely after the consolidation phase. A bullish breakout above $4K would pave the way for further upward momentum.
The 4-Hour Chart
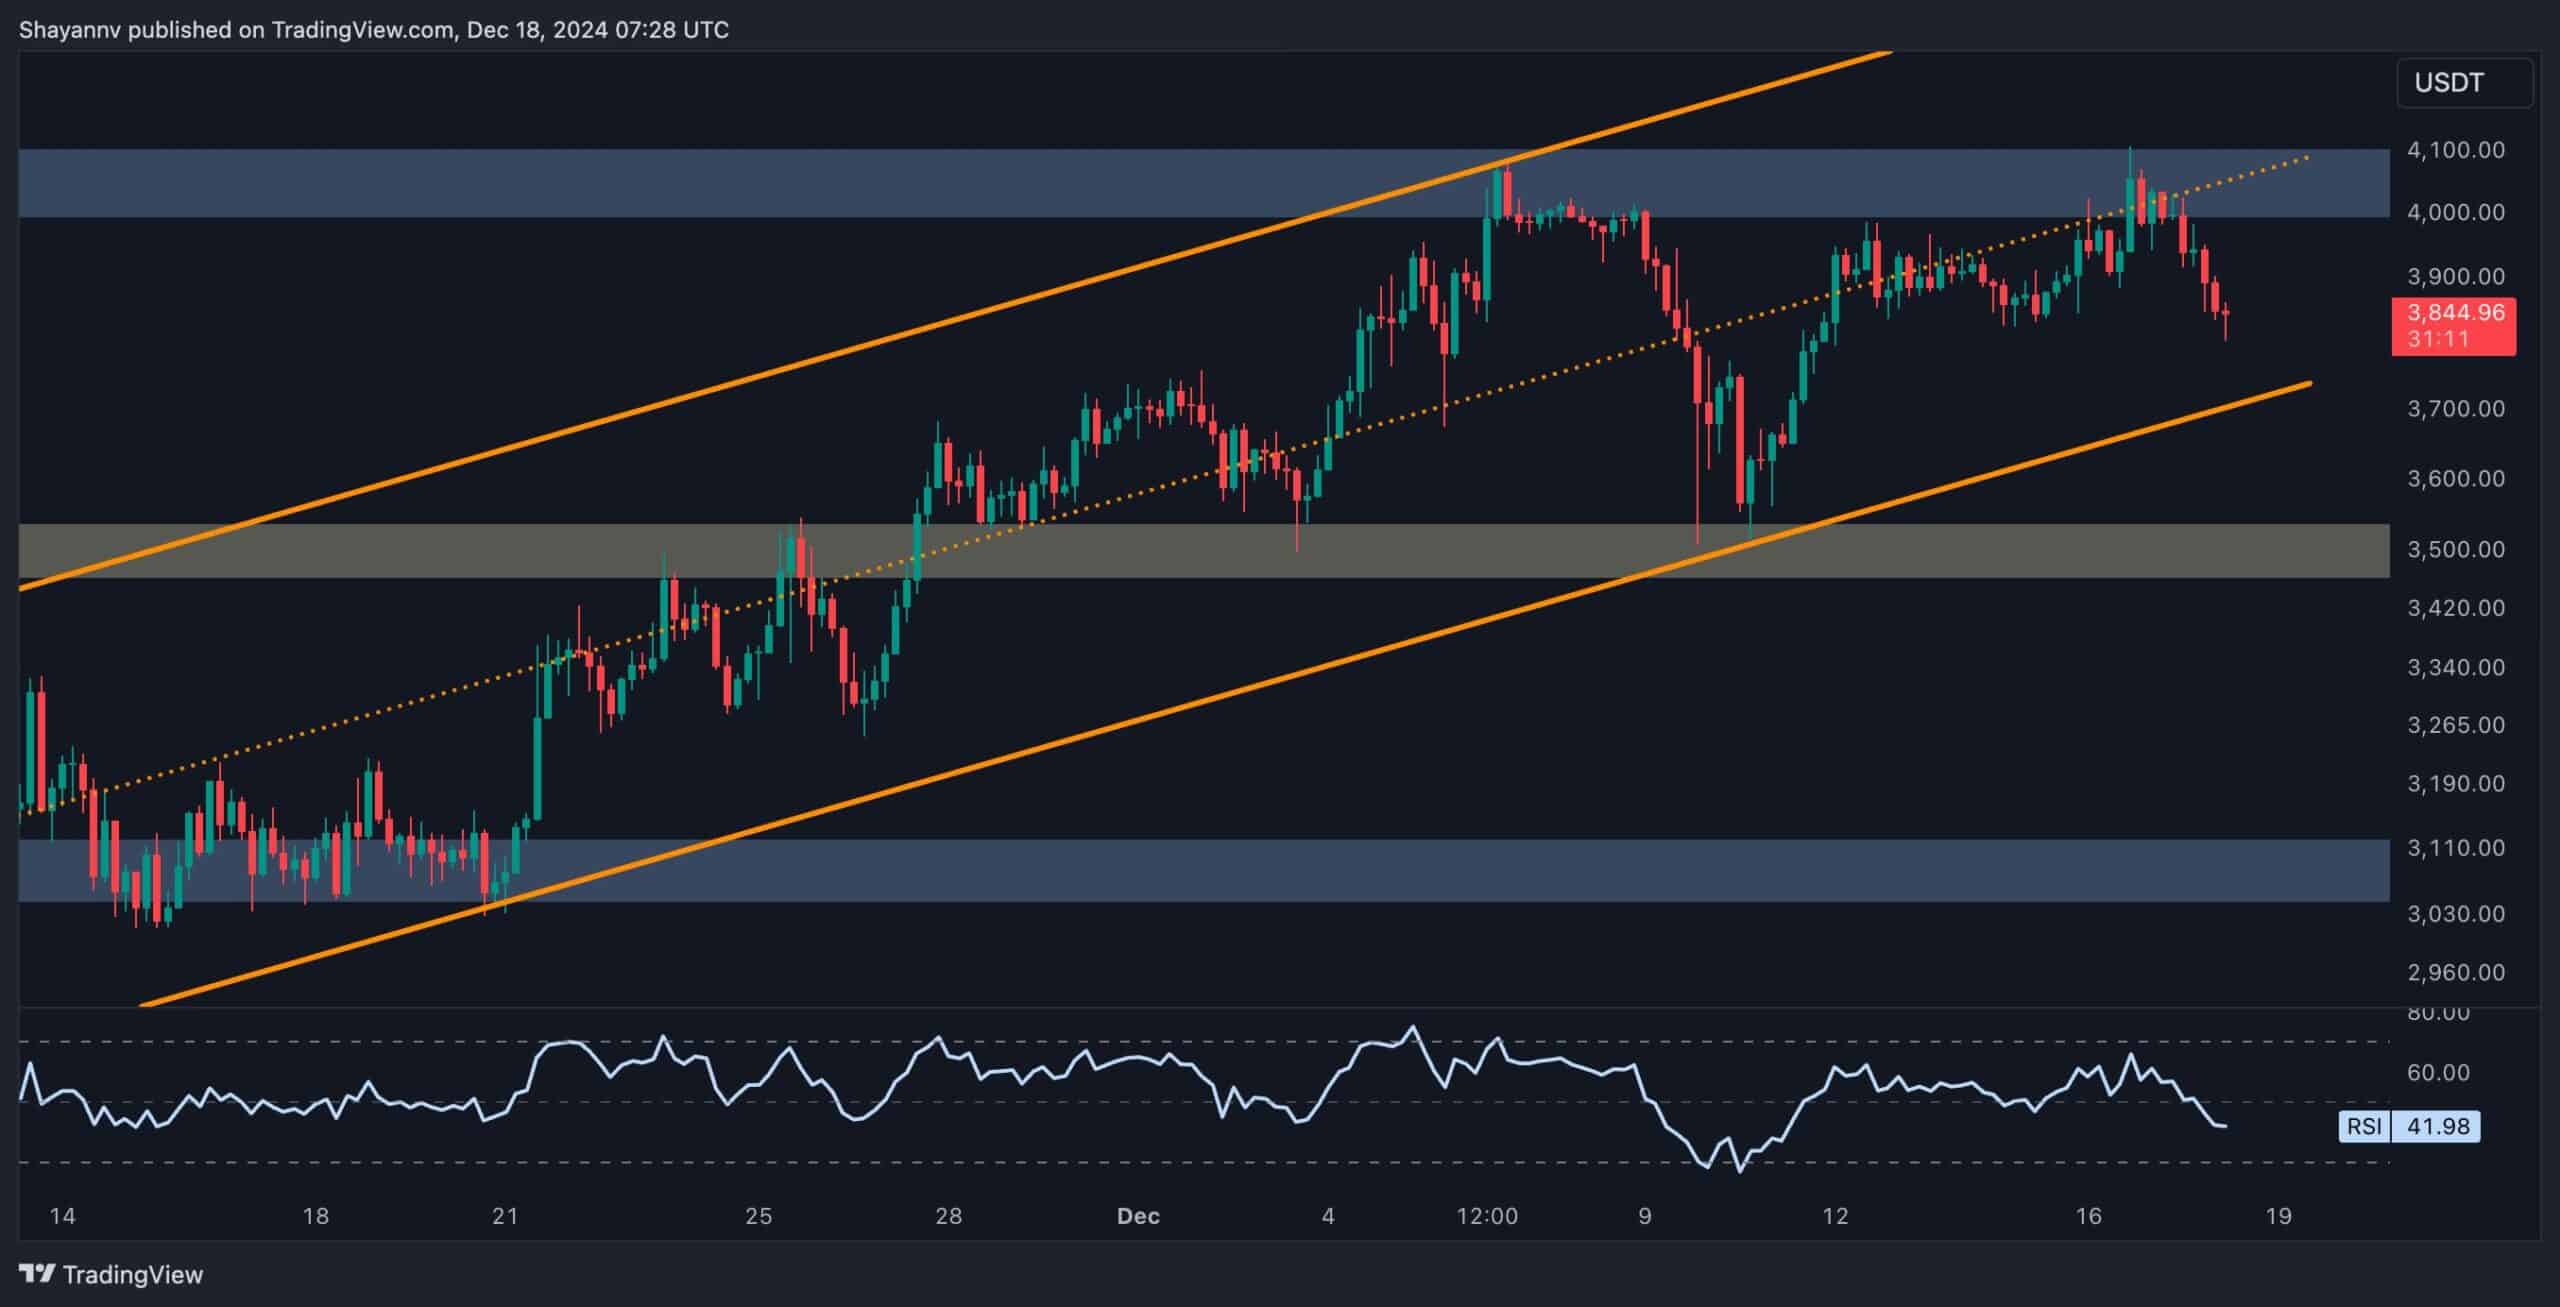
On the 4-hour timeframe, ETH showed renewed strength after buyers stepped in near the ascending channel’s lower boundary. This buying activity sparked a fresh rally, driving the price toward the channel’s middle boundary, aligning with the critical $4K resistance level.
However, the asset encountered a rejection at this zone, leading to a decline. Ethereum is now oscillating between the lower boundary of $3.7K and the $4K resistance. In the mid-term, further bearish retracement toward the lower boundary, followed by a renewed attempt to reclaim the $4K resistance, appears likely. A successful breakout above $4K could signal the continuation of Ethereum’s bullish trend.
Onchain Analysis
By Shayan
This chart illustrates Ethereum’s Binance liquidation heatmap, highlighting potential price levels where significant liquidation events could occur. The clustering of liquidation levels within a specific range suggests that the price will likely move toward that zone. These levels serve as valuable indicators for predicting price direction and identifying areas of potential convergence.
As shown, there is a notable concentration of liquidity just above the critical $4K resistance, representing the liquidation levels for short positions. This makes the $4K region an attractive target for whales and large institutional players, increasing the likelihood of a bullish breakout in the mid-term.
The post Ethereum Price Analysis: ETH Rejected at $4K Again, Is $3.5K Next? appeared first on CryptoPotato.


