Ethereum Price Analysis: ETH Records a Fresh 2019 High Over $337
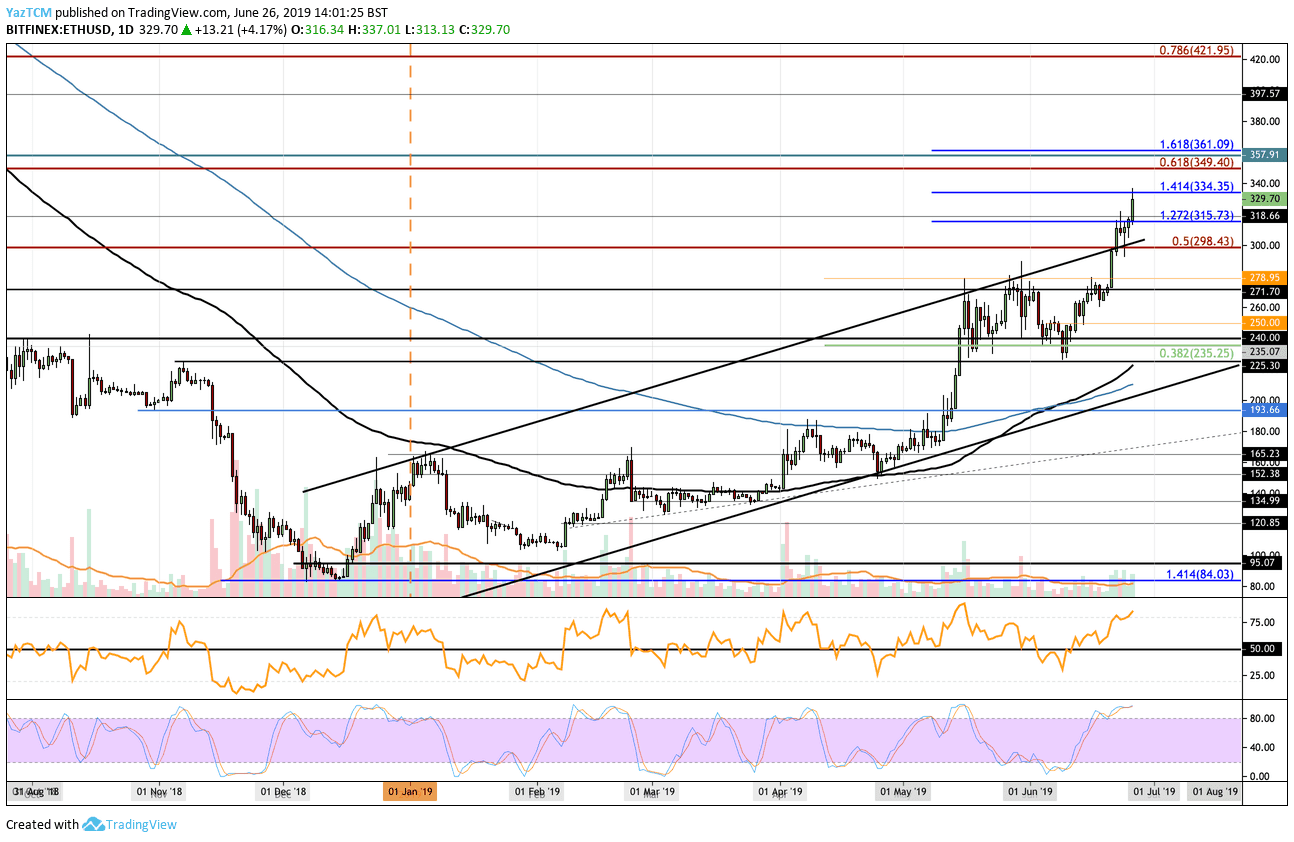
Although Ethereum may be struggling heavily against BTC, the recent Bitcoin break above $12,500 has allowed ETH to surge by 11.40% against the USD over the past 24 hours to create a fresh 2019 high at $337. Ethereum has dropped slightly as it now trades around $329, but it still marks a nice 29% increase over the past week alone.
Ethereum remains the second largest cryptocurrency with a market cap of around $36.9 billion. It has performed very well over the past 90 days, increasing by 150%.
Looking at the ETH/USD 1-Day Chart:
- Since our previous ETH/USD analysis, ETH finally managed to break above the resistance at the $315 level to reach higher resistance at $334 – provided by a 1.414 Fib Extension.
- From above: The nearest level of resistance is at $335. Above this, further resistance is located at $350 (bearish .618 Fib Retracement), $357, and $361. If the bulls continue above $360, higher resistance is found at $380 and $400. Resistance above $400 can be expected at $410 and $420 (bearish .786 Fib Retracement).
- From below: The nearest level of support is at $315. Beneath this, more support lies at $310, $300, and $298. If the selling continues beneath $298, support is located at $278, $271, $250, and $240.
- The trading volume has managed to remain consistently high during June 2019.
- The Stochastic RSI has remained in overbought conditions for a while now as we wait for a crossover below to show that the market is overstretched. However, the RSI itself still has some room to travel higher before becoming extremely overbought.
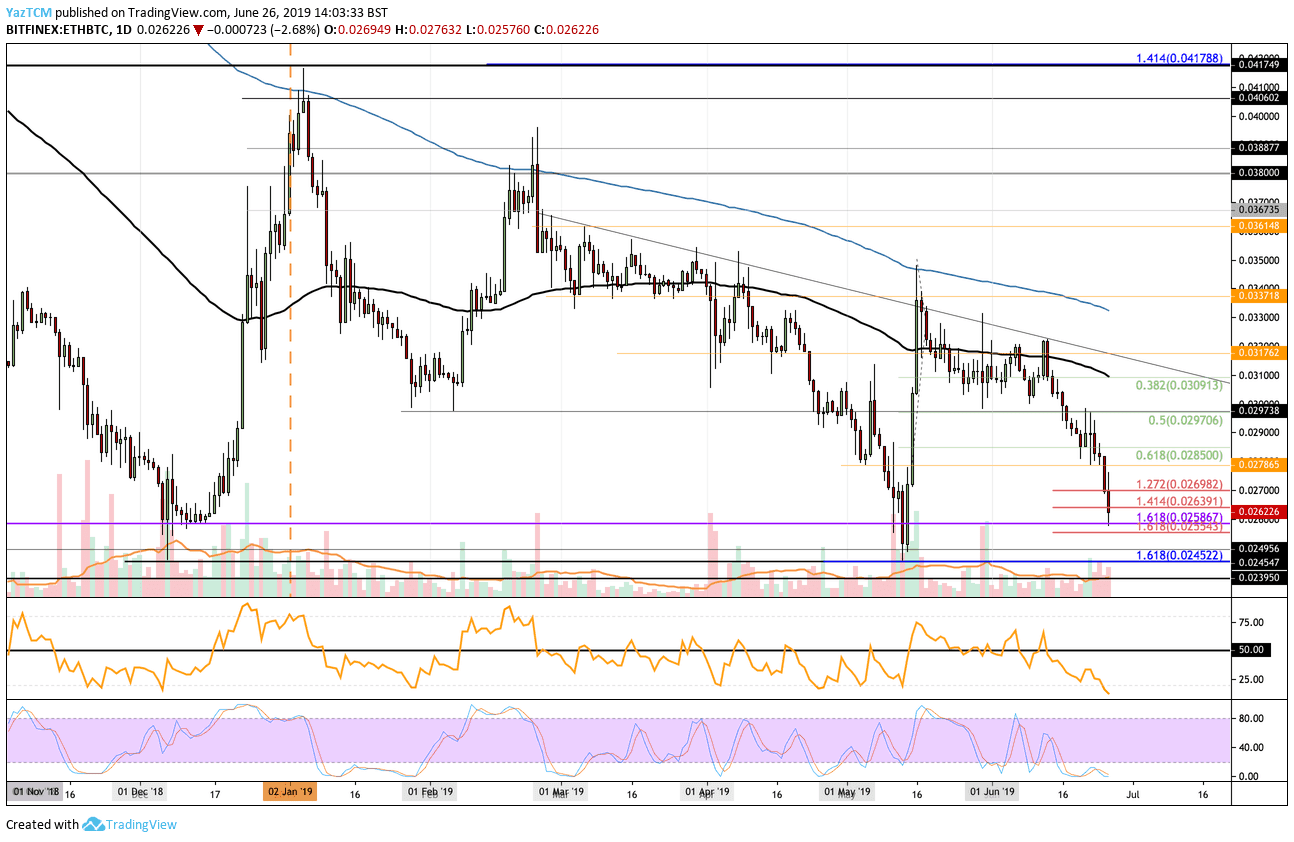
Looking at the ETH/BTC 1-Day Chart:
- Against Bitcoin, we can see that ETH has been struggling heavily. As Bitcoin continues to surge, people seemingly sell their ETH to take advantage of the Bitcoin rally. ETH has dropped beneath the expected support at 0.0285 BTC and has even decreased to as low as 0.02586 BTC which was December 2018’s low.
- From above: The nearest levels of resistance lies at 0.027 BTC, 0.0278 BTC, 0.0285 BTC, and 0.03 BTC (contains 100 days EMA). If the buying continues above 0.03 BTC, higher resistance is located at 0.0317 BTC and 0.033 BTC (contains 200 days EMA).
- From below: The nearest level of strong support is located at 0.02586 BTC, which has provided strong support during December 2018. Beneath this, lower support lies at 0.0255 BTC, 0.025 BTC, and 0.0245 BTC.
- The trading volume has increased above the average over the past few days of trading.
- The Stochastic RSI and the RSI itself have both reached extreme oversold conditions which indicates that we should see a reversal of this bearish trend soon, perhaps at the 2019 low support price.
The post Ethereum Price Analysis: ETH Records a Fresh 2019 High Over $337 appeared first on CryptoPotato.