Ethereum Price Analysis: ETH Rally Stalls, Can It Break Above $3,000?
Key Support levels: $2,500, $2,330
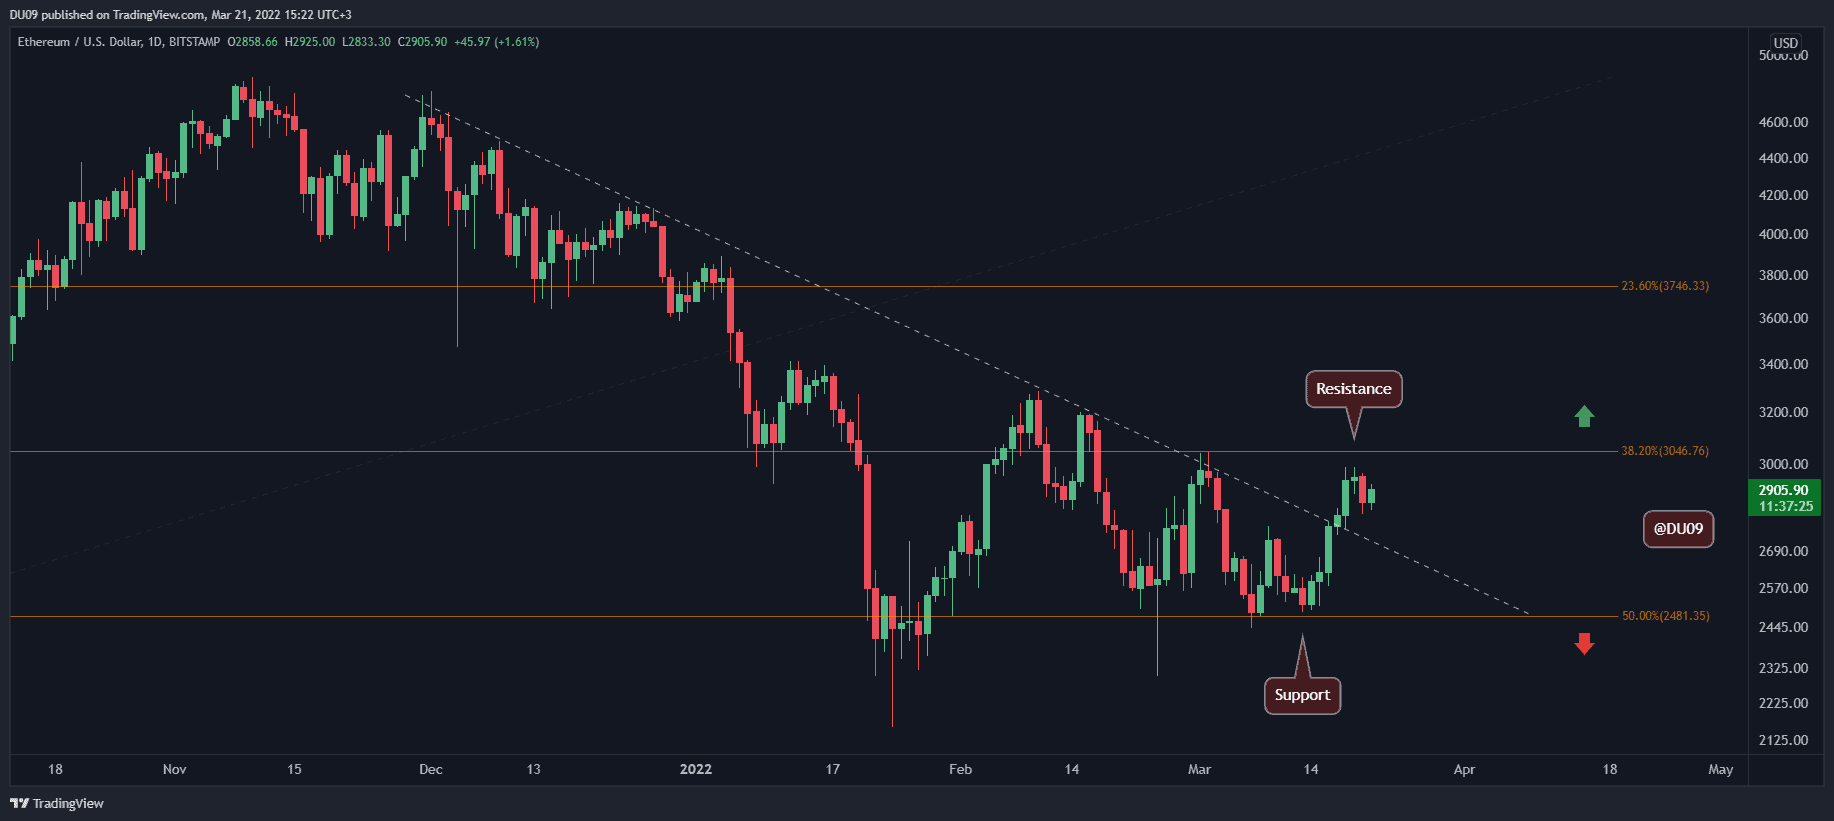
Key Resistance levels: $3,000, $3,400
ETH reached $2,987 (Bitstamp) on Friday and was unable to move higher as the key resistance at $3,000 has so far stopped buyers from advancing further. This puts ETH in a large price range between the key resistance and support at $2,500.
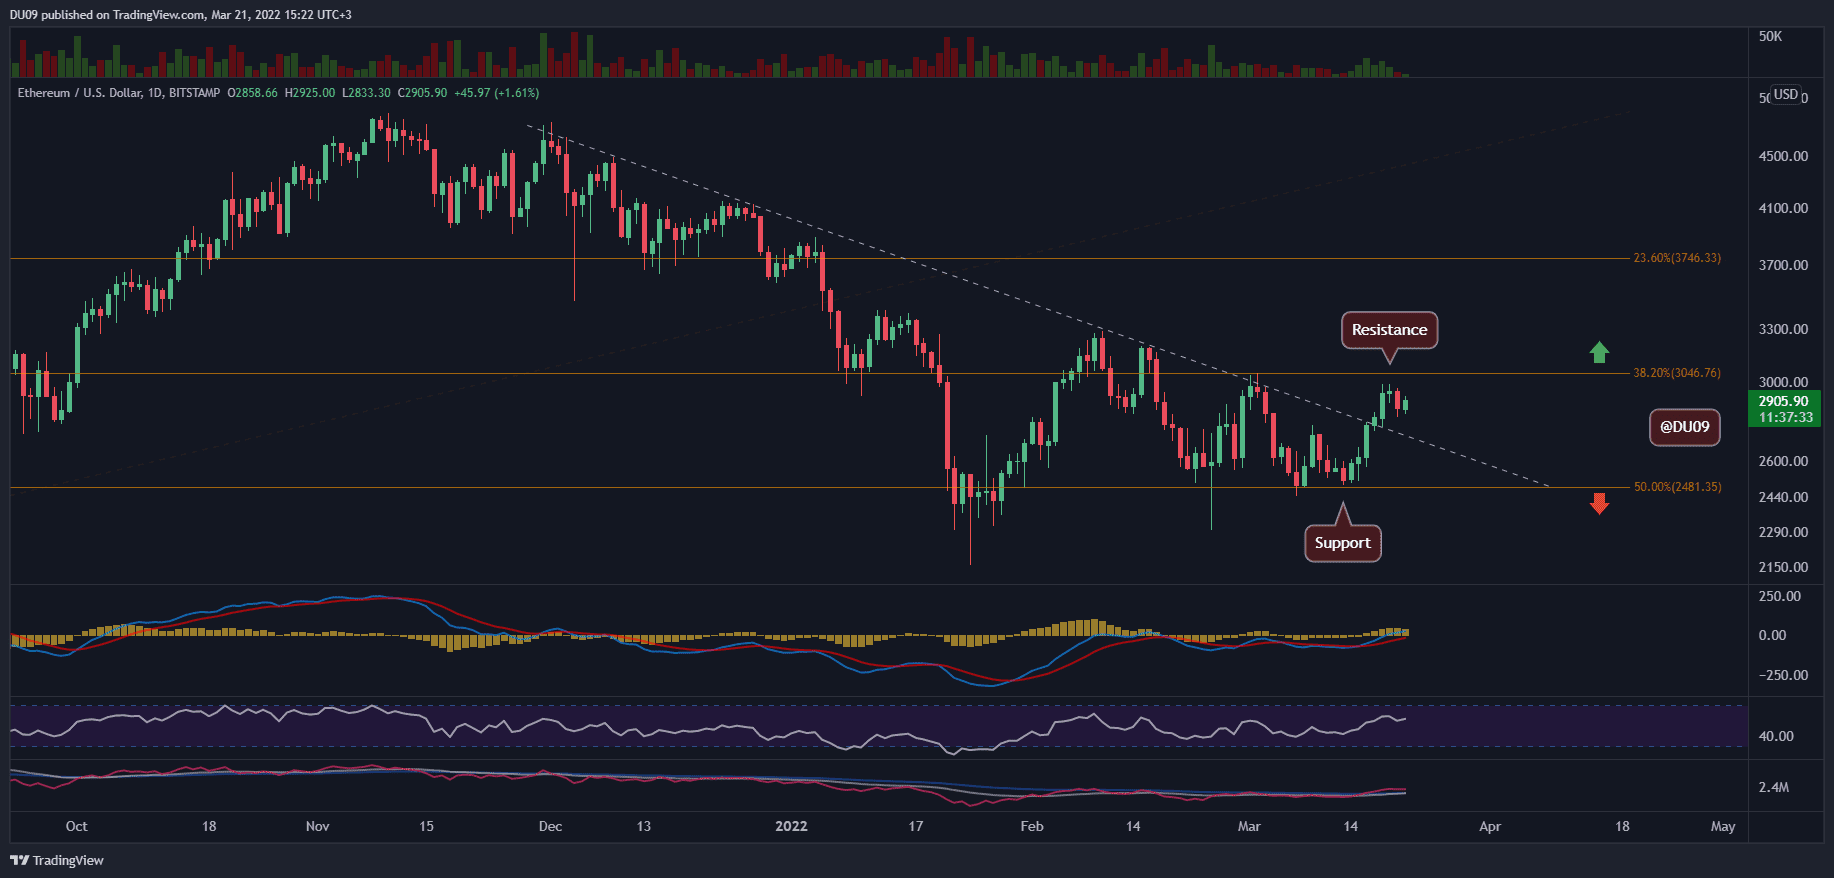
Technical Indicators
Trading Volume: The volume continues to decline on an aggregate basis and is making lower highs since the year started. This is a bearish signal.
RSI: The daily RSI has remained around the 50 points mid-area and appears unable to move away from this range.
MACD: The daily MACD is bullish, but in the past few weeks, the price action, as well as the MACD, remained rather flat. This is a lack-of-trend scenario that requires caution.
Bias
The bias for ETH is neutral. It has to break away from its current price range to change this.
Short-Term Price Prediction for ETH
ETH has so far failed to rally above $3,000 and turn this key resistance into support. For this reason, bears may still attempt another test of the support at $2,500. Looking at the current price action, the cryptocurrency lacks the momentum and conviction to move higher.