Ethereum Price Analysis: ETH Flirts With $2.5K But Bullish Prospects Remain Questionable
Ethereum’s price has been consolidating in a wide range above the $2,000 mark. Yet, things might change soon.
Technical Analysis
By Edris Derakhshi (TradingRage)
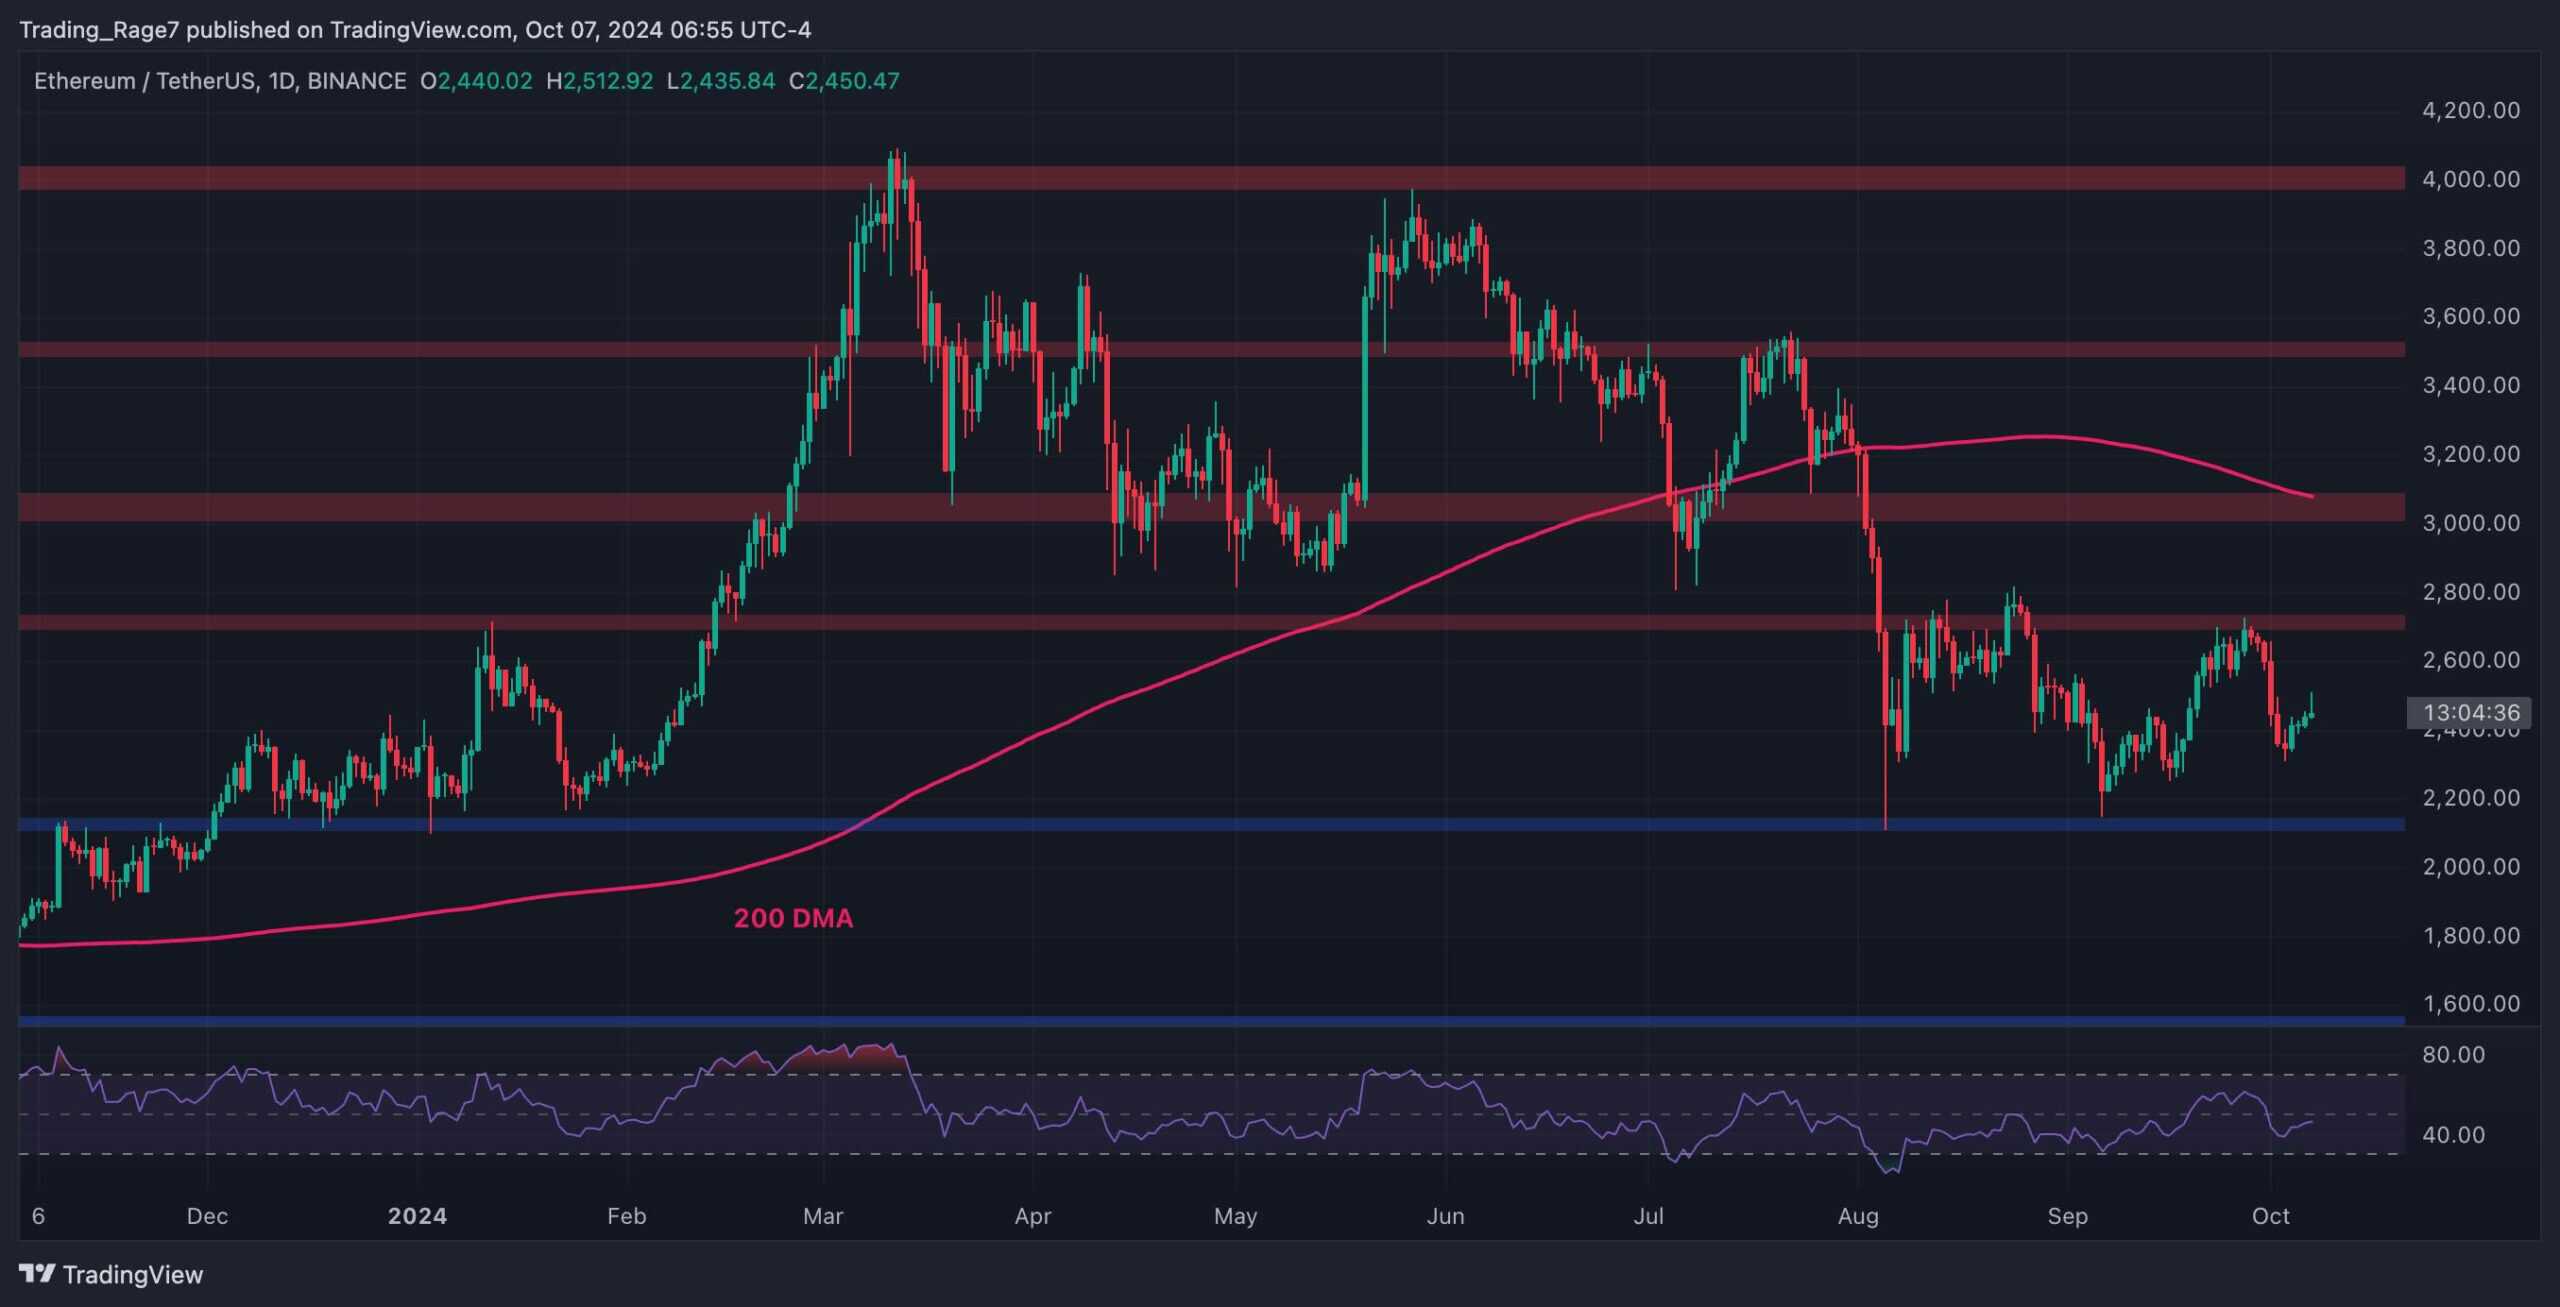
The Daily Chart
On the daily chart, the price has been moving sideways in a $500 range between the $2,700 resistance level and the $2,200 support zone.
With the market testing the upper boundary multiple times and failing to break above, $2,200 seems likely to be targeted in the upcoming weeks. On the other hand, the RSI is approaching the 50% level from below, which suggests that the bearish momentum is fading, which could also result in a reversal soon.
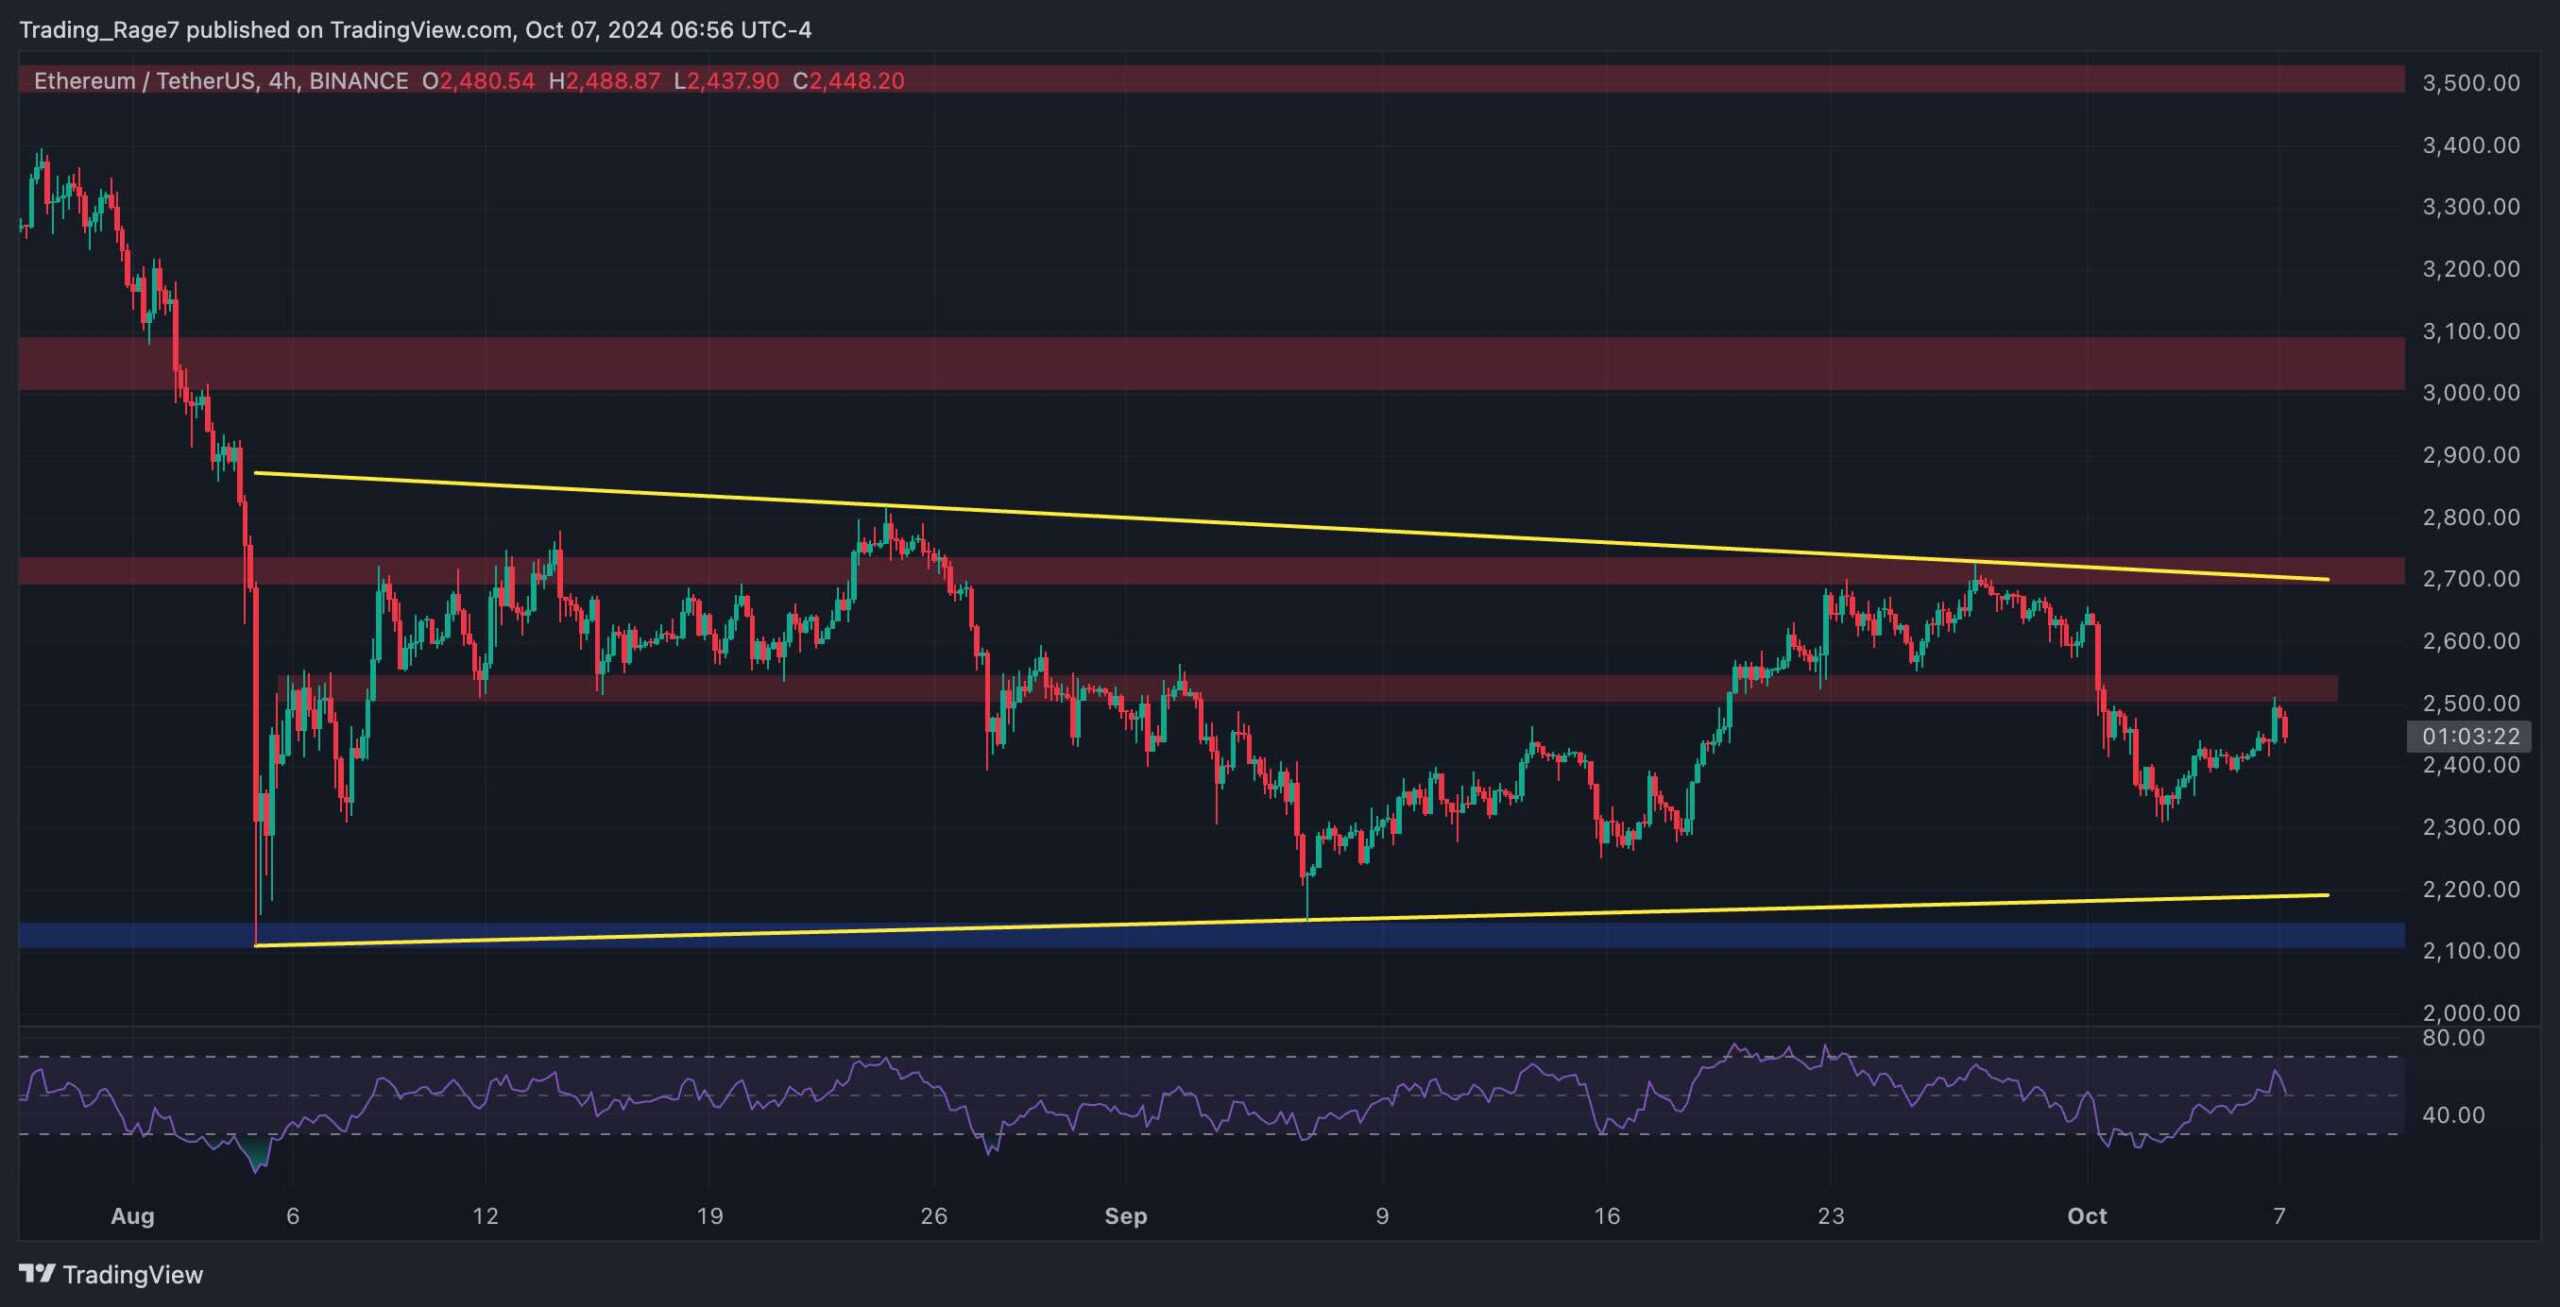
The 4-Hour Chart
The 4-hour chart paints a much more meaningful picture of the recent price consolidation. The market has been trapped in a large symmetrical triangle pattern, and each boundary has been tested twice.
Yet, with the $2,500 level being broken to the downside and retested from below, the market will likely test the lower trendline soon.
Sentiment Analysis
By Edris Derakhshi (TradingRage)
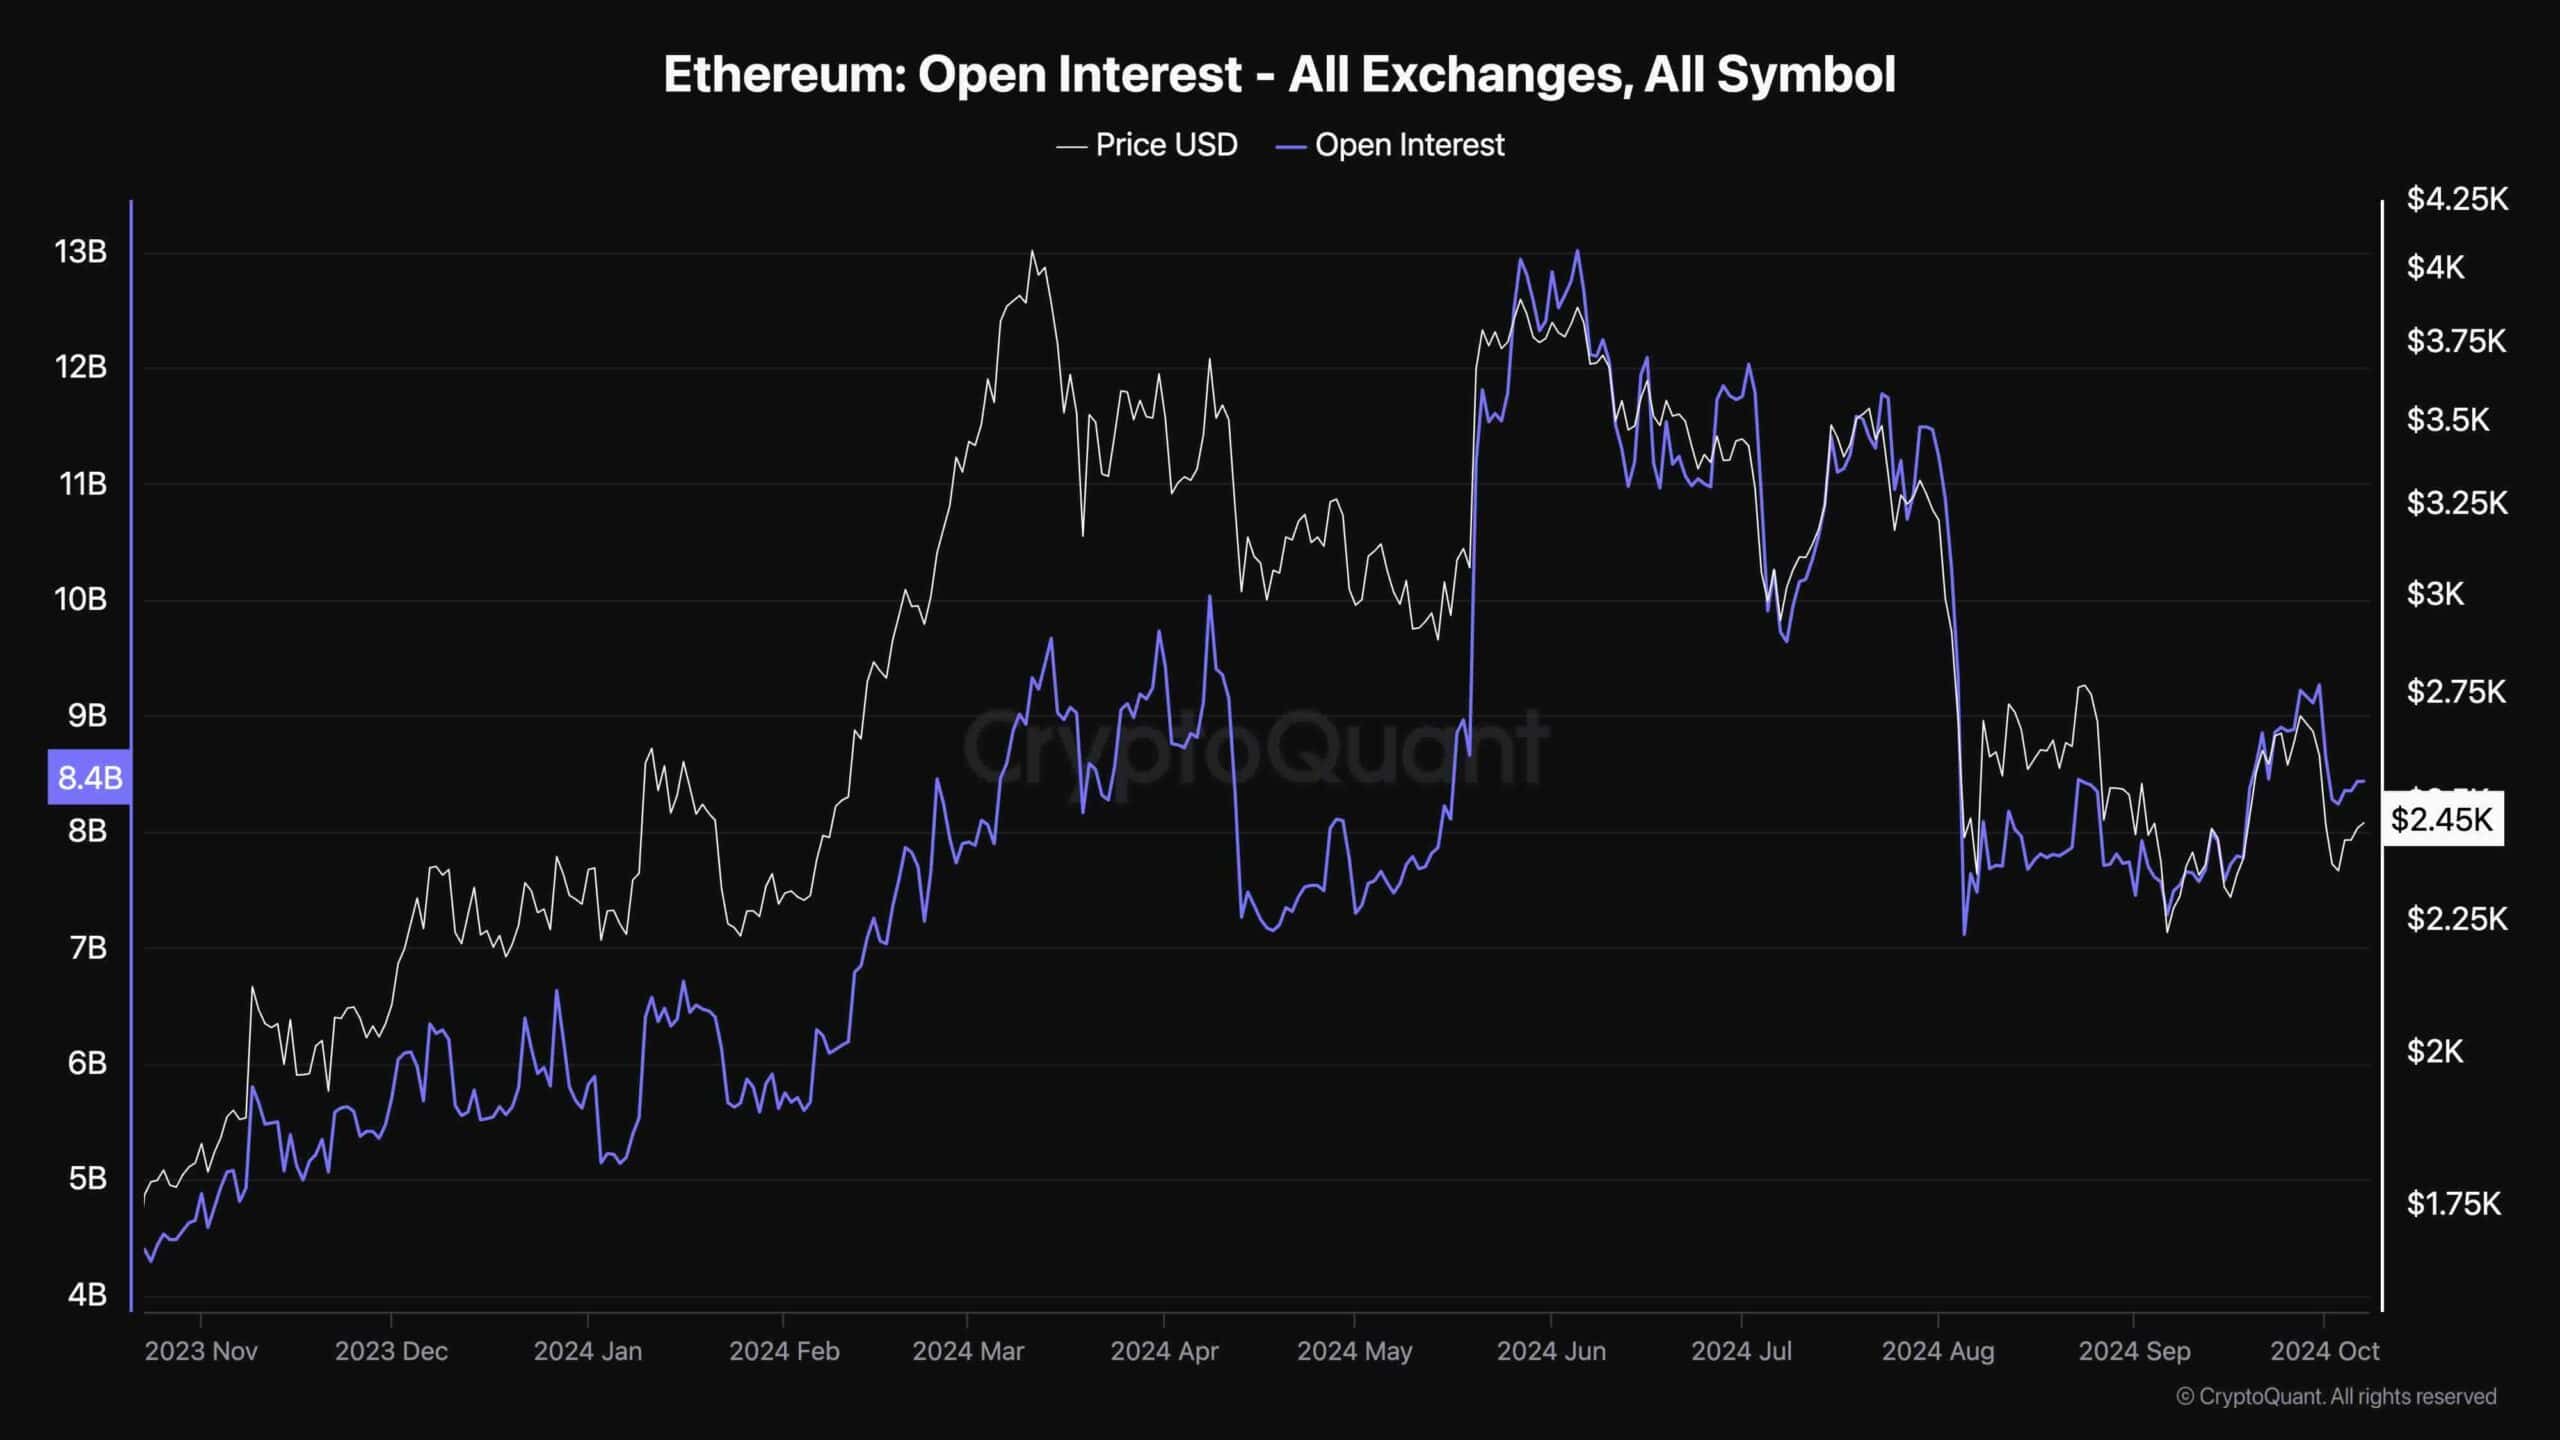
Ethereum Open Interest
This chart demonstrates the open interest (OI) metric, which shows the total number of outstanding futures contracts. It reflects the level of trader participation and market activity, with rising OI indicating increased interest and falling OI suggesting traders are closing their positions or getting liquidated.
The chart shows Ethereum’s OI and price moving closely in tandem, with a significant surge from late 2023 to early 2024, indicating high market engagement and bullish sentiment.
However, the sharp decline in mid-2024 suggests a major bearish event or liquidation, causing traders to exit their positions, leading to reduced market activity and a price drop.
Despite some fluctuations, both the OI and price remain lower than earlier peaks, reflecting a more cautious sentiment among traders. Yet, with such a cooldown in the futures market, sufficient spot demand can initiate a sustainable rally.
The post Ethereum Price Analysis: ETH Flirts With $2.5K But Bullish Prospects Remain Questionable appeared first on CryptoPotato.