Ethereum Price Analysis: ETH Finds Strong Support At $240, Will It Be Enough To Hold Up?
Ethereum may have seen a steep price fall over the past seven days, following Bitcoin, totaling -10% to bring the current price for the coin down to around $241, but the cryptocurrency is still up by an impressive 38% over the past 30 days. Furthermore, Ethreum is still up by an extraordinary 75% over the past three months.
Ethereum sits in 2nd place on the market cap rankings as it currently holds a $25.9 billion market cap value.
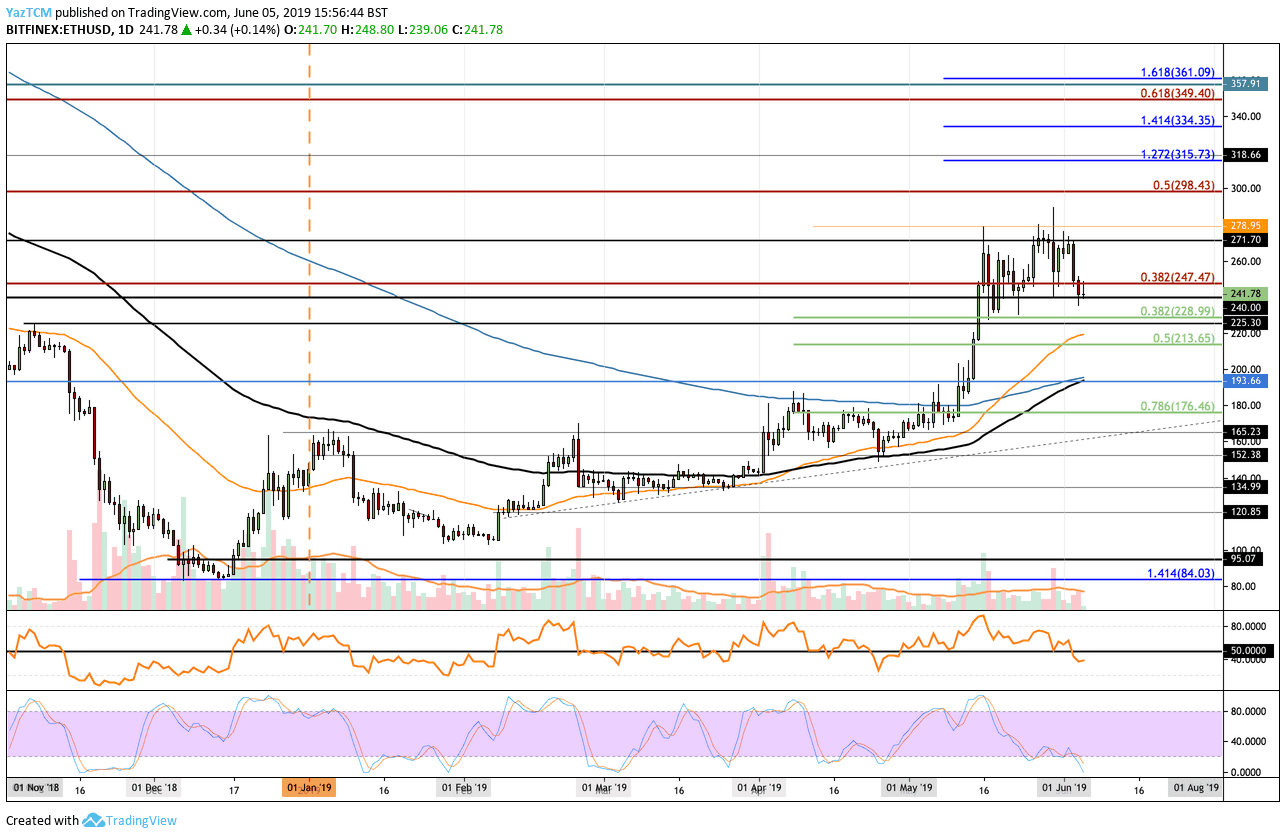
Looking at the ETH/USD 1-Day Chart:
- Since our previous ETH/USD analysis, we can see that Ethereum has continued to fall into the previously highlighted support at the $240 level. The coin has managed to hold at this support surprisingly well.
- From above: The nearest level of resistance now lies between $247 – $250. Above this, further resistance is expected at $271, $278 and $298. If the buyers can continue to break above $300, higher resistance lies at $315, $334 and $350.
- From below: The nearest level of support now lies at the current $240 level. Beneath this, further support lies at $228, $213 and $200. If Ethereum drops below $200, additional support lies at $193 and $176.
- The trading volume remains below the average level for the past two months.
- The RSI has recently slipped beneath the 50 levels to indicate that the sellers are in control of the momentum. However, the Stochastic RSI is in oversold territory as we wait for a bullish crossover to signal a bullish move higher.
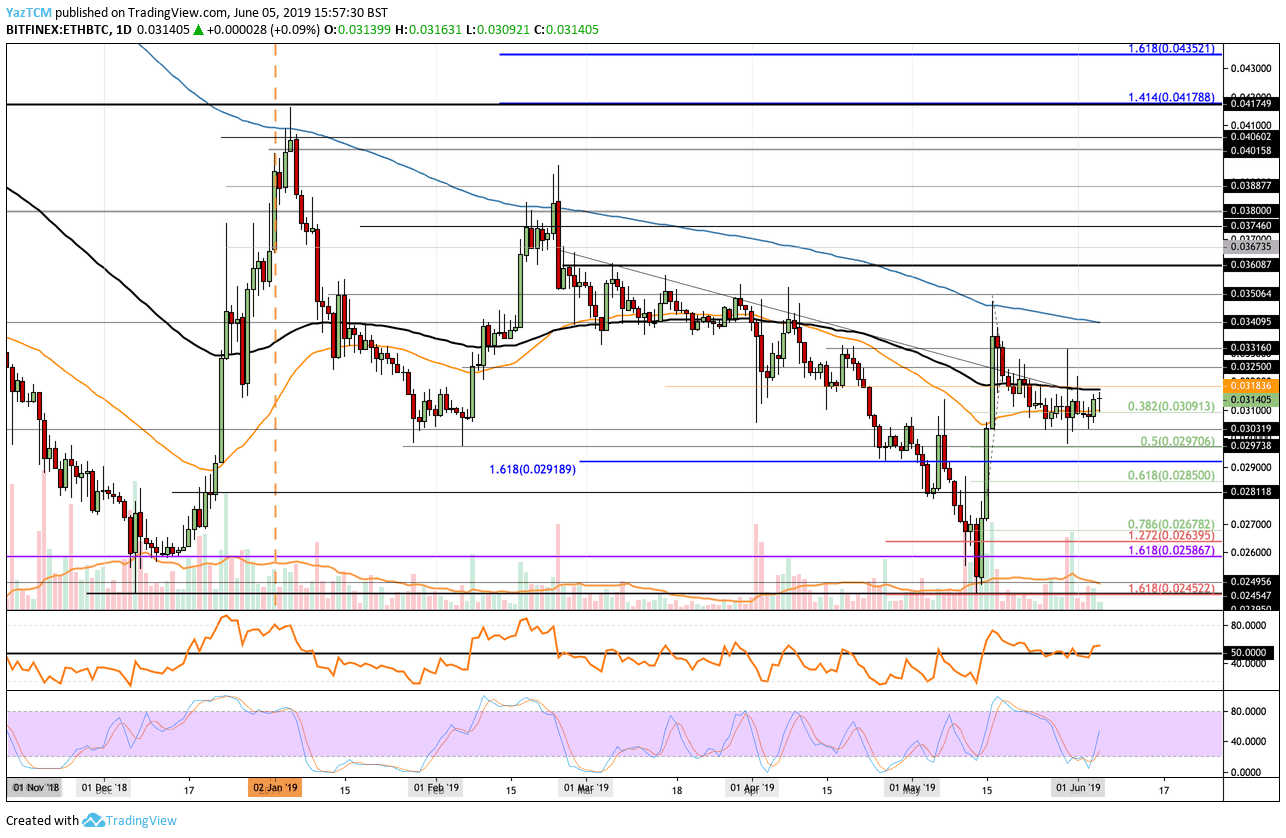
Looking at the ETH/BTC 1-Day Chart:
- Against Bitcoin, Ethereum has managed to hold above the 0.03 BTC support level during the recent price decline. Ethereum has since rebounded and currently trades at resistance at 0.03140 BTC around the 100 days EMA.
- From above; The nearest level of resistance now lies at 0.03185 BTC. Above this, higher resistance lies at 0.0325 BTC, 0.03316 BTC and 0.034 BTC (which contains the 200 days EMA). Above this, further resistance lies at 0.035 BTC, 0.036 BTC, and 0.03740 BTC.
- From below; The nearest level of strong support lies at 0.030 BTC. Beneath this, further support lies at 0.02970 BTC, 0.02919 BTC, and 0.0285 BTC.
- The Stochastic RSI has recently signaled a bullish crossover which has seen price action rebound slightly. If the RSI can continue to rise higher from the 50 levels, we can expect ETH/BTC to climb further higher.
The post Ethereum Price Analysis: ETH Finds Strong Support At $240, Will It Be Enough To Hold Up? appeared first on CryptoPotato.