Ethereum Price Analysis: ETH Fights For $380 Before Further Downside Action
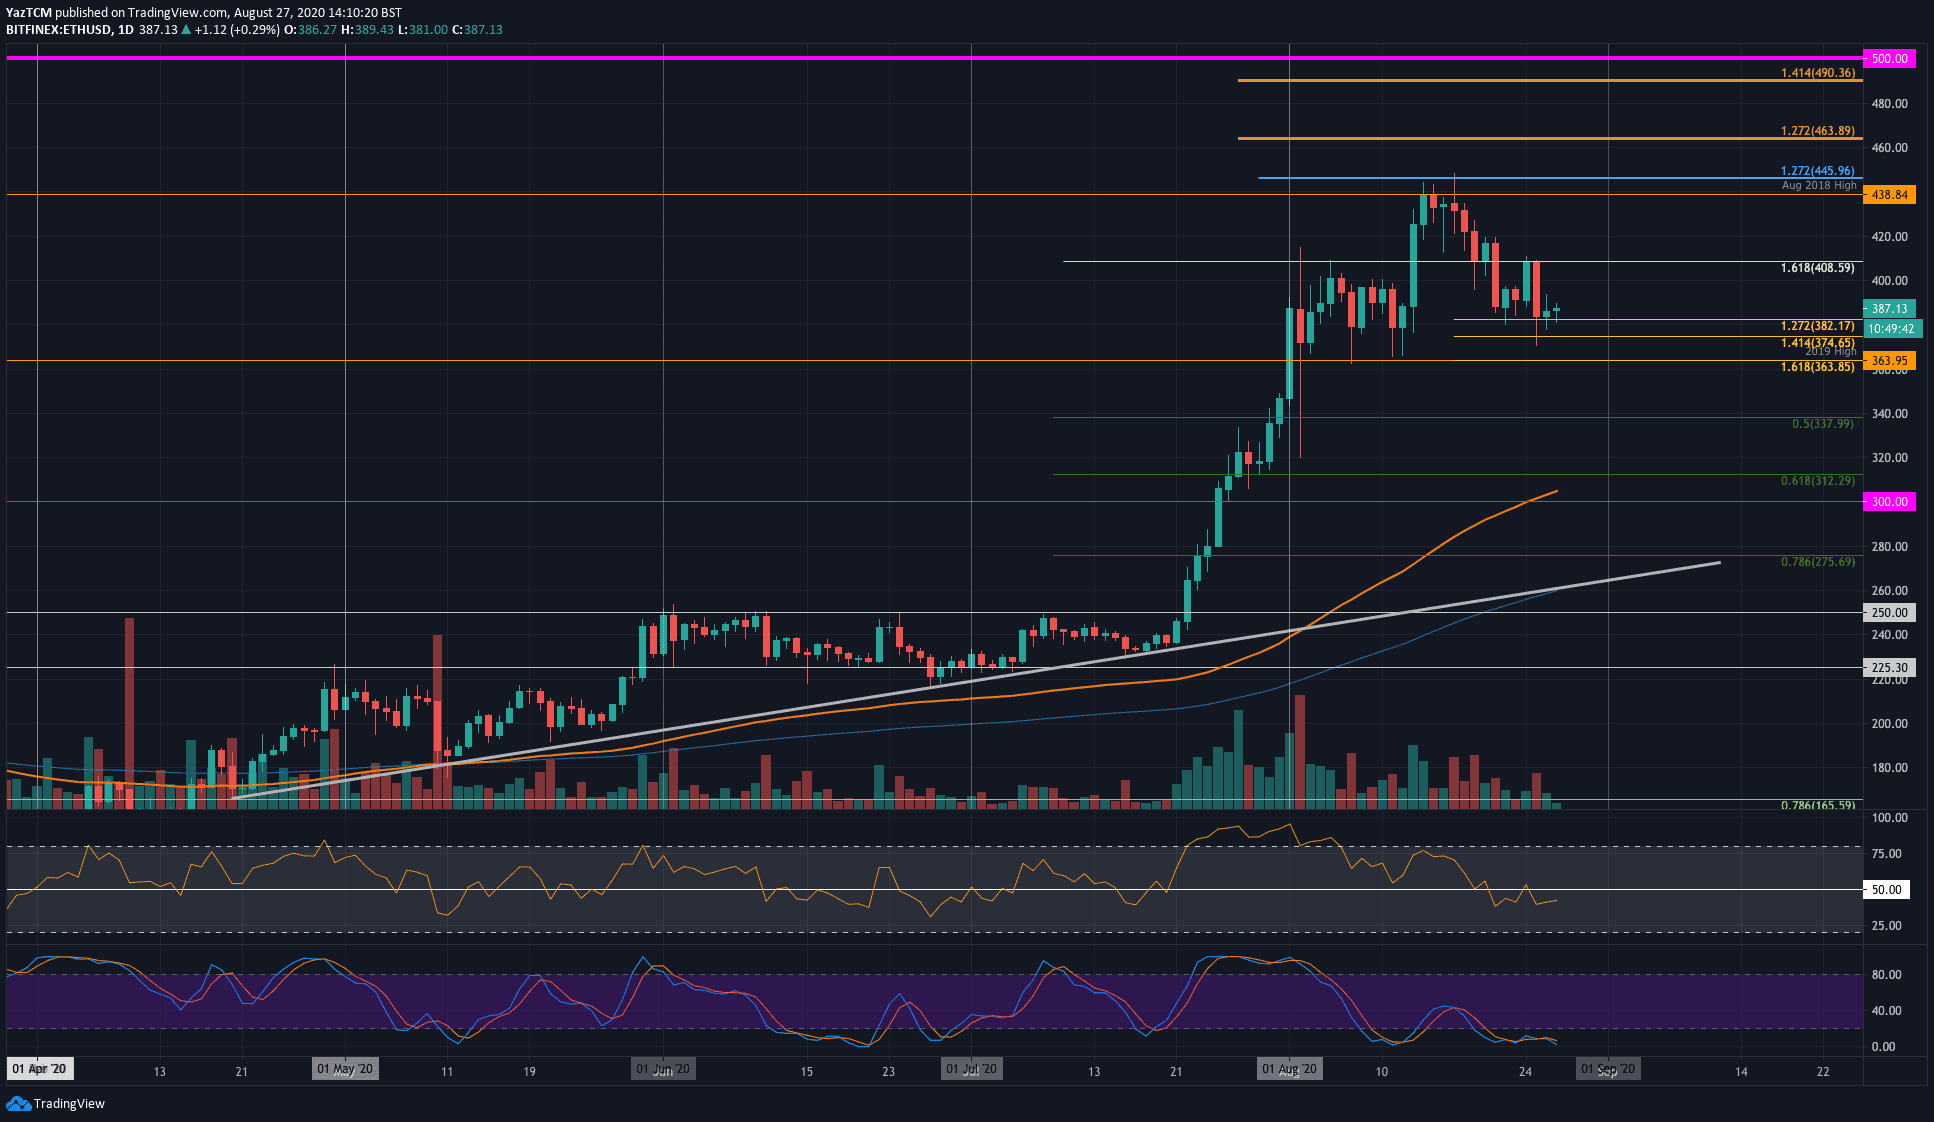
Ethereum had dropped 5% on the weekly. However, there is strong support built upon the $380 area. The last time ETH daily closed below $380 was 2.5 weeks ago.
Overall in August, ETH is mainly trading in the range between $380 – $400 and must break this range to dictate the next direction for the market. Earlier today, ETH saw a pump and dump towards $400 around the Fed’s statement regarding the inflation.
Key Support Levels: $382, $375, $364
Key Resistance Levels: $400, $408, $438
ETH-USD Short Term Price Prediction
Looking on the following daily chart, there is strong support for ETH at the downside 1.272 Fib Extension at the $380 – $382 range. If the sellers break below, the next support lies at $375 (downside 1.414 Fib Extension), $370 (this week’s low), $364 (2019 High), and $340 (.5 Fib Retracement).
On the other side, the first major resistance lies at $400 (today’s high), $408, $438, and the 2020 high at $448.50.
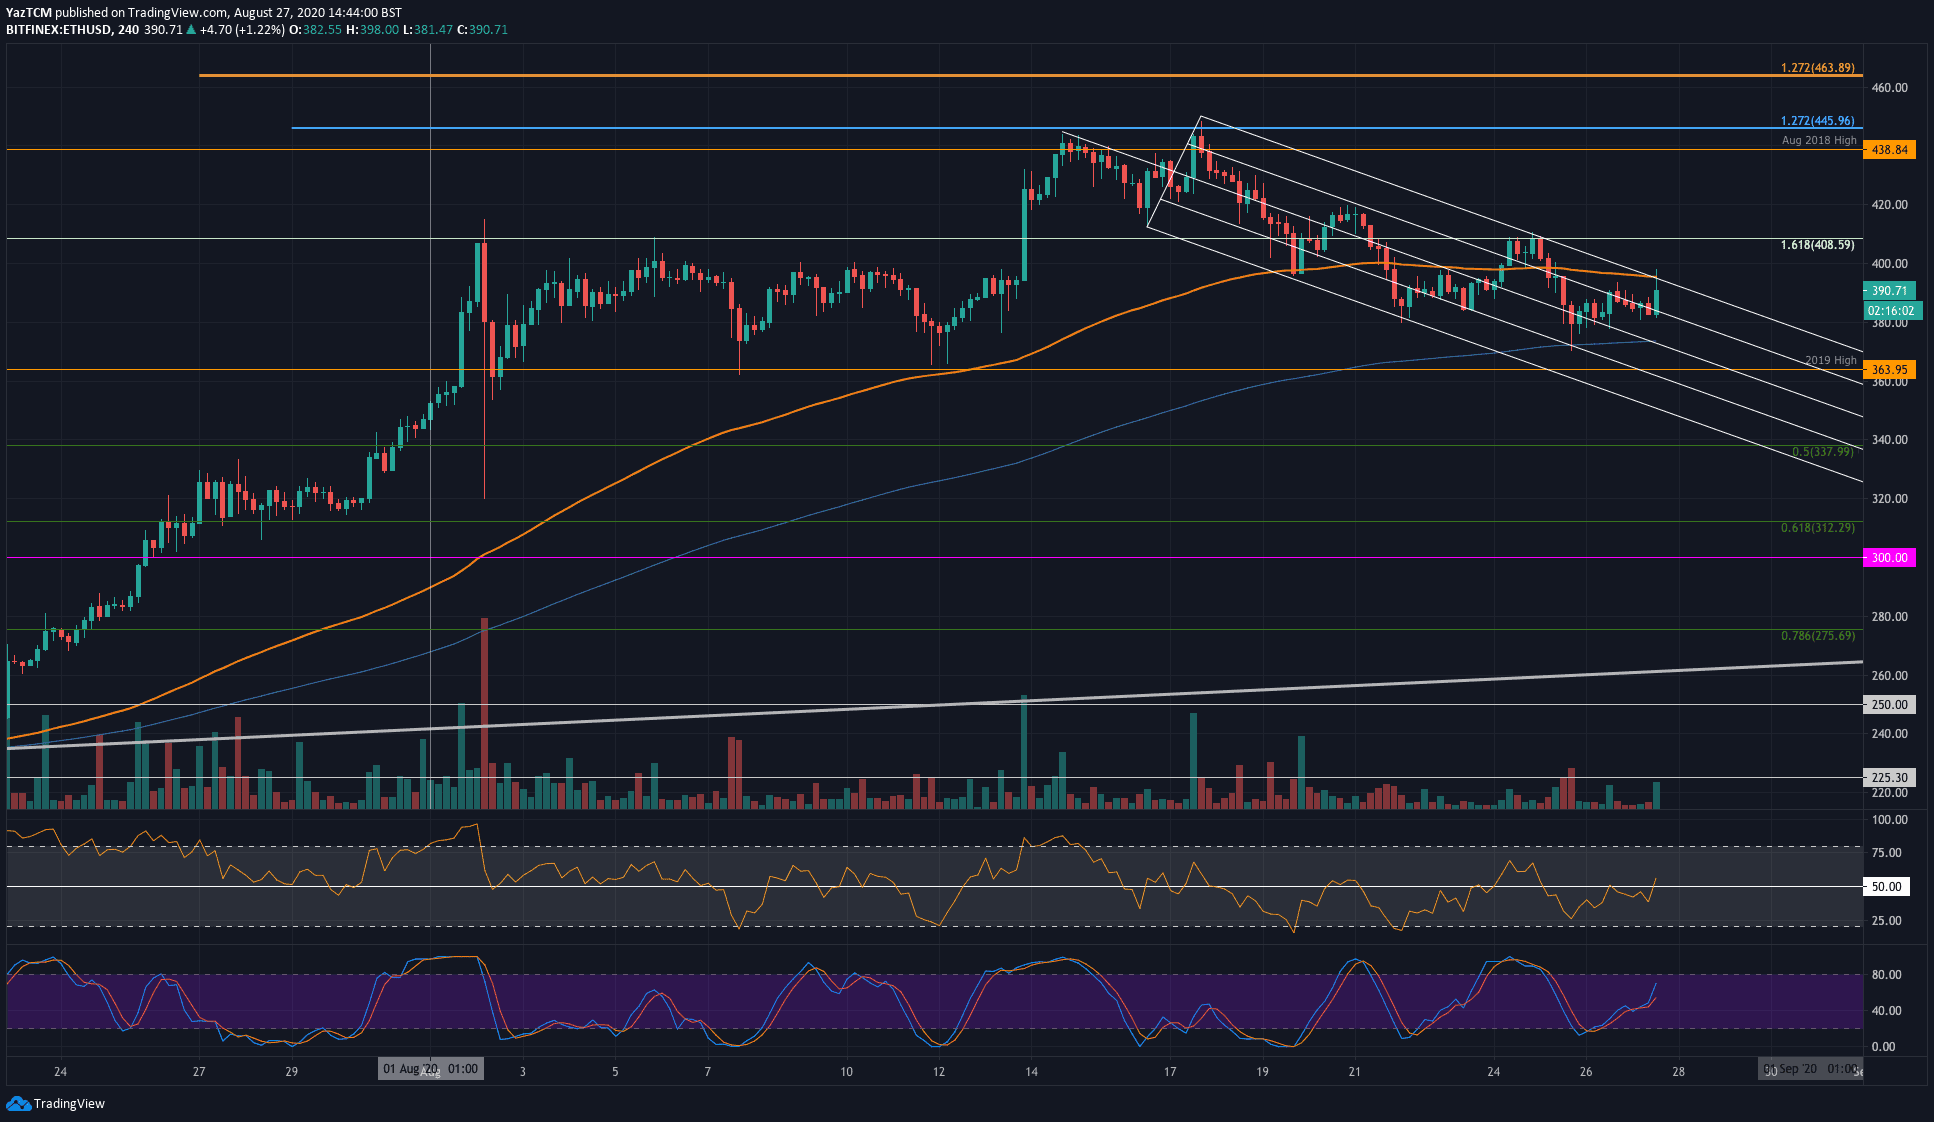
Looking at the 4HR chart, Etheruem remains trapped within a descending pitchfork. Support lies at the pitchfork’s lower boundary, and the coin pushed higher today to re-test its upper border. Before reaching $400, Ethereum must break this pitchfork formation, or it will remain trapped within a falling pattern.
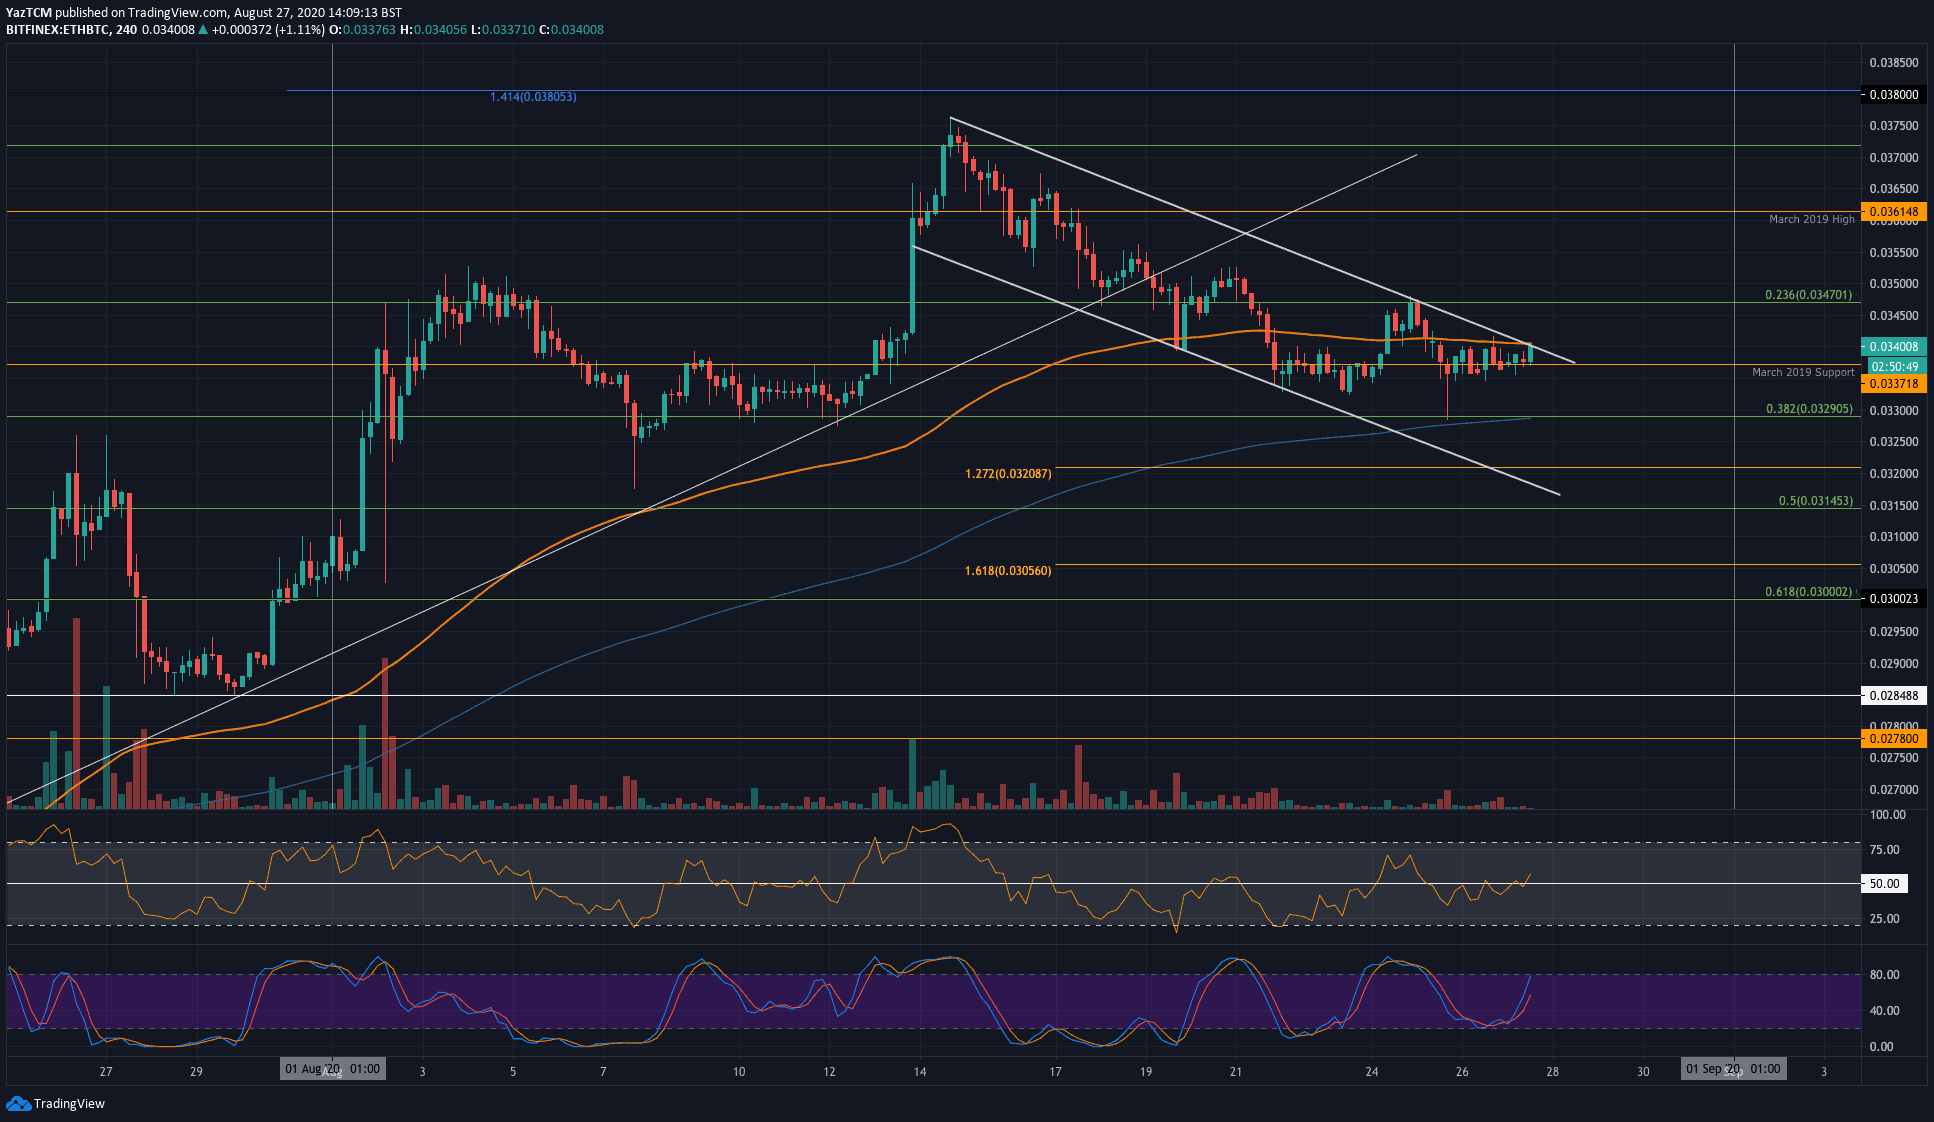
ETH/BTC – Another Attempt To Break A Descending Channel
Key Support Levels: 0.0337 BTC, 0.0329 BTC, 0.032 BTC.
Key Resistance Levels: 0.0347 BTC, 0.0361 BTC, 0.0371 BTC.
Against Bitcoin, Ethereum remains bound within the highlighted falling channel. The bulls have defended the support at 0.0337 BTC (March 2019 low) for the past week and are now attempting to push above this channel’s upper boundary.
A break above the channel might initiate a new bull run for Ethereum, along with breaking above the $400 resistance.
ETH-BTC Short Term Price Prediction
If the bulls can penetrate the upper boundary, the next resistance lies at 0.0347 BTC. Following this, resistance lies at 0.0361 BTC (March 2019 Highs) and then 0.0371 BTC (1.618 Fib Extension).
On the other side, the first level of support lies at 0.0337 BTC (March 2019 support). Below, further support is located at 0.0329 BTC (.382 Fib Retracement), 0.032 BTC, and 0.0314 BTC (.5 Fib Retracement).
The post Ethereum Price Analysis: ETH Fights For $380 Before Further Downside Action appeared first on CryptoPotato.