Ethereum Price Analysis: ETH Fighting Over $2000 After Crashing 55% In 11 Days
ETH/USD: Is Ethereum Losing The $2K Mark?
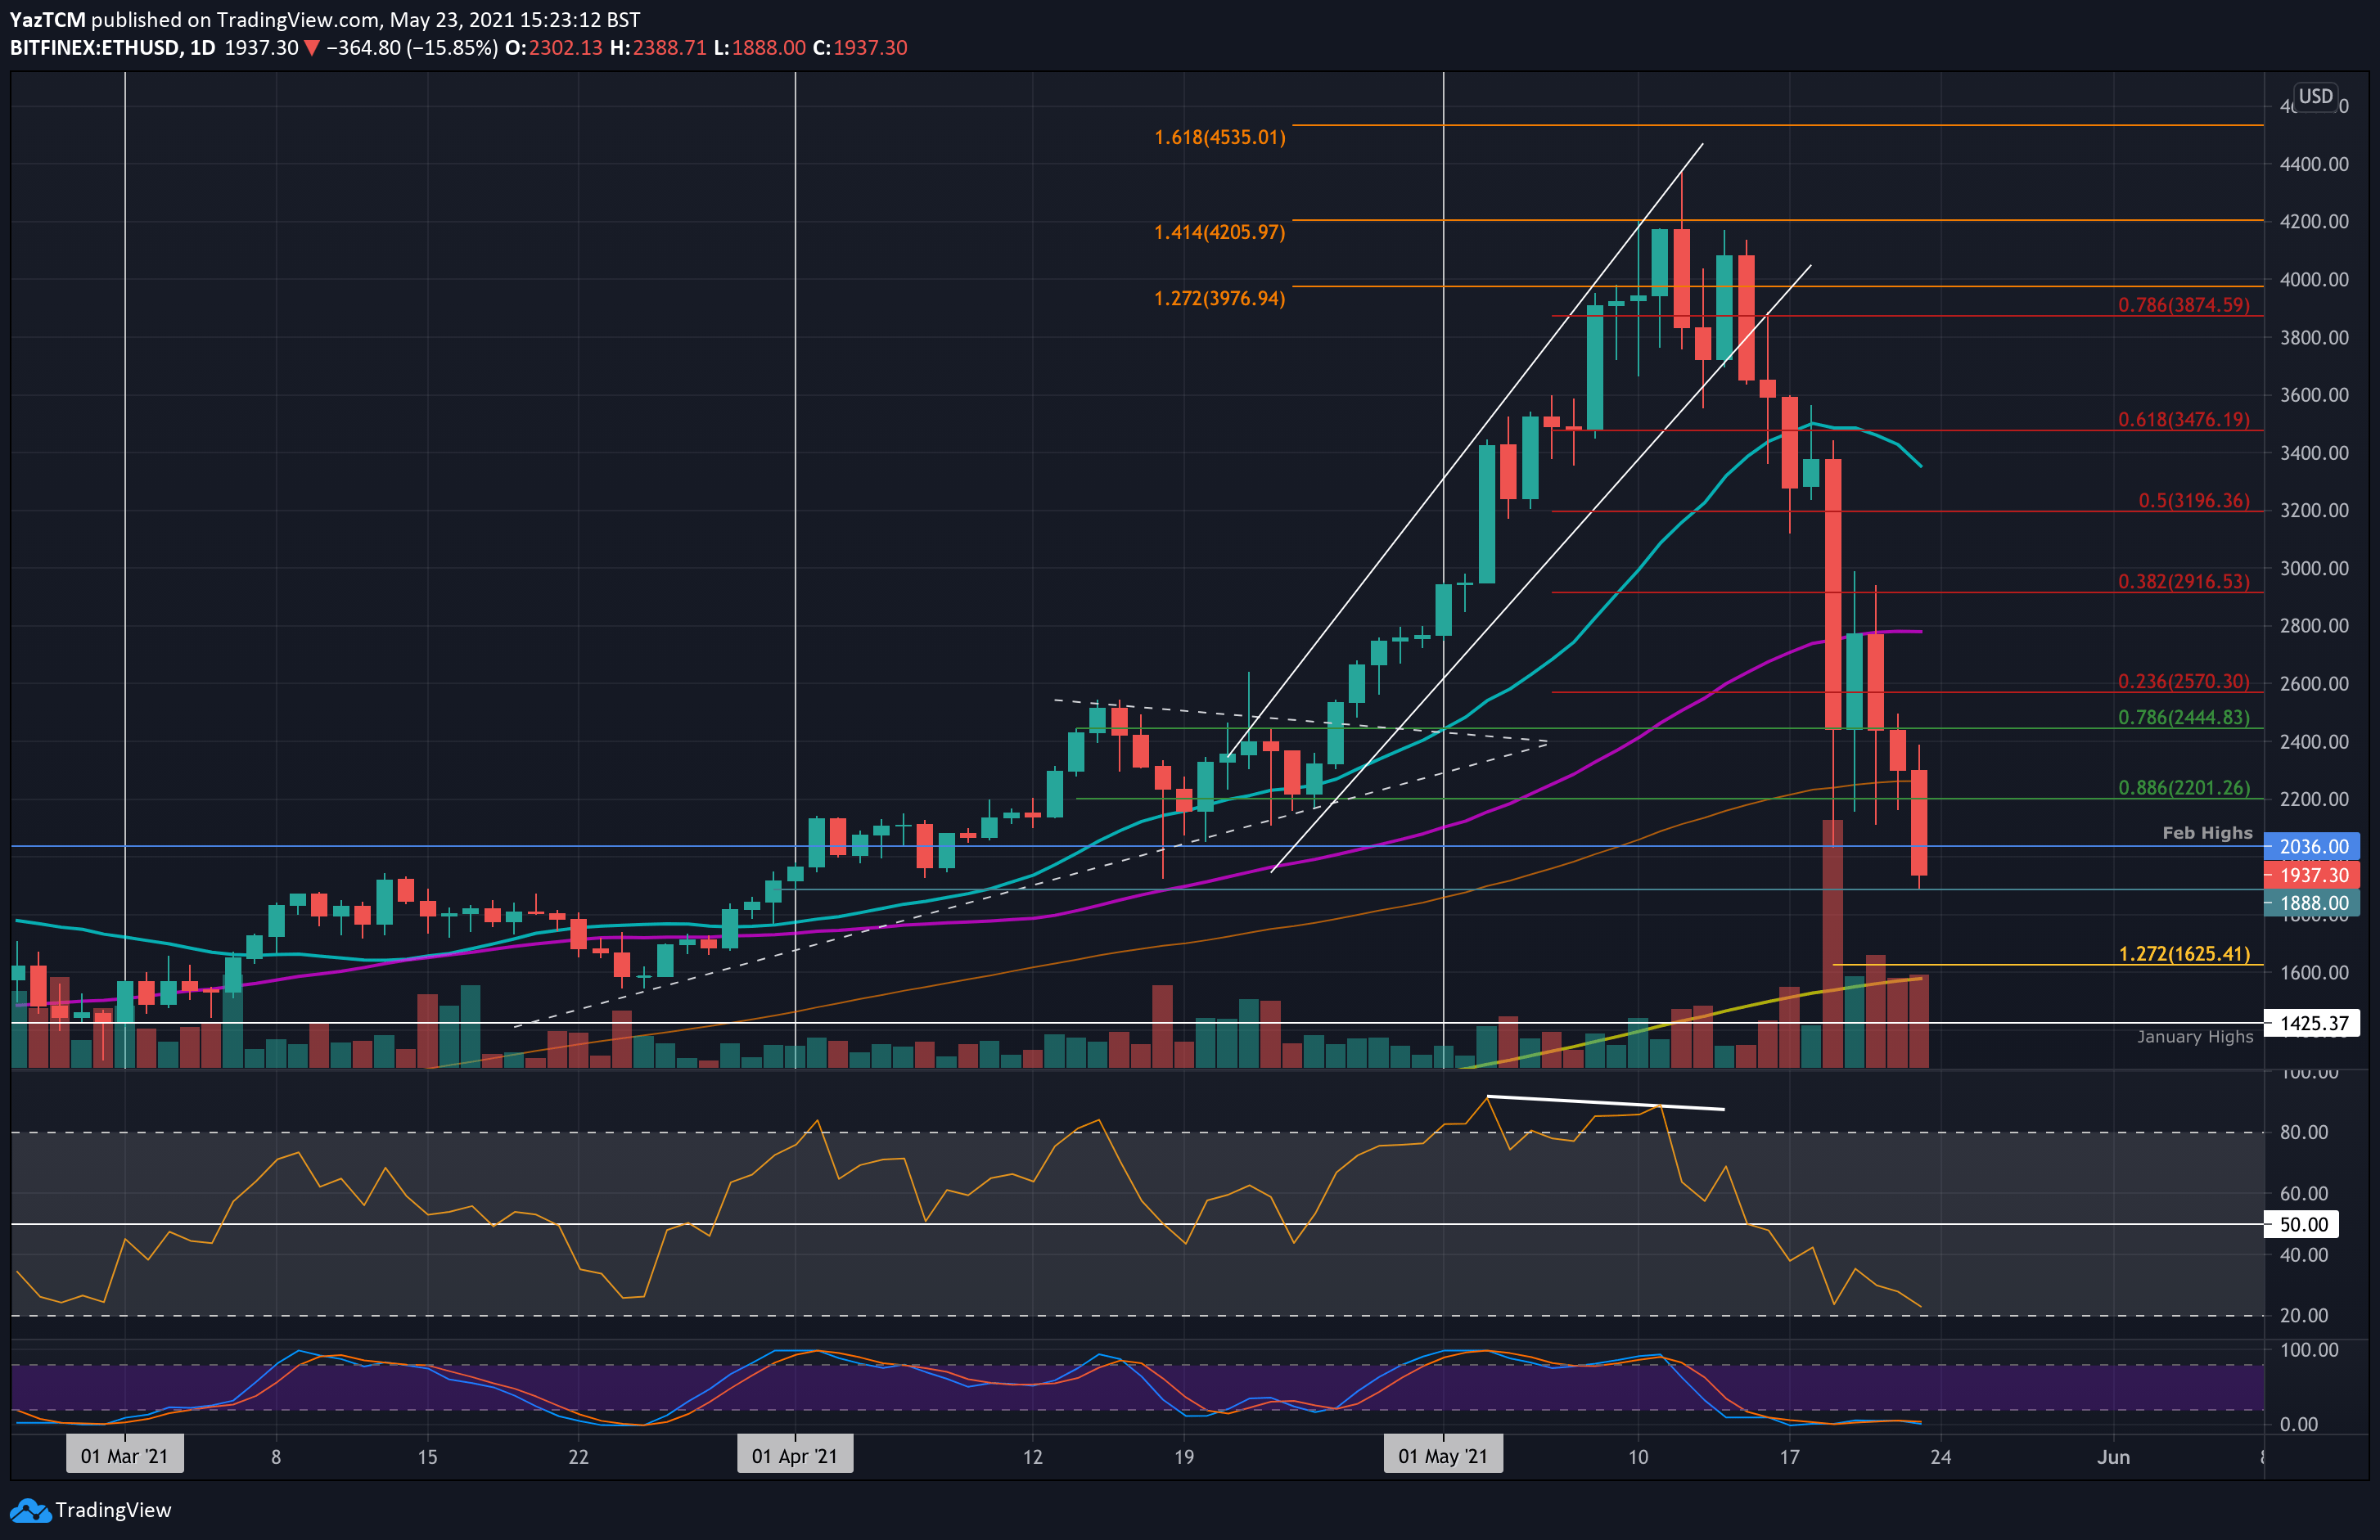
Key Support Levels: $1,888, $1,800, $1,625.
Key Resistance Levels: $2,000, $2,275, $2,400, $2,800.
ETH is down by a steep 55% over the past eleven days, the day ETH saw its all-time high around $4,400, as the coin dropped beneath $2,000 earlier today. The cryptocurrency suffered a steep decline on Wednesday during the cryptocurrency market crash as it dropped from over $3,400 to reach as low as $2,036, according to Bitstamp.
Despite the huge slide, ETH was able to rebound heavily from $2,036 by the end of the day to close Wednesday’s daily candle at $2,444 (.786 Fib) and continued even higher hours later for a retest of the 50-day moving average line (MA) – just beneath $2,800.
Following the failure of holding the latter, ETH plunged beneath the same $2,400 yesterday and continued beneath the 100-day MA and $2,000 to a current day-low at $1,888 (April opening price).

ETH-USD Short Term Price Prediction
Looking ahead, the first major support lies at $1,888 (April opening price and today’s current low). This is followed by $1,800. Breaking below and the way to $1,625 (downside 1.272 Fib Extension & 200-day MA) should be quick. Further down lies the previous January 2018 all-time high at around $1,425, which is also January 2021 highs.
On the other side, the first resistance now lies at $2,000, which is being tested now as resistance. This is followed by the 100-day MA (currently around $2,275), $2,400, $2,570 (bearish .236 Fib), and $2,800 (50-day MA).
The RSI is in the bearish favor as it drops to near oversold conditions. There is still room to continue before it becomes extremely oversold, indicating there might be some more pain before any potential recovery. However, just like Bitcoin, if and when the bounce comes – there is a lot of bullish room on the upside.
ETH/BTC: Bears Break Beneath 0.06 BTC Support
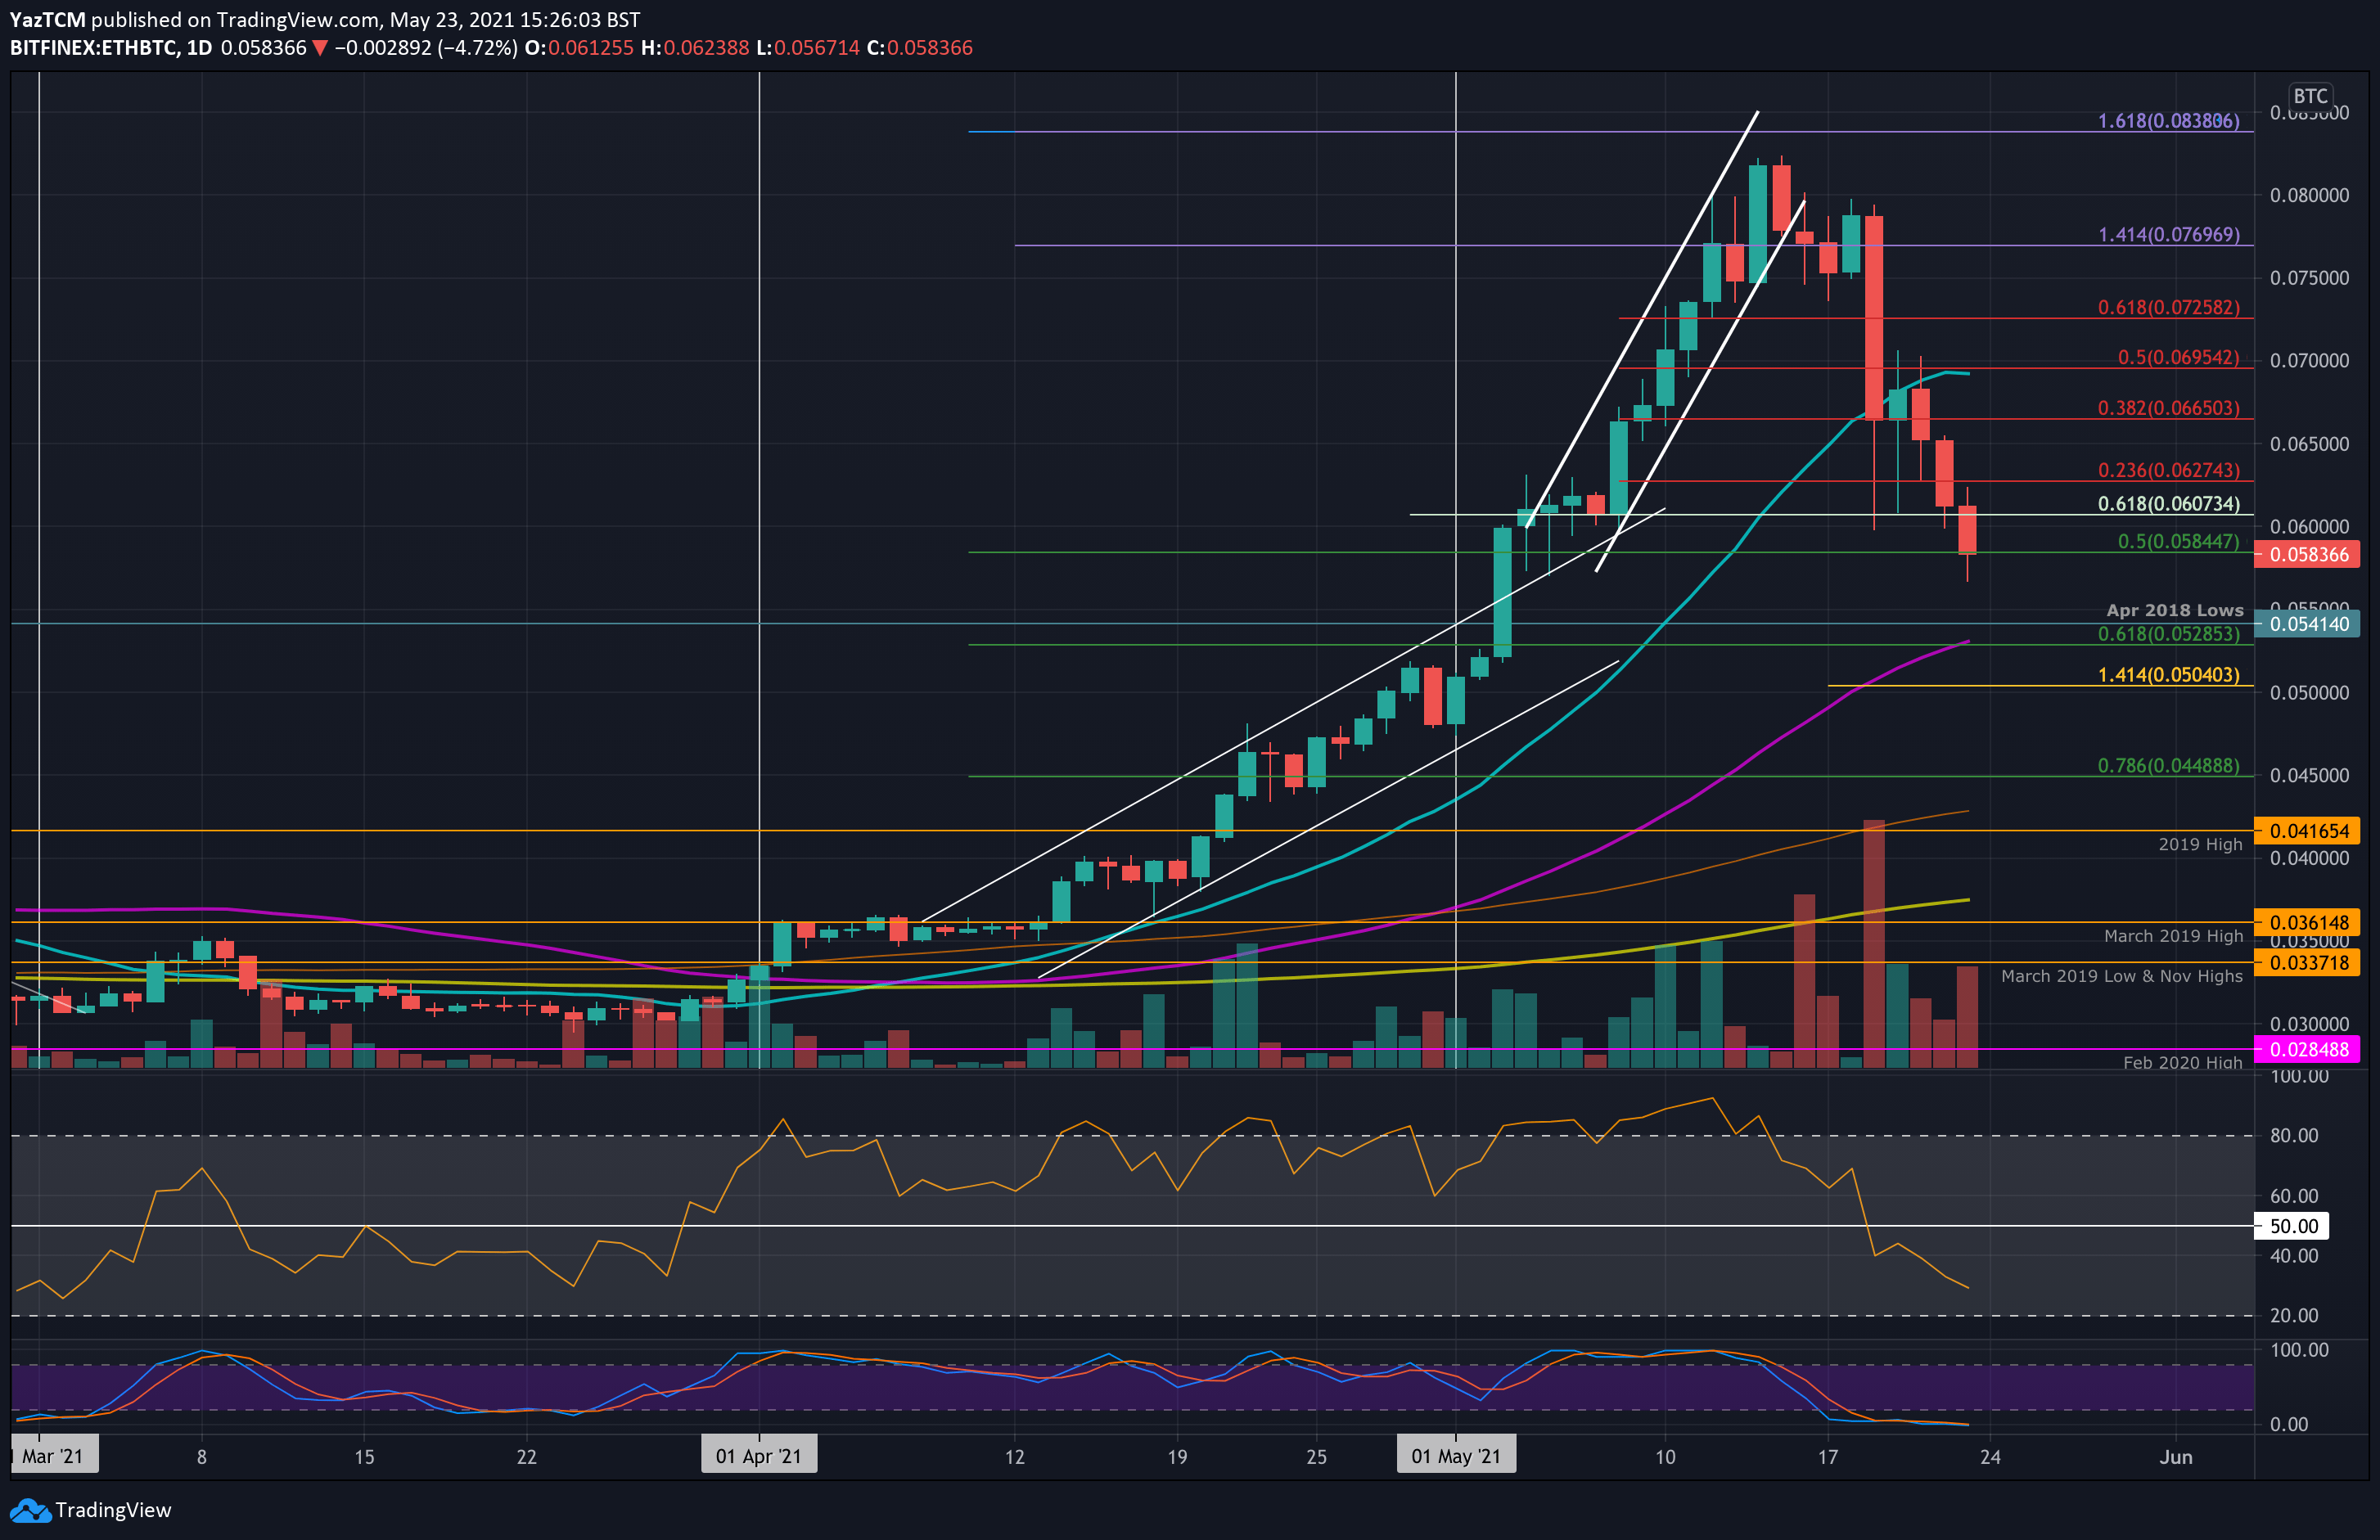
Key Support Levels: 0.0585 BTC, 0.0541 BTC, 0.0528 BTC.
Key Resistance Levels: 0.06 BTC, 0.0641 BTC, 0.0676 BTC.
ETH/BTC found support at 0.0607 BTC (.618 Fib) during the Wednesday price crash. The bulls managed to close the daily candle above 0.067 BTC but could not hold this support and fell to 0.065 BTC on Friday.
ETH fell beneath 0.065 BTC during this weekend and continued below 0.06 BTC today, while the Bitcoin dominance ratio keeps on growing.
Earlier today, ETH spiked as low as 0.0567 BTC and is currently trading at support around the 0.0585 BTC mark, provided by a longer-term .5 Fib Retracement.

ETH-BTC Short Term Price Prediction
Looking ahead, if the bears break below 0.0585 BTC (.5 Fib), the first support lies at 0.0541 BTC (Apr 2019 lows). This is followed by 0.0528 BTC (.618 Fib & 50-day MA), 0.05 BTC, and 0.0448 BTC (.786 Fib).
On the other hand, the first resistance now lies at 0.06 BTC. This is followed by 0.0641 BTC (bearish .236 Fib), 0.0676 BTC (bearish .382 Fib), and 0.0704 BTC (bearish .5 Fib).
Likewise, the RSI is in at the bearish territory but still has room to push further lower before sellers become exhausted. This indicates that ETH/BTC might still drop further before any potential recovery begins.


