Ethereum Price Analysis: ETH Eyes This Level Before Attempting Another Shot at $3K
ETH/USD – Ether Breaks Above Short Term Triangle
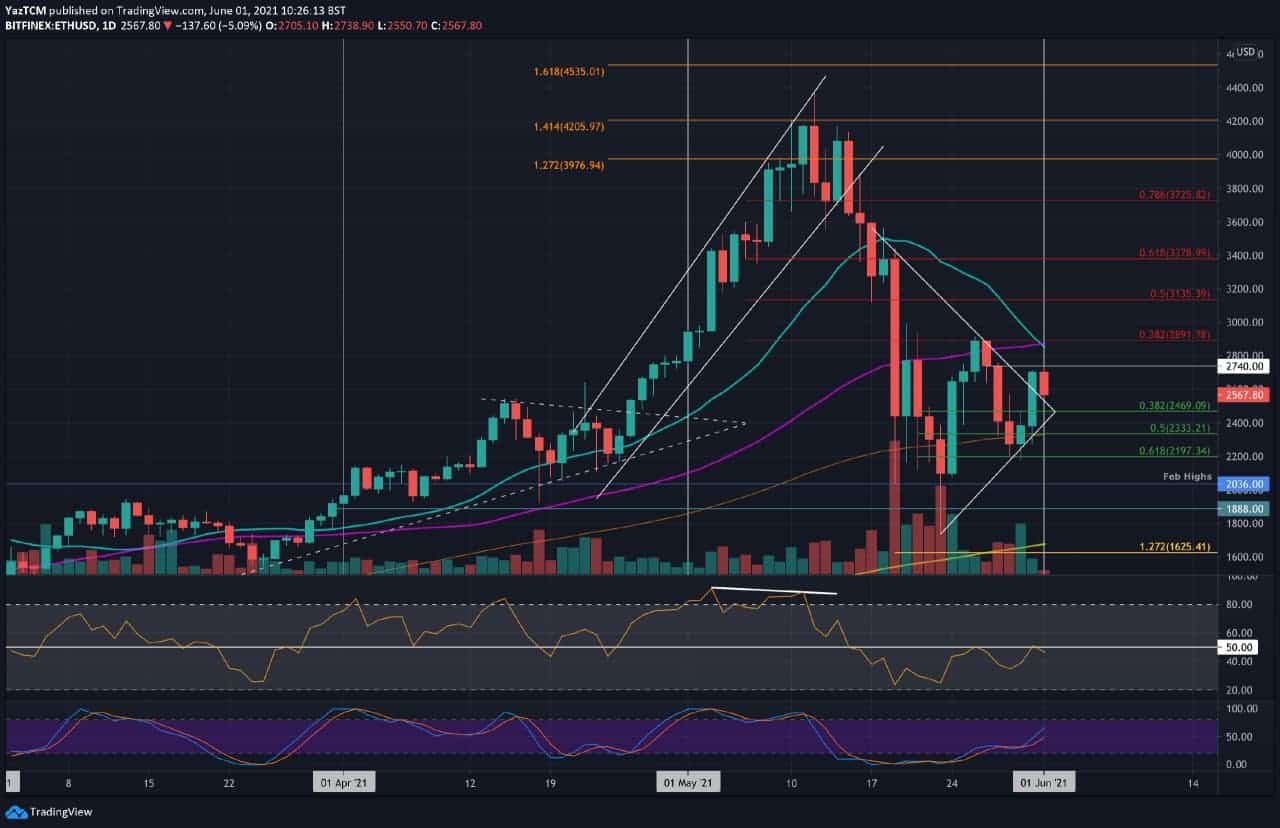
Key Support Levels: $2600, $2470, $2333.
Key Resistance Levels: $2740, $2890, $3000.
ETH surged 4% over the past 24 hours to break above a short-term symmetrical triangle. The coin had hit the support at the lower boundary of this triangle over the weekend after briefly spiking beneath $2200.
Since then, ETH pushed back above the 100-day MA and broke the triangle’s upper boundary yesterday as it broke above $2600. Today, ETH reached as high as $2740 but has since dropped to around $2,600.
ETH-USD Short Term Price Prediction
Looking ahead, the first resistance lies at $2740. This is followed by $2890 (bearish .382 Fib, 50-day MA, & 20-day MA), $3000, and $3135 (bearish .5 Fib).
On the other side, the first support lies at $2600. This is followed by $2470 (.382 Fib), $2333 (.5 Fib & 100-day MA), $2200 (.618 Fib), and $2036 (Feb 2021 highs).
The RSI has returned to the midline, indicating the previous bearish momentum has disappeared, and the market is currently neutral. To break resistance at $2740 and continue toward $3000, the RSI must break beyond 50 and push higher to indicate increased bullish momentum.
ETH/BTC – Bulls Climb Above 20-day MA
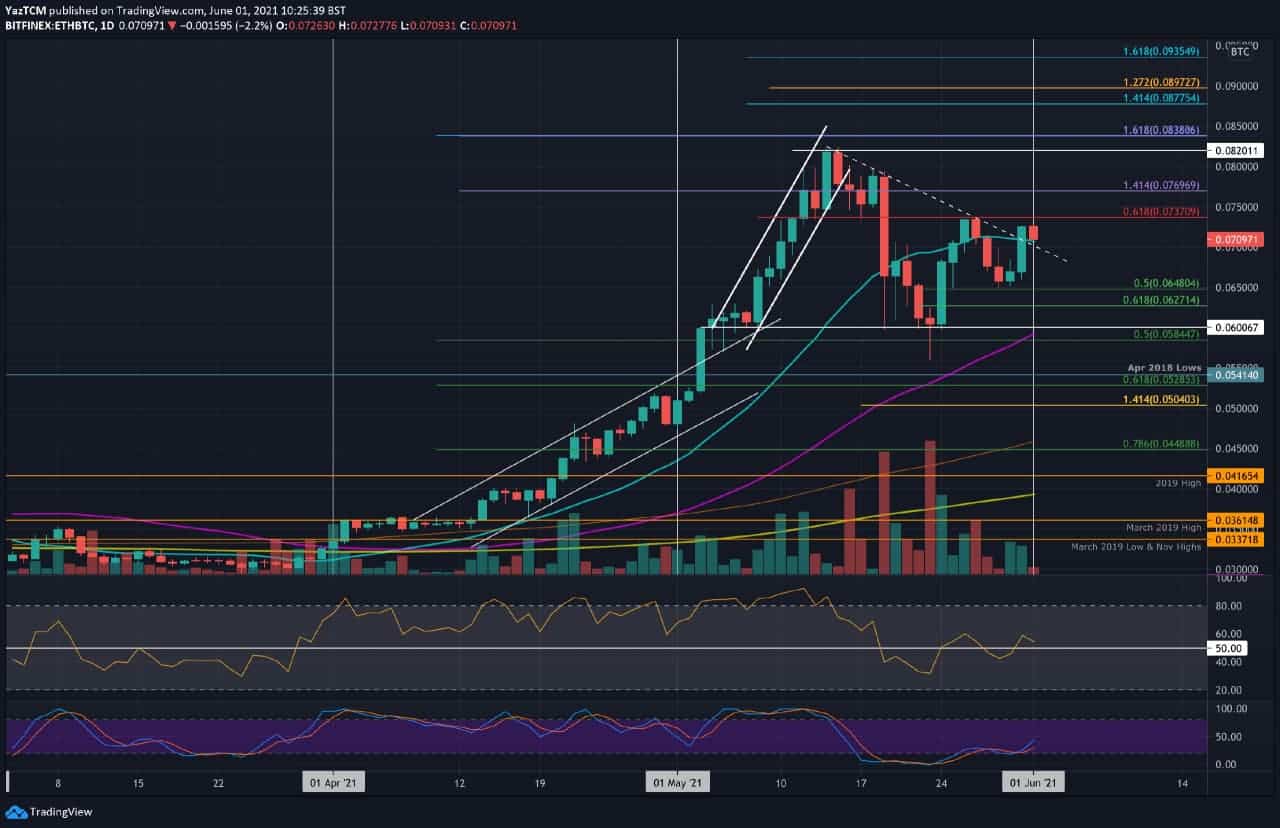
Key Support Levels: 0.07 BTC, 0.067 BTC, 0.0648 BTC.
Key Resistance Levels: 0.0737 BTC, 0.075 BTC, 0.0769 BTC.
Ethereum found support at 0.0648 BTC (.5 Fib) at the start of this week and rebounded higher. It had surged the week before but got stuck at 0.0737 BTC (bearish .618 Fib) and headed lower as the time progressed.
Yesterday, ETH bounced from 0.0648 BTC and pushed above 0.07 BTC to reach 0.0725 BTC. It has since dropped to 0.0721 BTC but is still above the 20-day MA level.
ETH-BTC Short Term Price Prediction
Looking ahead, if the first resistance lies at 0.0737 BTC (bearish .618 Fib). This is followed by 0.075 BTC, 0.0769 BTC (1.414 Fib Extension), and 0.08 BTC.
On the other side, the first support now lies at 0.07 BTC. This is followed by 0.067 BTC, 0.0648 BTC (.5 Fib), and 0.0627 BTC (.618 Fib).
The RSI is above the midline indicating weak bullish momentum within the market. However, it must continue beyond 60 if ETH would like to tackle last week’s resistance. The Stochastic RSI recently produced a bullish crossover signal, indicating bullish pressure is starting to increase.