Ethereum Price Analysis: ETH Eyes Next Critical Support After Reaching 6-Month Low
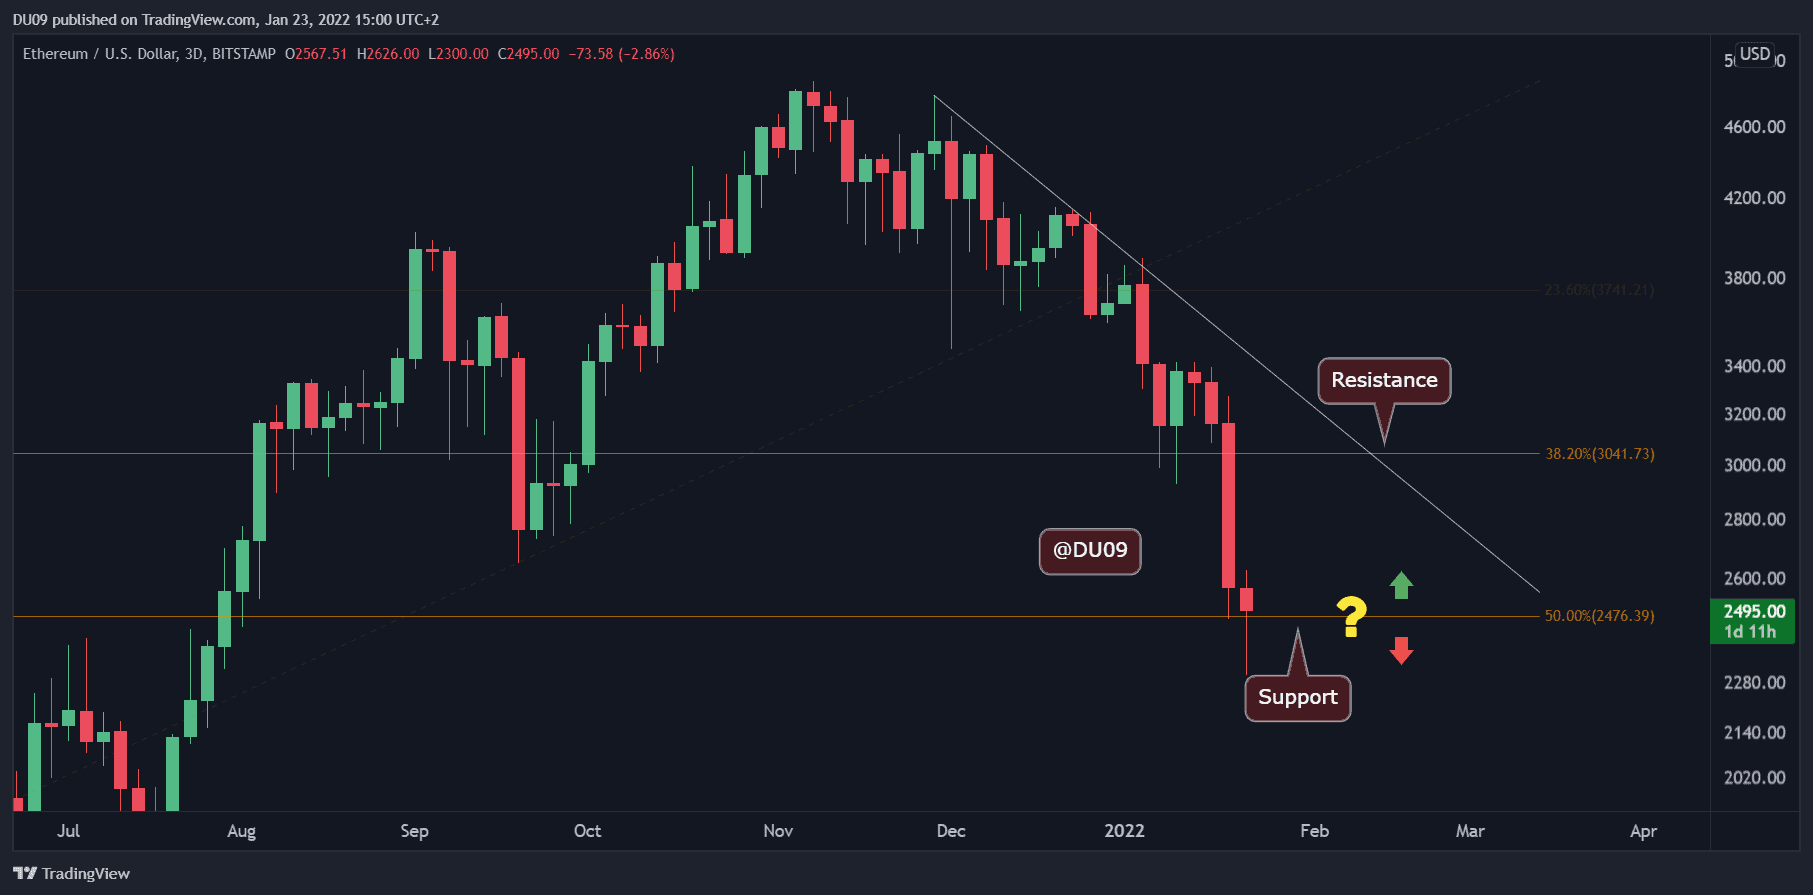
The Friday crash had driven ETH below $2,500, wicking at $2,300 – a price not seen since July 2021.
Key Support levels: $2,300, $2,000.
Key Resistance levels: $2,500, $2,750, 3,000
This week’s market carnage was not kind to ETH, which recorded a daily close below $3,000 for the first time since the end of September. Furthermore, ETH saw a low of $2,300 on Bitstamp, at the peak of the collapse.
Since yesterday, ETH was able to rebound till encountering the $2,500 support turned resistance. After losing the $3,000 support, ETH likely entered a significant correction that may take months to recover.
Technical Indicators
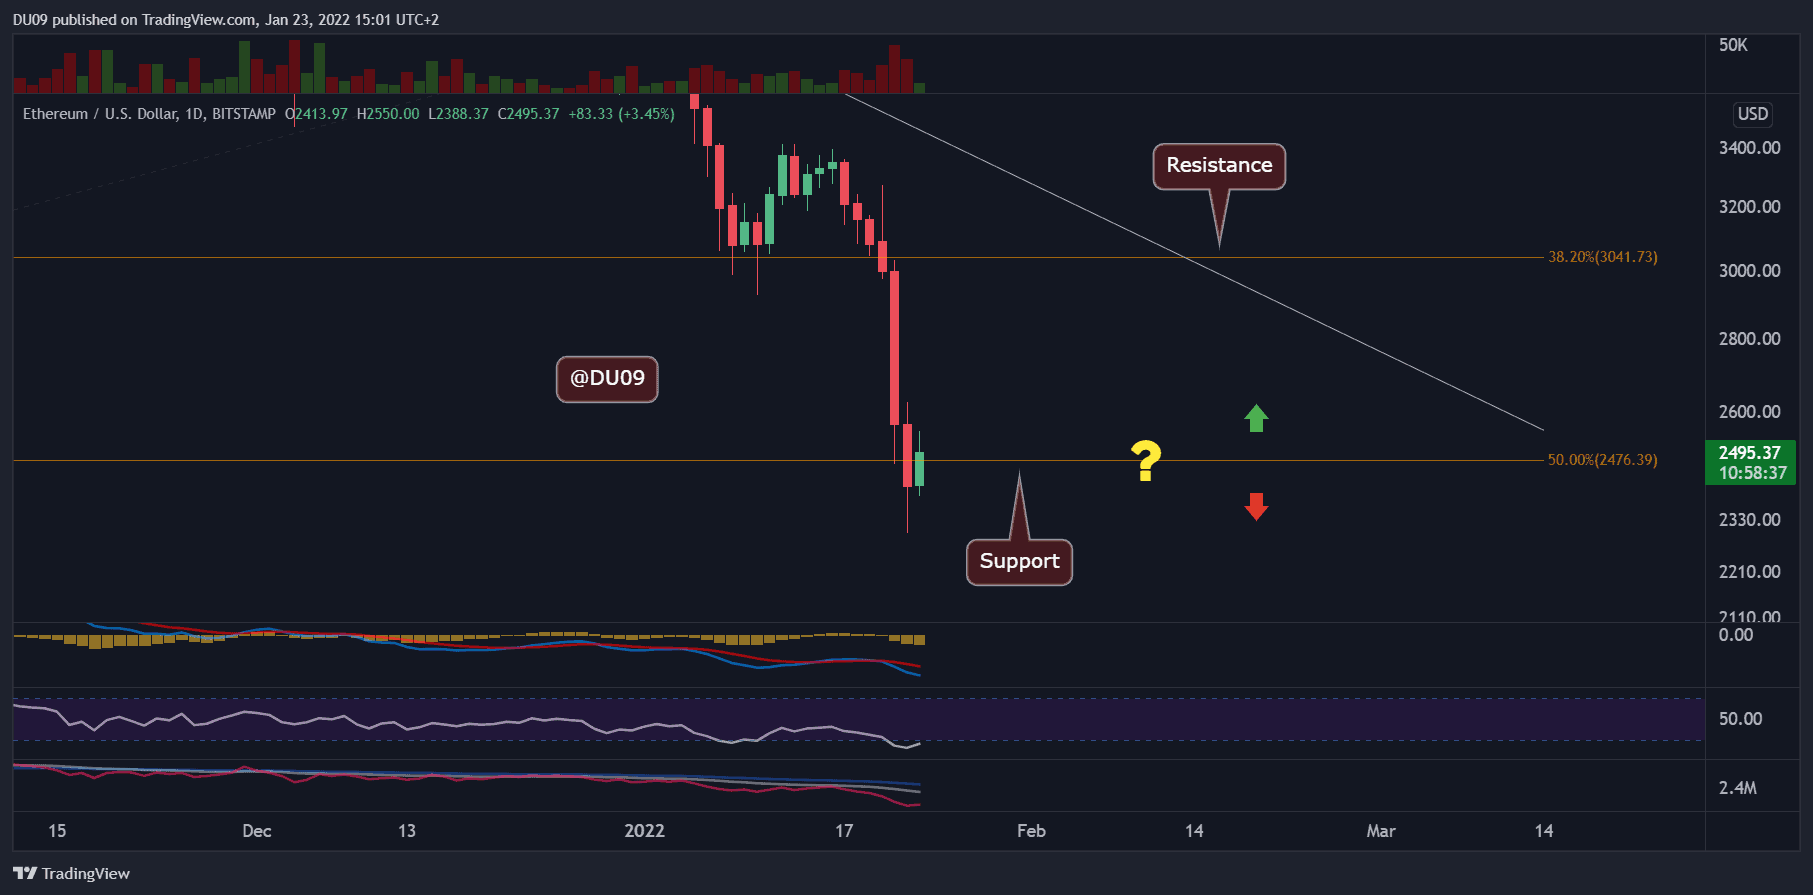
Trading Volume: Very high volume was recorded during the selloff on Friday. The bears are in control.
RSI: The daily RSI also got slammed in line with the price, reaching 21 points and, just as Bitcoin, the RSI is currently deep in the oversold area. Price may enter a relief rally, but unlikely for the mid-term correction to end even if that happens.
MACD: Daily MACD quickly fell into the bearish territory with the histogram and moving averages expanding on the negative side. A reversal appears unlikely in the short term, as sellers completely control the market.
Bias
The bias for ETH is currently bearish. With the $3,000 support breakdown, ETH entered an intense correction.
Short-Term Price Prediction for ETH
It is unlikely that the correction will end anytime soon and any relief rally will only be temporary as ETH seeks a bottom. Until that is found, the next support level, should $2,300 fail, is located at $2,000. The next major resistance is $2500, followed by September lows at $2750.