Ethereum Price Analysis: ETH Drops Below $300 As Bitcoin Drags It Down
Ethereum saw a sharp price decline of 7% over the past 24 hours which caused the price to drop back below $300 to where it currently trades around $287. The recent pullback comes after Ethereum created fresh multi-year lows against BTC after dropping beneath the support at 0.024 BTC.
Ethereum remains the 2nd largest cryptocurrency with a market cap of $30 billion. Despite consistently falling against BTC all year round, it has still increased by a total of 75% over the past 3 months against the USD.
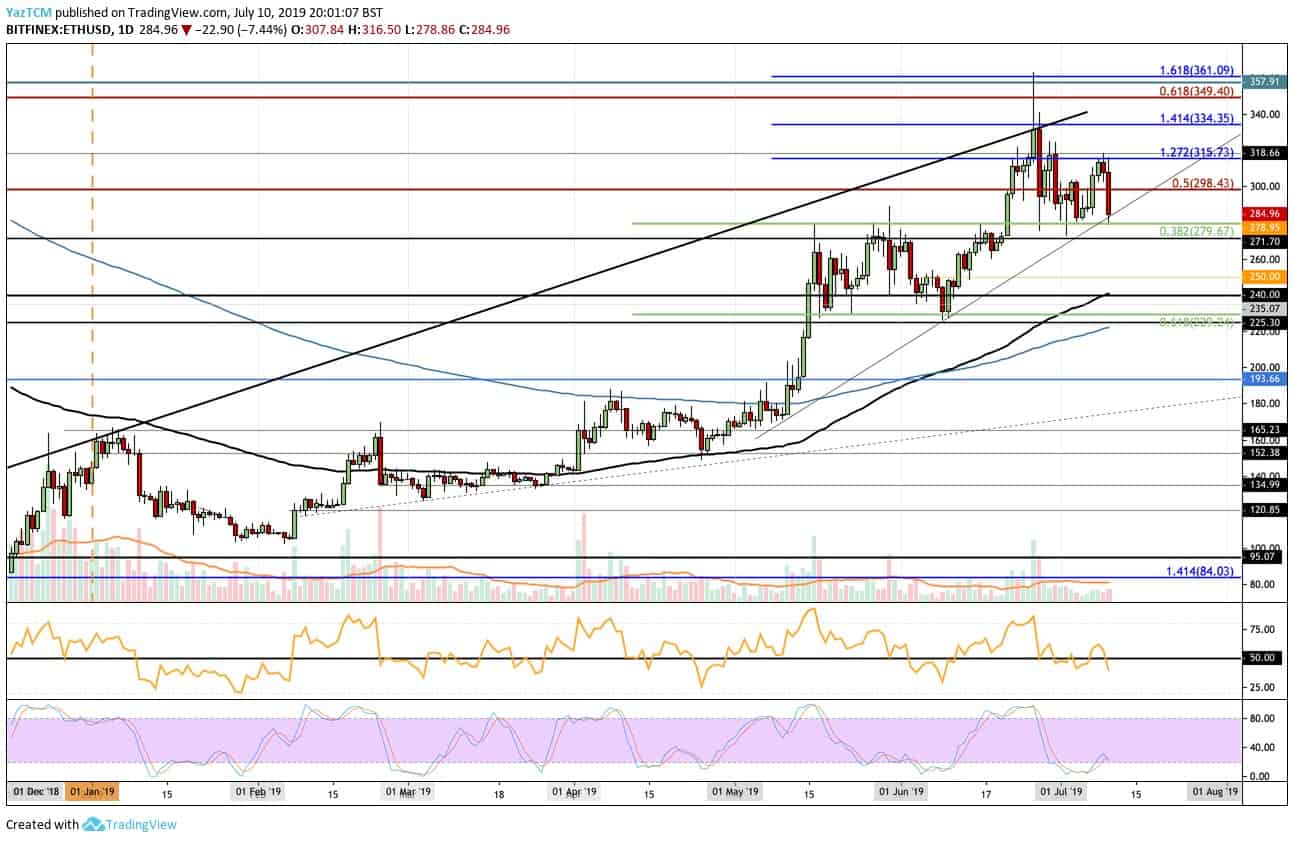
Looking at the ETH/USD 1-Day Chart:
- Since our previous ETH/USD analysis, we can see that ETH went on to rebound higher from the highlighted support at $280. Ethereum managed to break back above $300 to reach a high of $315 before rolling over. We can now see that the recent price drop has caused ETH to pull back below $300.
- From above: The nearest levels of resistance lie at $300 and $315. Above this, higher resistance lies at $334 and $350. The resistance at $350 is bolstered by a long term bearish .618 Fibonacci Retracement level. If the bulls continue above $350, higher resistance is located at $360, $380 and $400.
- From below: The nearest level of support now lies at $279 and the short term rising trend line at the same level. Beneath this, further support lies at $271, $250 and $240. The support at $240 is further strengthened by the 100 day EMA.
- The trading volume has remained pretty low during July and shows no sign of increasing.
- The Stochastic RSI bullish crossover signal has played out recently as we wait for the Stochastic RSI to expand further -although it looks like it will be heading lower again. Furthermore, the RSI itself has recently broken below the 50 level which shows the bears are in control of the momentum.
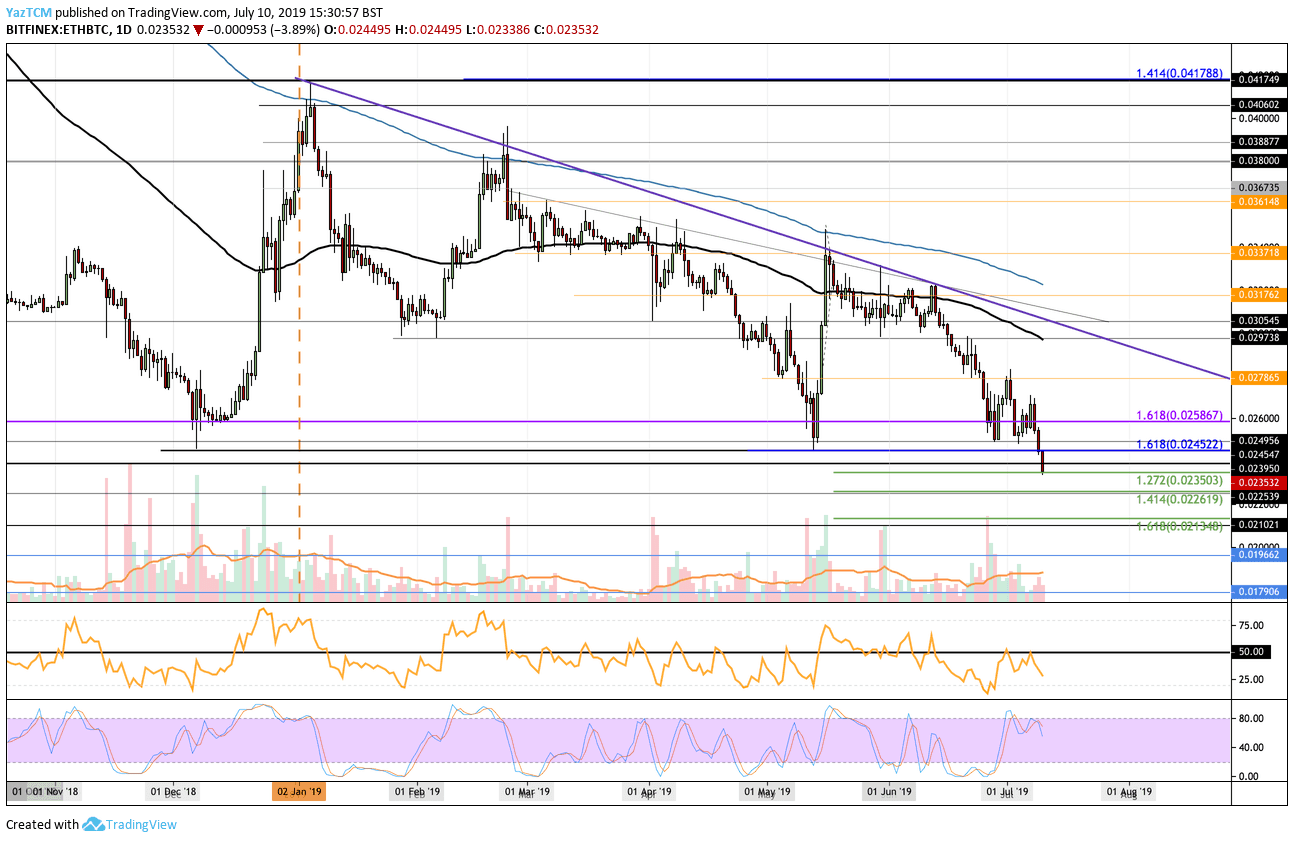
Looking at the ETH/BTC 1-Day Chart:
- Against Bitcoin, we can see that things are getting pretty tough. The coin has recently dropped beneath the strong support around 0.024 BTC and has traveled lower to find current support at 0.02350 BTC – provided by a downside 1.272 Fibonacci Extension level.
- From above: The nearest level of resistance now lies at 0.024 BTC. Above this, higher resistance lies at 0.02452 BTC, 0.025 BTC, and 0.026 BTC. IF the buyers continue to break above 0.026 BTC, higher resistance is located at 0.027 BTC and 0.02786 BTC.
- From below: IF the sellers continue to push the market beneath the current support at 0.02350 BTC, the next level of support below lies at 0.02261 BTC – provided by the downside 1.414 Fibonacci Extension level. Beneath this, further support lies at 0.022 BTC and 0.02134 BTC.
- The trading volume has started to increase as holders continue to drop their bags of Ethereum.
- The RSI has recently been turned away from the 50 level which shows that the sellers are still not ready to give up their control of the market momentum.
The post Ethereum Price Analysis: ETH Drops Below $300 As Bitcoin Drags It Down appeared first on CryptoPotato.