Ethereum Price Analysis: ETH Creates a Fresh Low for July, What’s Next
ETH/USD – Ether Creates Fresh July Low and Retests $1800 Support
Key Support Levels: $1800, $1710, $1625.
Key Resistance Levels: $1888, $2000, $2035
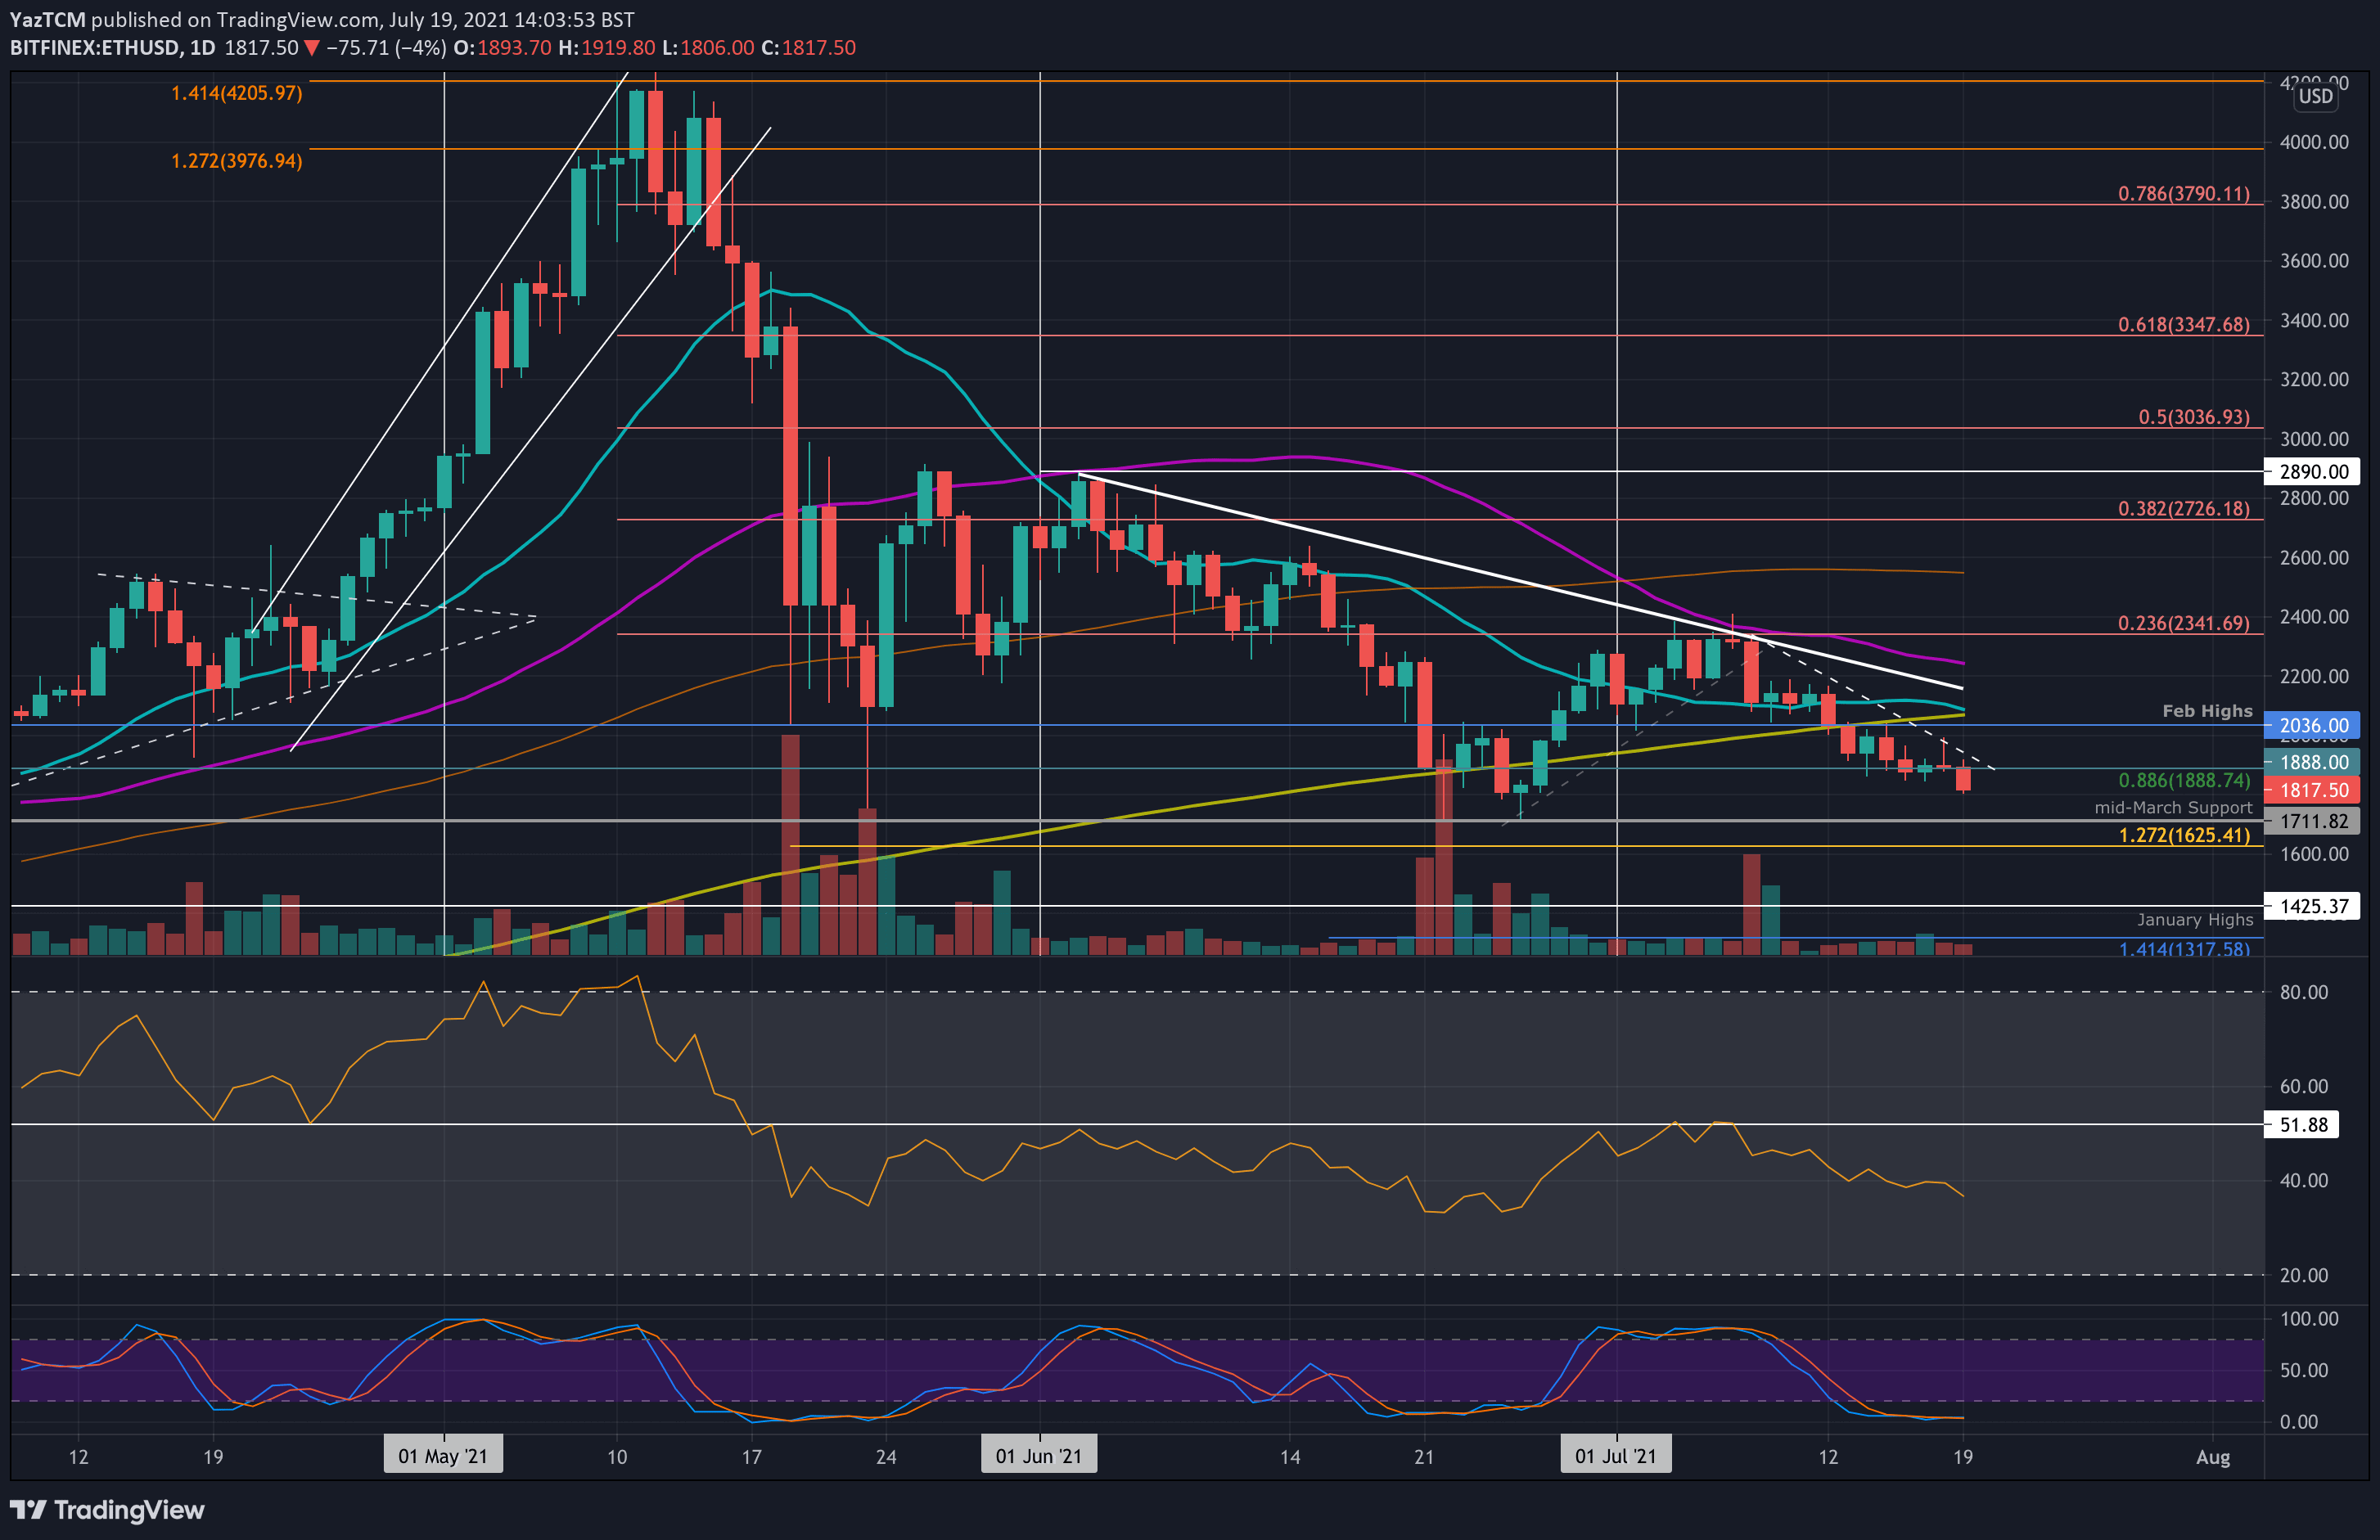
Ethereum is feeling the bearish pressure from the Bitcoin price drop as it sinks toward $1800 again. The coin failed to break resistance at the 50-day MA around $2340 earlier in the month and has been declining ever since.
The bulls were battling to hold support around $1880 over the weekend, but today’s price drop pushed ETH as low as $1800 so far as it re-tests the June low-day closing price there.
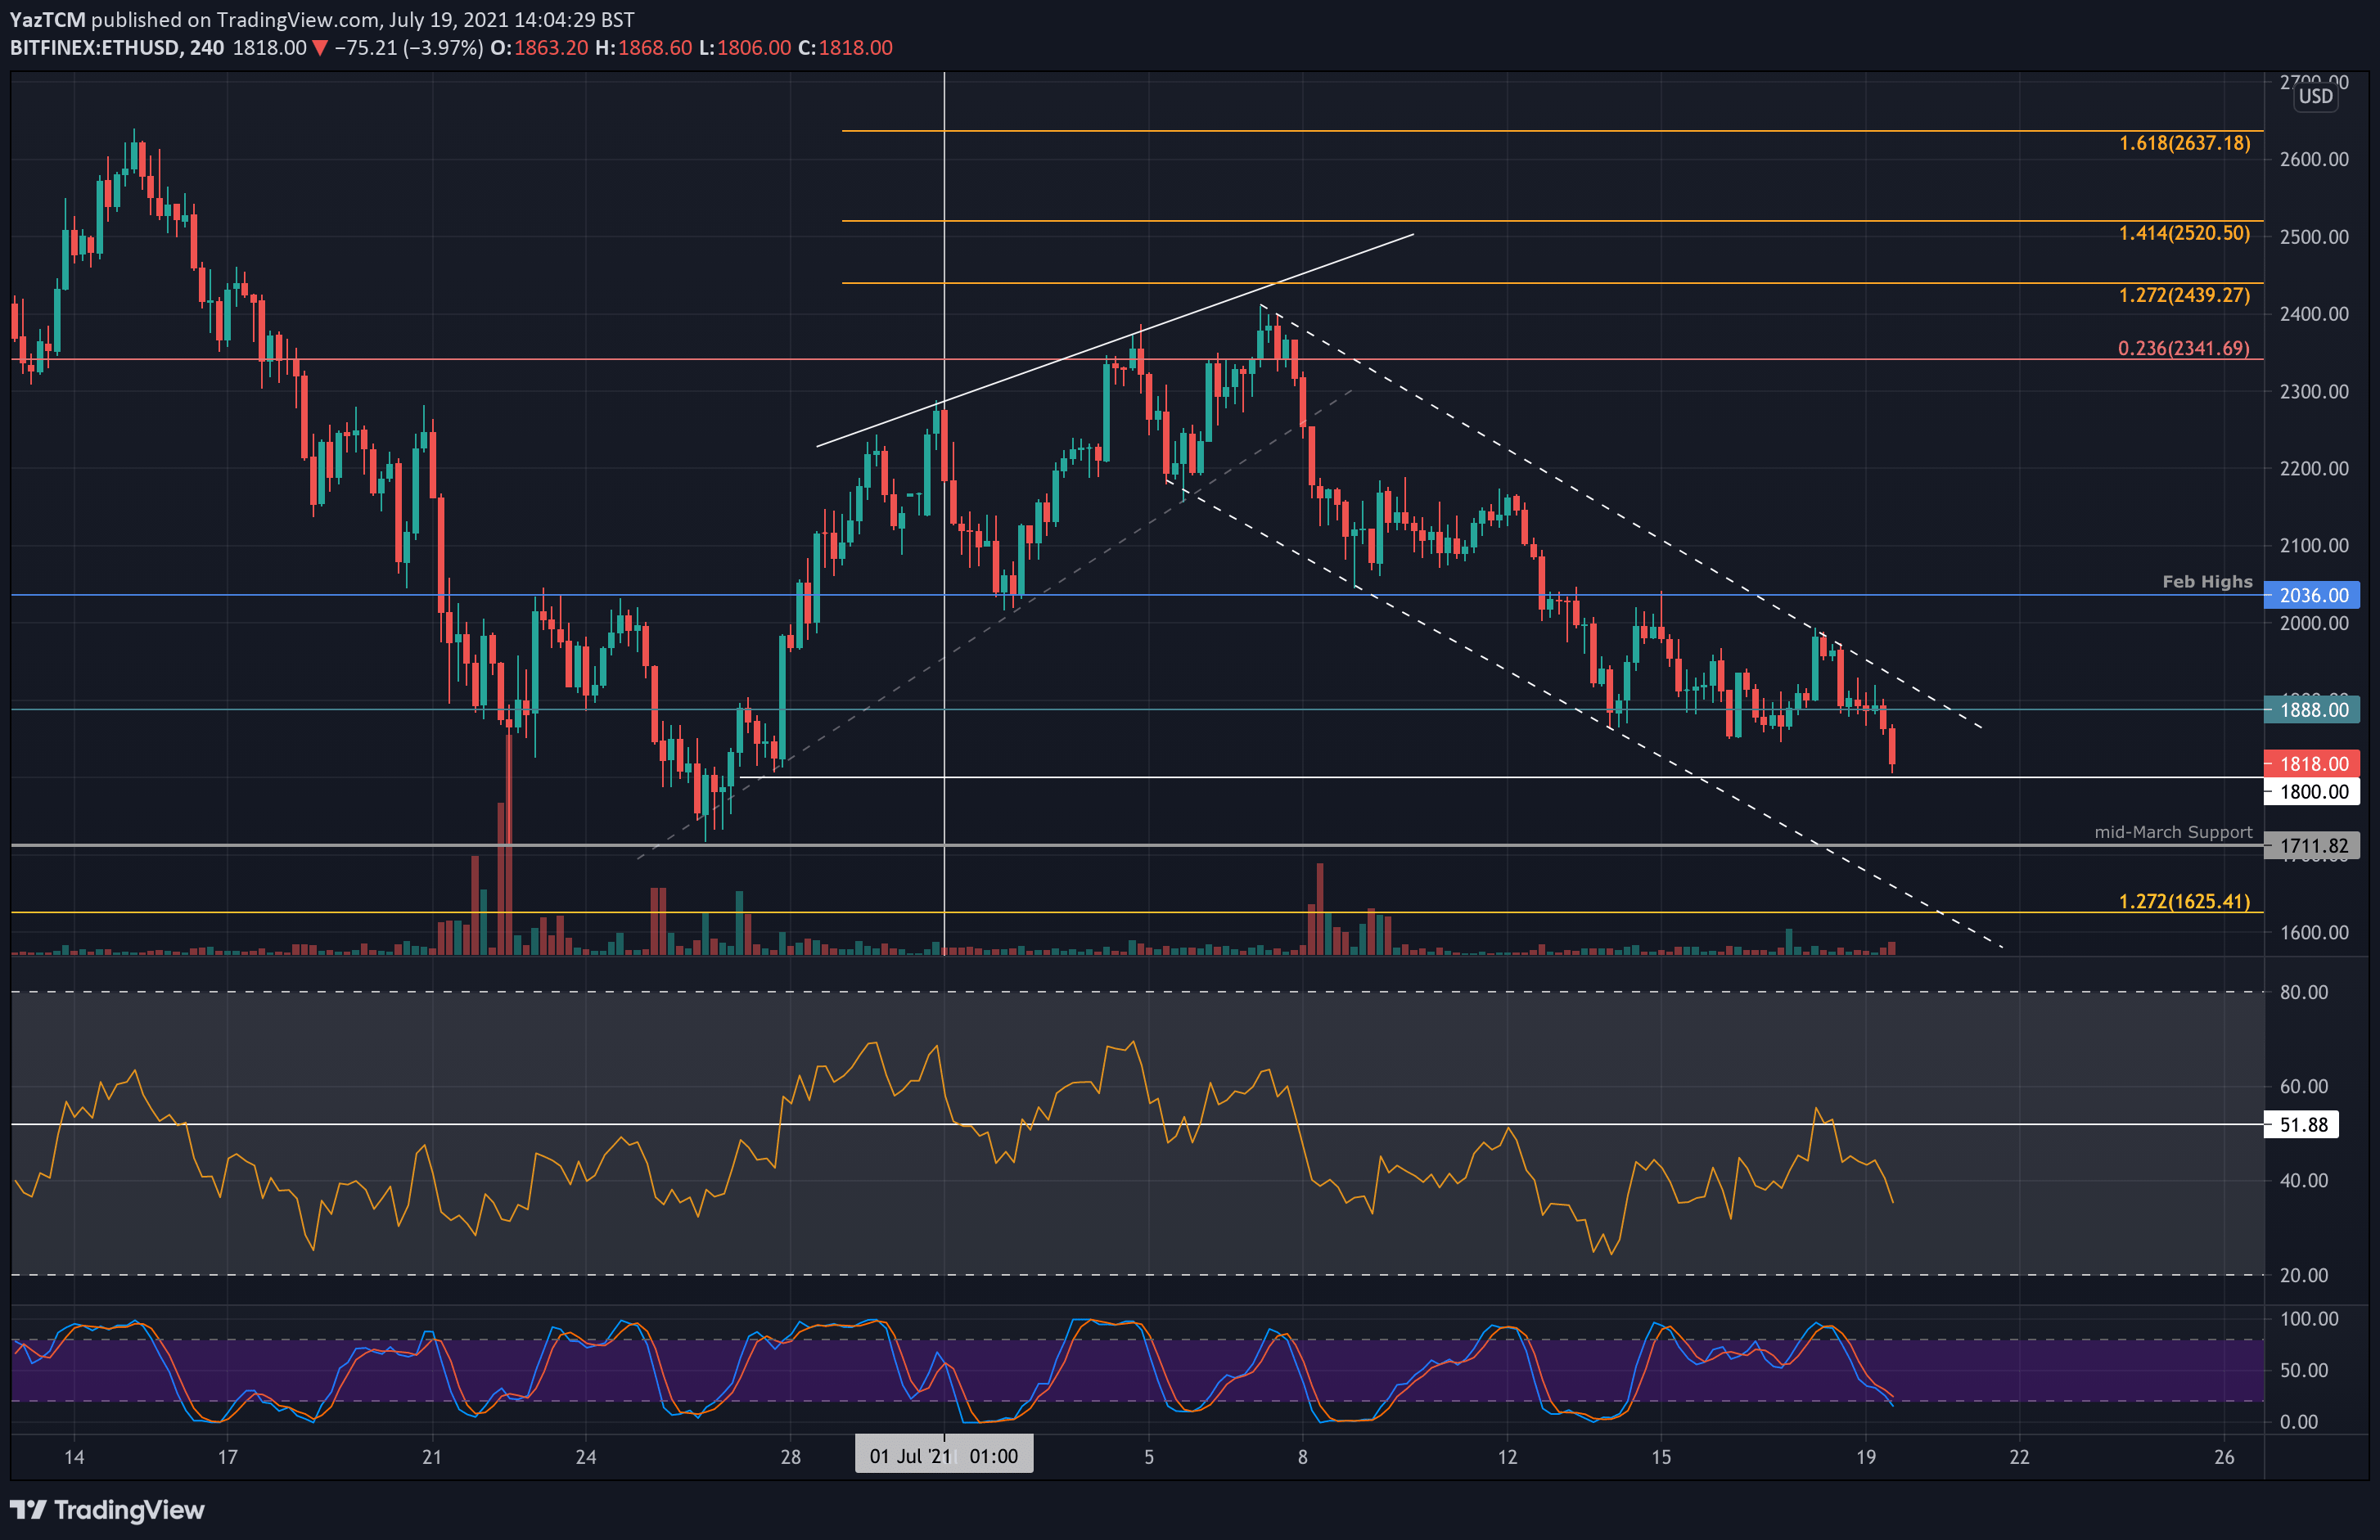
On the 4-hour charts, Ethereum is trading inside a descending price channel. It tested the upper angle of this channel at $2000 toward the end of last week but has since rolled over and created a new low for July.


ETH-USD Short Term Price Prediction
Looking ahead, the first crucial support lies at $1800. This is the low-day closing price for June and would be critical to defend. Failing this, the next support lies at $1710, the June low and mid-March support. Finally, added support lies at $1625 (downside 1.272 Fib Extension & lower angle of the price channel) and $1500.
On the other side, the first resistance now lies around $1888 (upper angle of the price channel). This is followed by $2000, $2035 (Feb highs), and $2200.
The daily RSI is heading lower, indicating increased bearish momentum. If it continues to fall, ETH can certainly be expected to drop beneath $1800.
ETH/BTC – Bears Head Toward 0.058 BTC Support.
Key Support Levels: 0.058 BTC, 0.056 BTC, 0.055 BTC.
Key Resistance Levels: 0.06 BTC, 0.061 BTC, 0.0628 BTC.
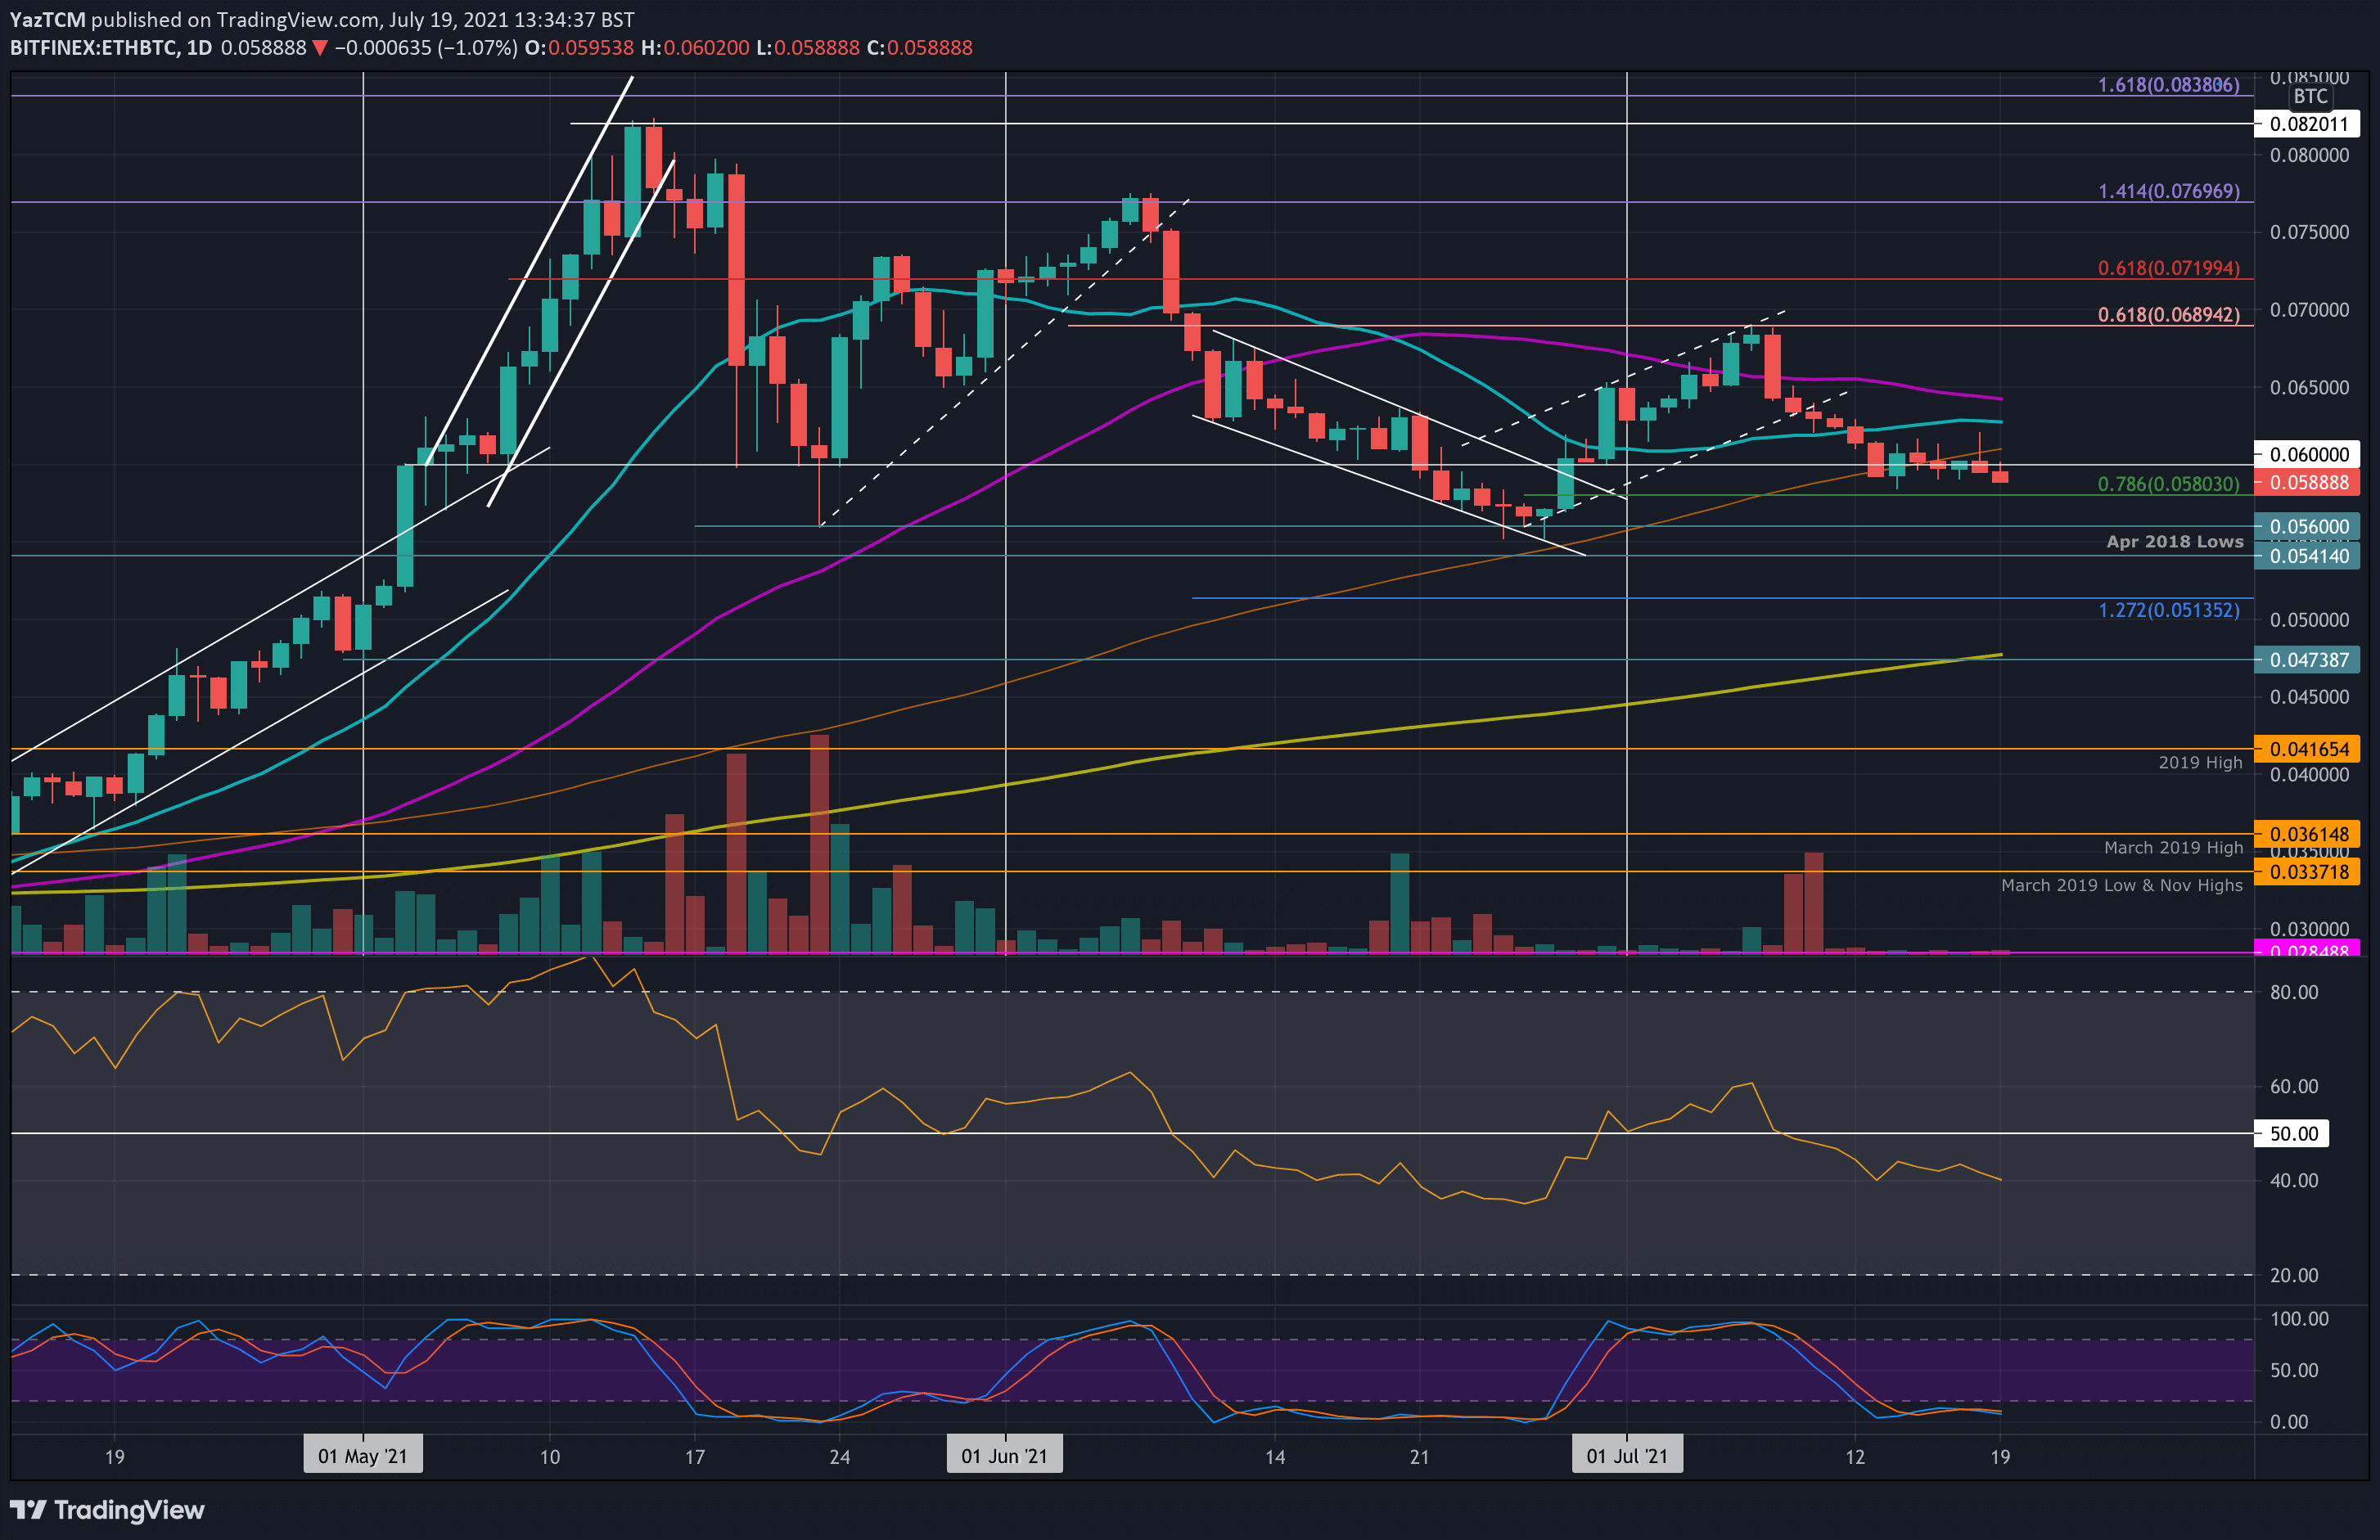
Etheruem is also looking bearish against BTC as it battles to remain above 0.0588 BTC support. It failed to break resistance at around 0.069 BTC earlier in the month and has been in a steady decline ever since.
It is now cleanly trading beneath the 100-day MA as the bearish pressure looks to send it beneath the June lows.

ETH-BTC Short Term Price Prediction
Moving forward, the first support lies at 0.058 BTC. This is followed by 0.056 BTC (June low-day closing price), 0.0541 BTC (April lows), and 0.051 BTC (downside 1.272 Fib Extension).
On the other side, the first resistance lies at 0.06 BTC. This is followed by 0.061 BTC (100-day MA), 0.0628 BTC (20-day MA), and 0.065 (50-day MA).
Again, the RSI is heading lower, indicating bearish momentum. A break beneath the 40 level will send ETH/BTC beneath the June 0.056 BTC support.


