Ethereum Price Analysis: ETH Continues Consolidation Around $1,800, Huge Move Inbound?
ETH/USD – Market Is Rangebound This Past Week.
Key Support Levels: $1750, $1695, $1620.
Key Resistance Levels: $1800, $1875, $1900.
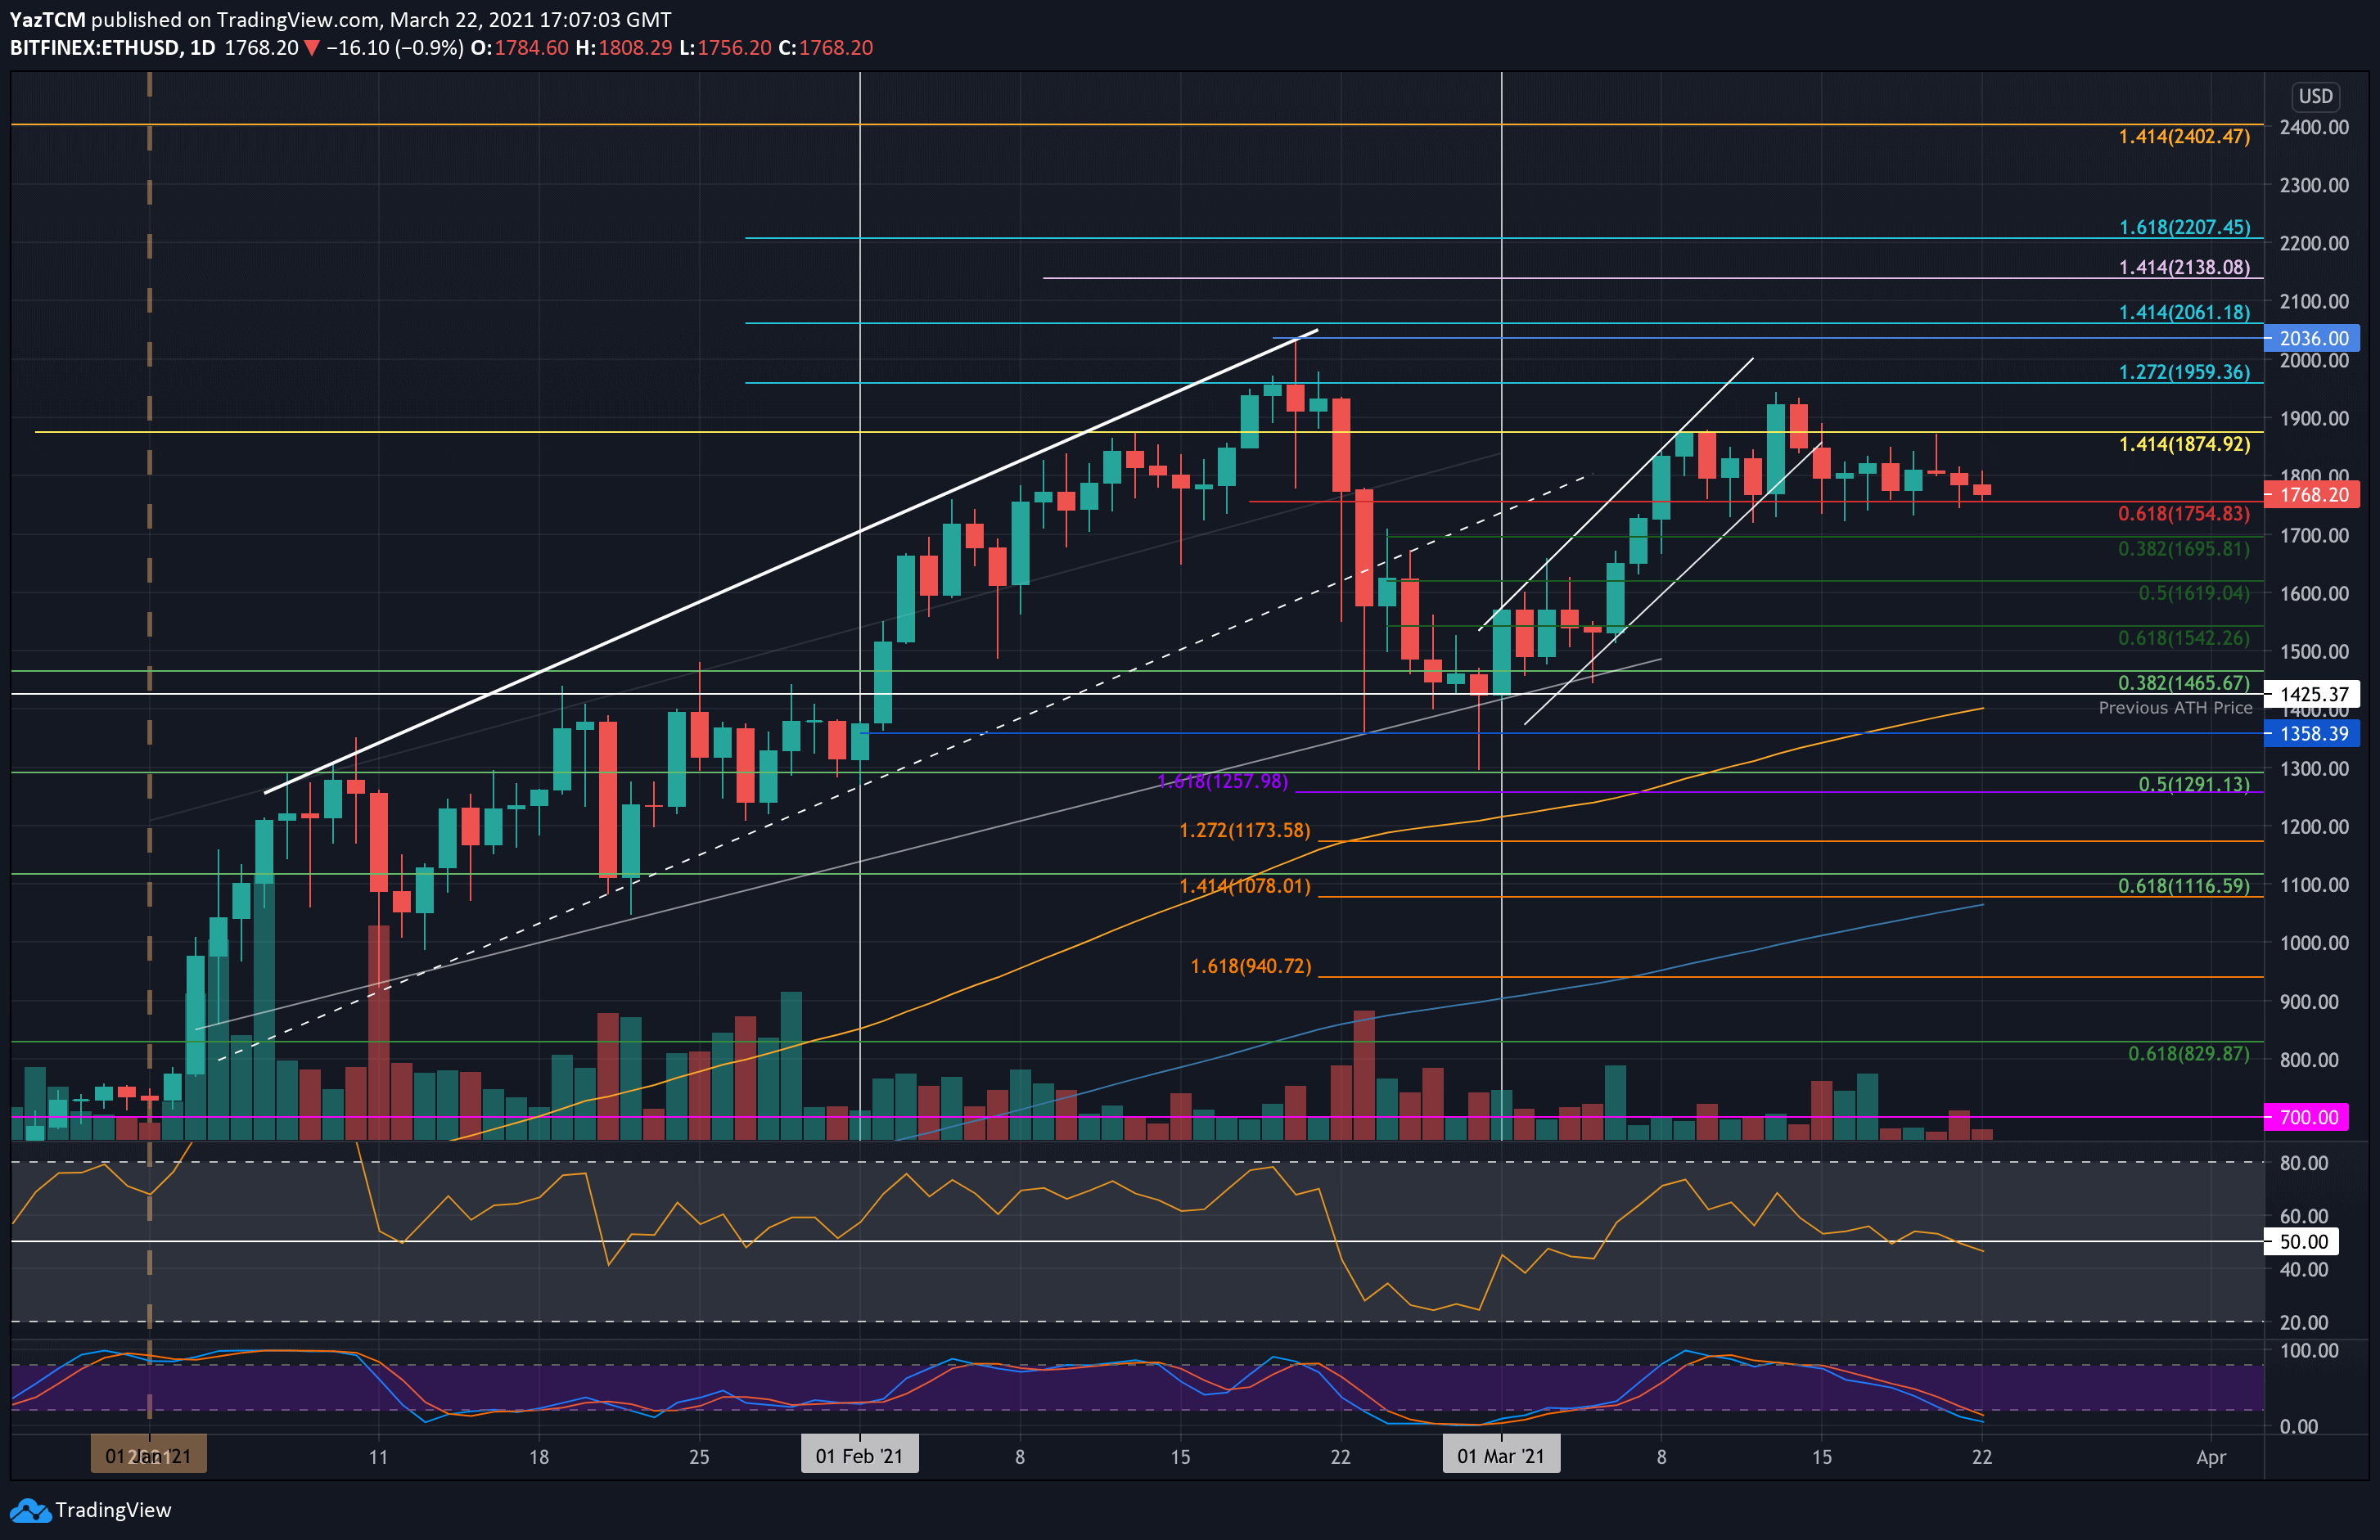
Ethereum has been fairly static over the past week of trading as the cryptocurrency remained trapped between a range of $1875 and $1750 for the past eight days. It attempted to break the upper boundary of this range over the weekend but failed to overcome the resistance and has since dropped into the lower boundary today.
Before establishing this range, Ethereum was trading well after rebounding from support at $1425 at the beginning of the month. It pushed higher to create a new March high at $1950 but could not continue further. This resulted in ETH heading sideways within the defined range.
A breakout of this range will be required to dictate the next direction for Ethereum in the short term.
ETH-USD Short Term Price Prediction
Looking ahead, the first level of support lies at $1750. This is followed by $1695 (.382 Fib), $1620 (.5 Fib), $1600, and $15,42 (.618 Fib).
On the other side, the first resistance lies at $1800. This is followed by $1875 (upper boundary of current range), $1900, $1960, and $2036 (ATH Price).
The RSI recently dipped beneath the midline, indicating that the bears are attempting to take control of the market momentum. If it continues to drop, the bearish momentum will increase, and it is likely to push ETH beneath the current range. Luckily, the Stochastic RSI is already extremely oversold, and a bullish crossover signal should send the market higher.
ETH/BTC – Buyers Defend 0.0305 BTC Support
Key Support Levels: 0.031 BTC, 0.0305 BTC, 0.03 BTC.
Key Resistance Levels: 0.032 BTC, 0.0337 BTC, 0.00345 BTC.
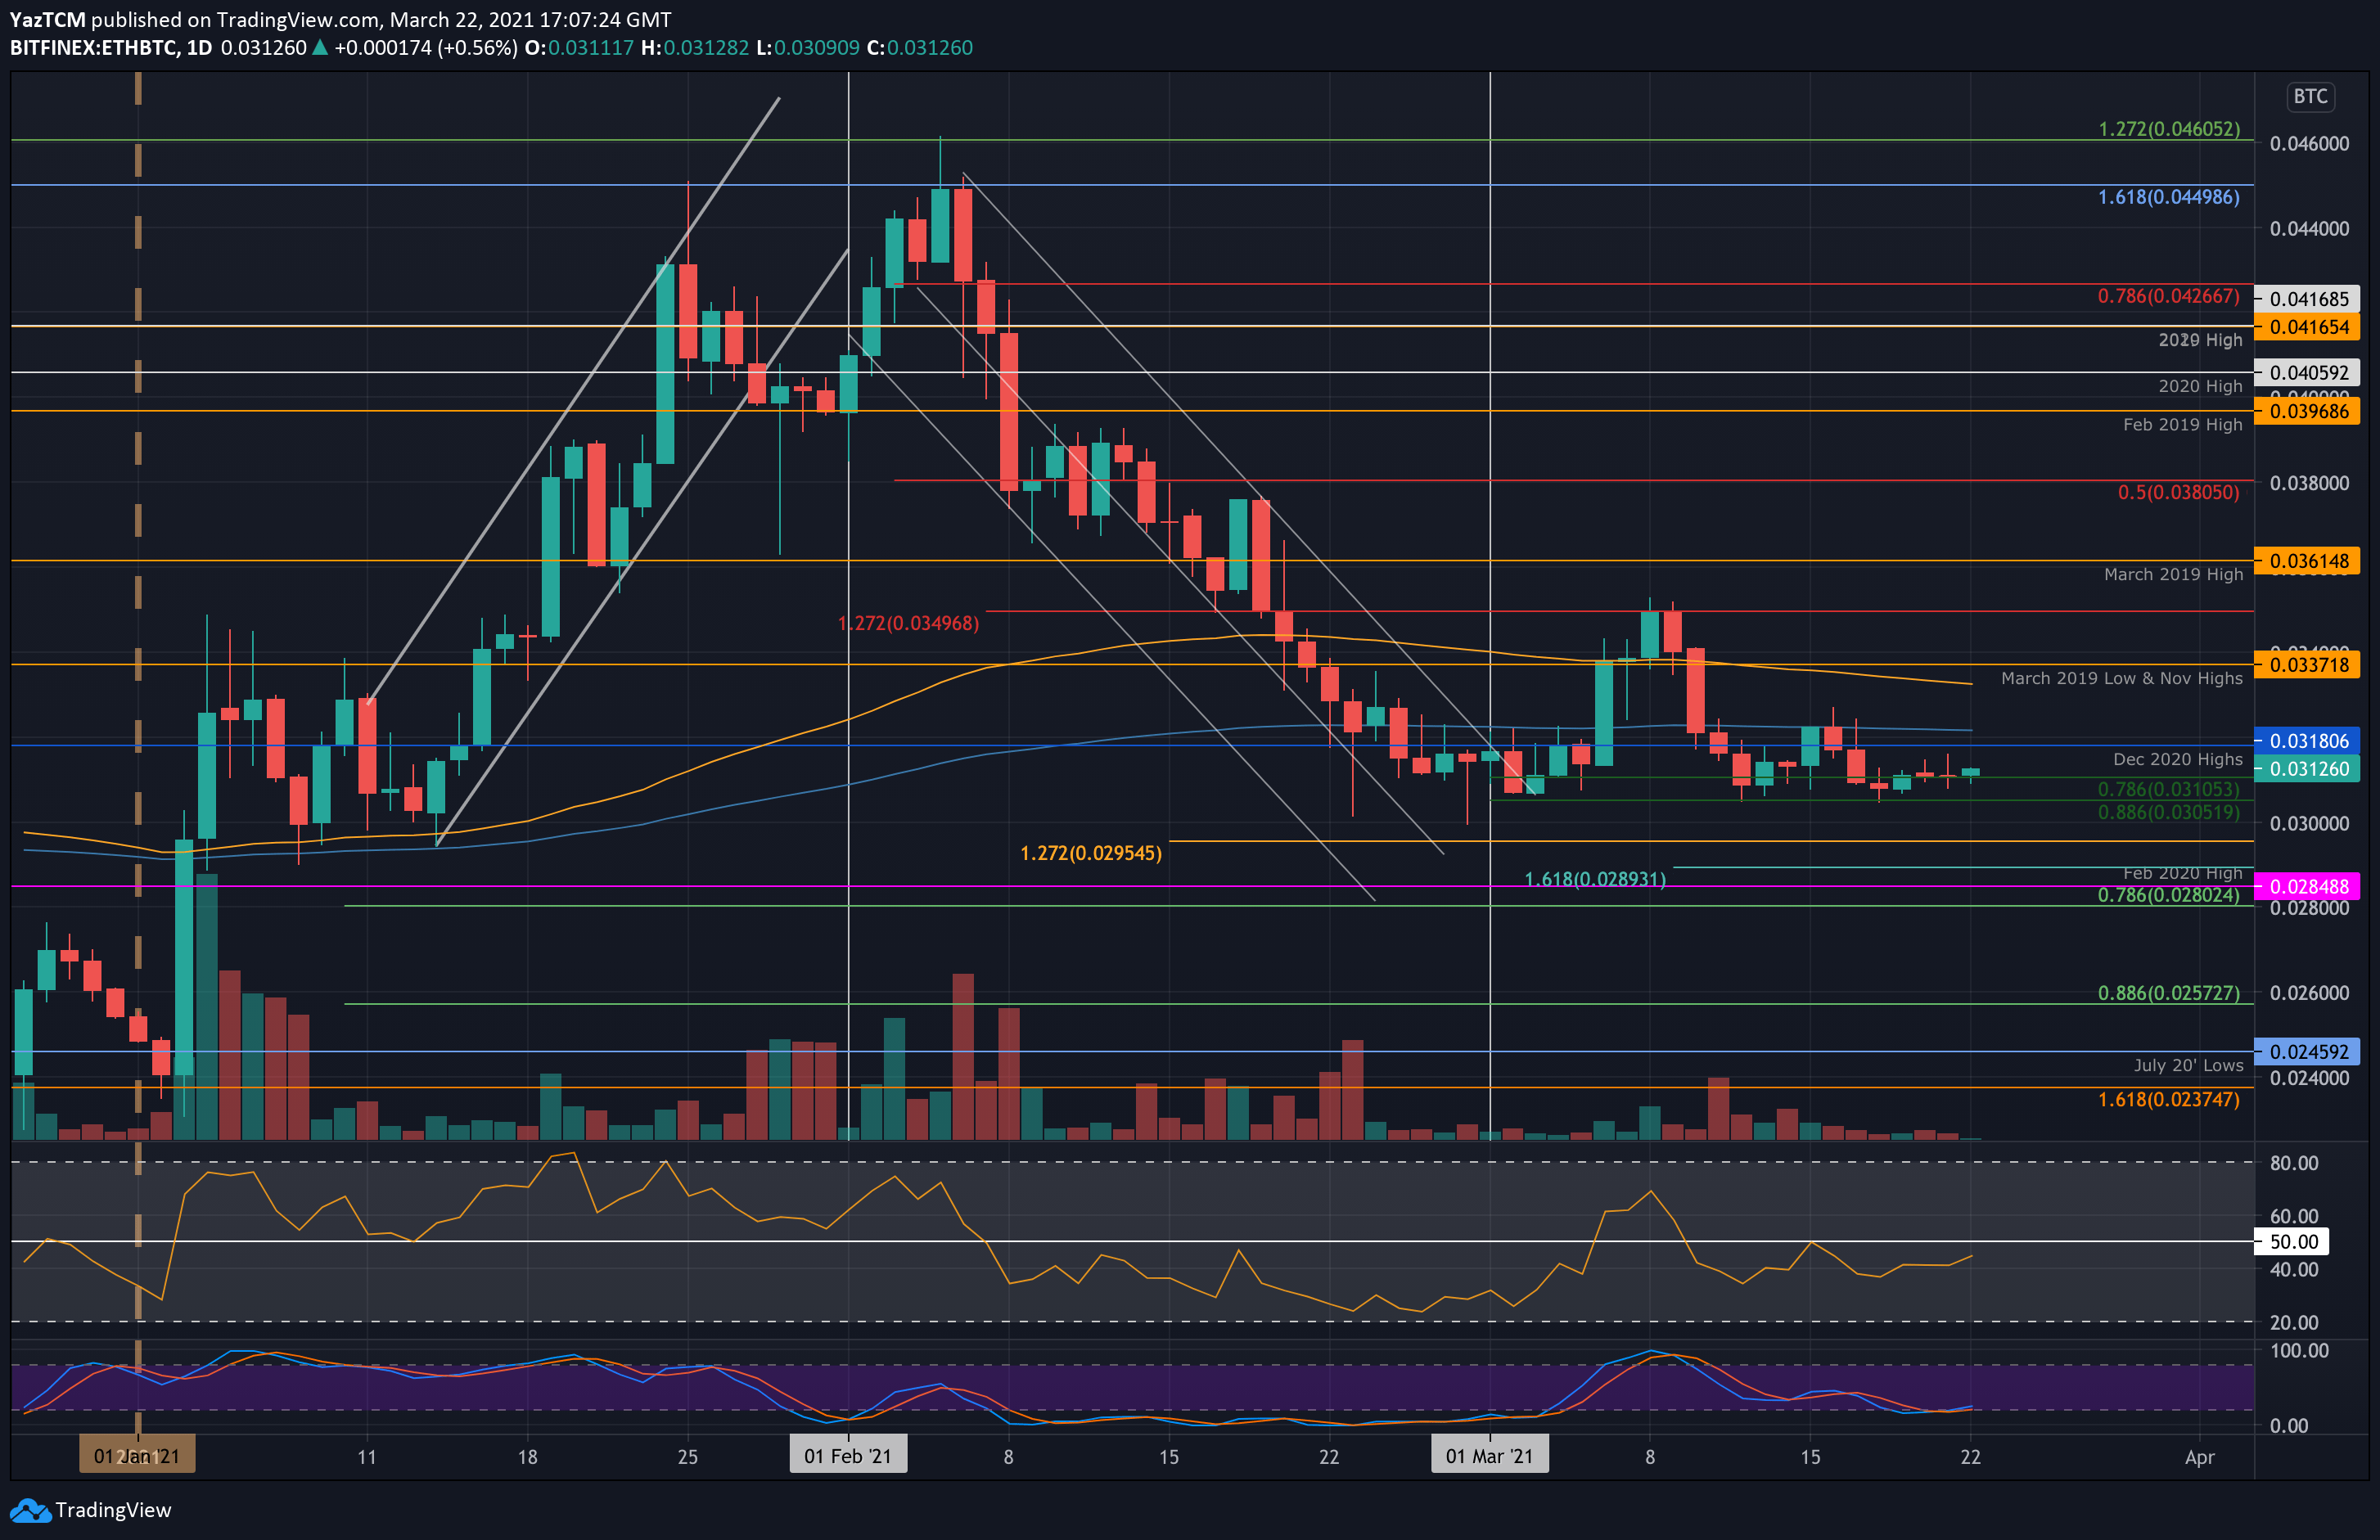
Ethereum is trying to fashion a rebound against Bitcoin as it breaks above the 0.031 BTC level today. The cryptocurrency had dropped from a high of 0.0345 BTC during the first week of March, and it went on to drop from there until support was found at 0.0305 BTC (.886 Fib) last week.
Over the weekend, the bulls started to push higher from 0.0305 BTC, and they moved above 0.031 BTC today as the bulls attempt for a rebound.
ETH-BTC Short Term Price Prediction
Looking ahead, the first level of resistance lies at 0.032 BTC (200-day EMA). This is followed by 0.0337 BTC (100-days EMA & Nov 2020 highs), 0.0345 BTC (March highs), and 0.0361 BTC (March 2019 Highs).
On the other side, the first support lies at 0.031 BTC (.786 Fib). This is followed by 0.0305 BTC (.886 Fib), 0.03 BTC, and 0.0295 BTC (downside 1.272 Fib Extension).
The RSI is pushing higher here, indicating the bearish momentum is starting to fade. It would need to break above the midline to allow the buyers to control the market momentum and push ETH above the 200-day EMA. Likewise, the Stochastic RSI is also extremely oversold, which should help the market to rebound.