Ethereum Price Analysis: ETH Bulls Stopped by $475 Resistance, is $500 Still In Play?
ETH/USD – Ethereum Stalled By September High-Day Closing Price
Key Support Levels: $445, $439, $430.
Key Resistance Levels: $475, $490, $500.
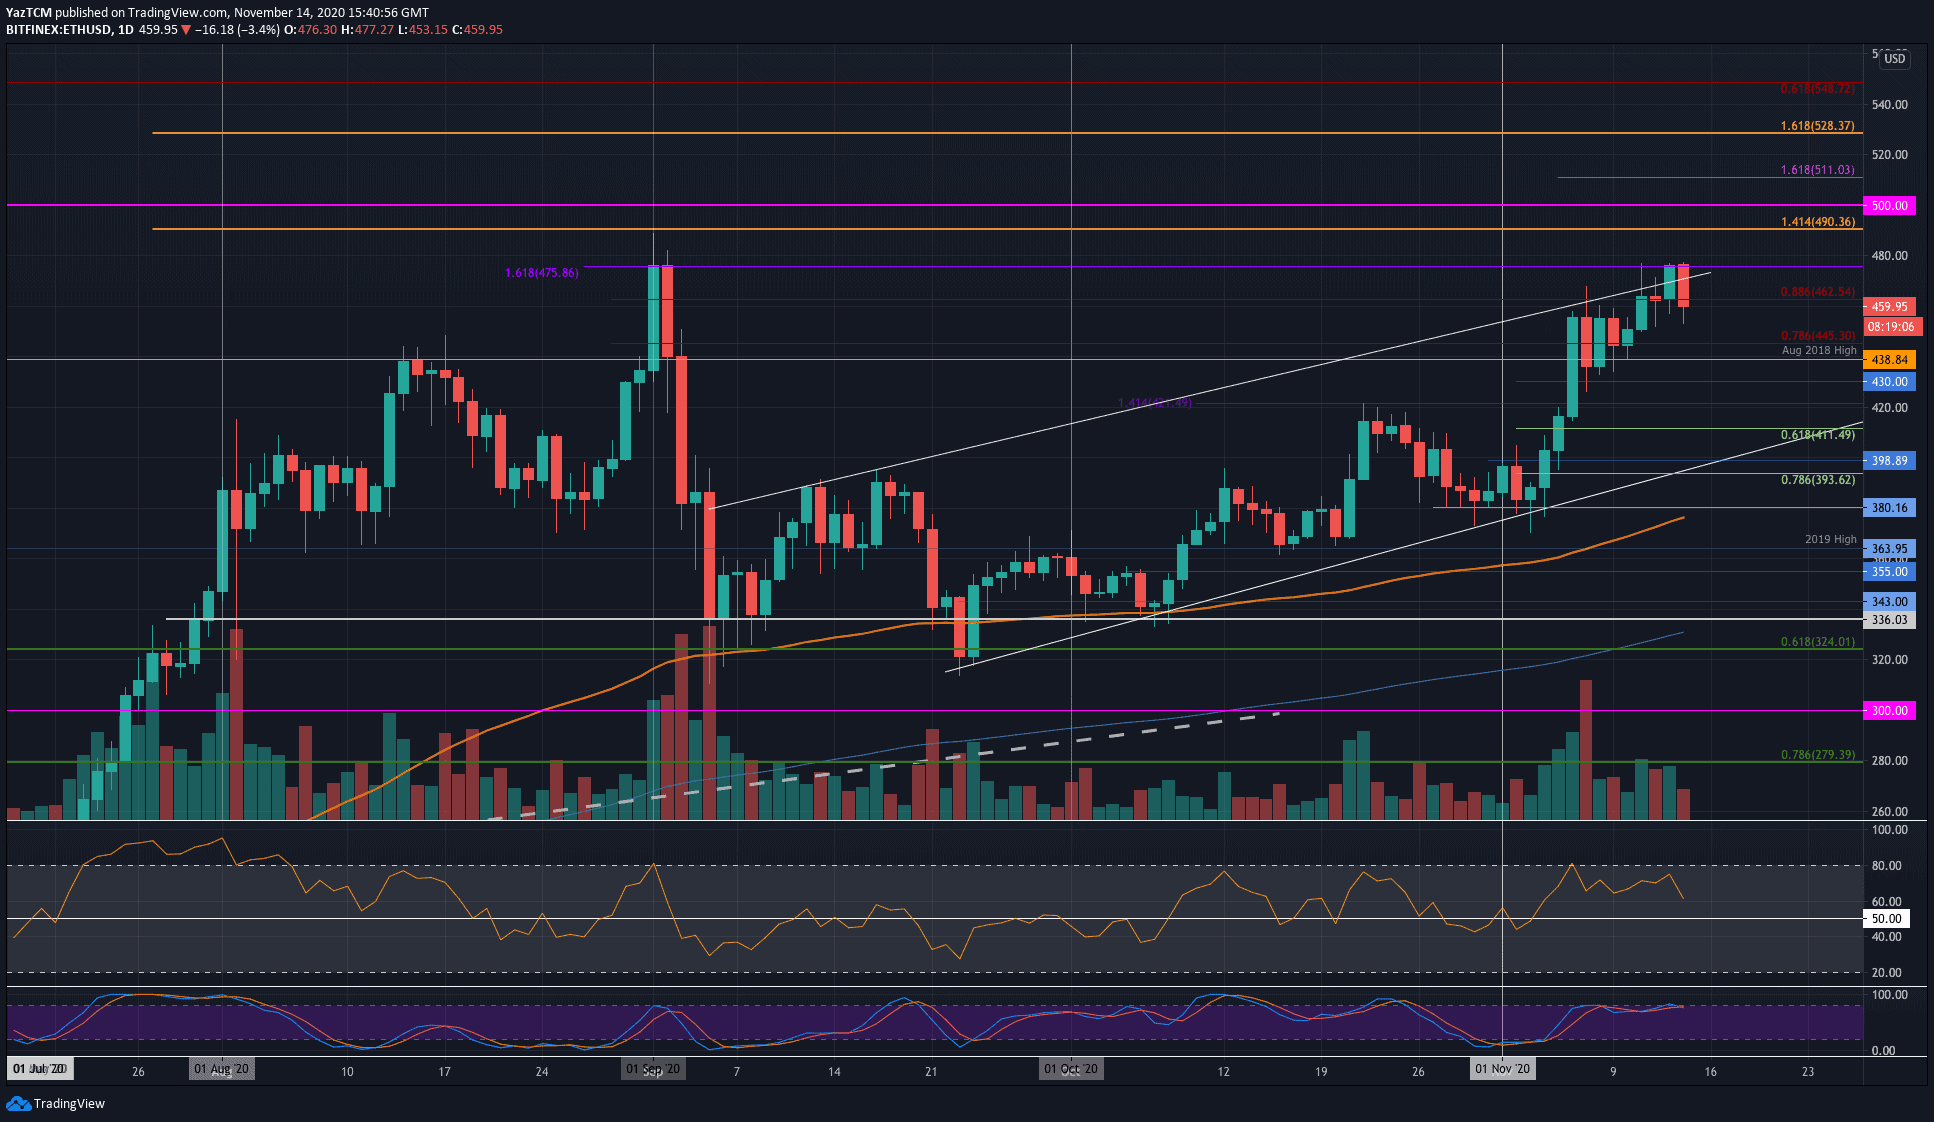
Ethereum managed to surge higher from the resistance at $462.50 (bearish .886 Fib) yesterday as it pushed into the $475 resistance provided by the September High-Day closing price. Unfortunately, the coin was unable to continue further above $475 and has since dropped to the $460 level.
Despite today’s healthy price drop, Ethereum is still in a bullish trend after it created the fresh November highs at $475 yesterday. Once this level is breached, ETH could be well on the way to breaking the $500 level once again.

ETH-USD Short Term Price Prediction
Looking ahead, if the buyers can regroup and push higher, the first level of resistance lies at $475. Above this, resistance is expected at $490, $500, and $511.
On the other side, if the selling continues beneath $460, additional support lies at $445, $439 (August 2018 Highs), $430, and $421.
There is some bearish divergence between the RSI and price action. As ETH makes a higher high, the RSI made a lower high to signal the divergence and a potential retracement incoming. Additionally, the Stochastic RSI is in overbought conditions and is primed for a bearish crossover signal.
ETH/BTC – Buyers Fail To Overcome 200-days EMA
Key Support Levels: 0.0284 BTC, 0.0278 BTC, 0.0272 BTC.
Key Resistance Levels: 0.0295 BTC, 0.03 BTC, 0.0305 BTC.
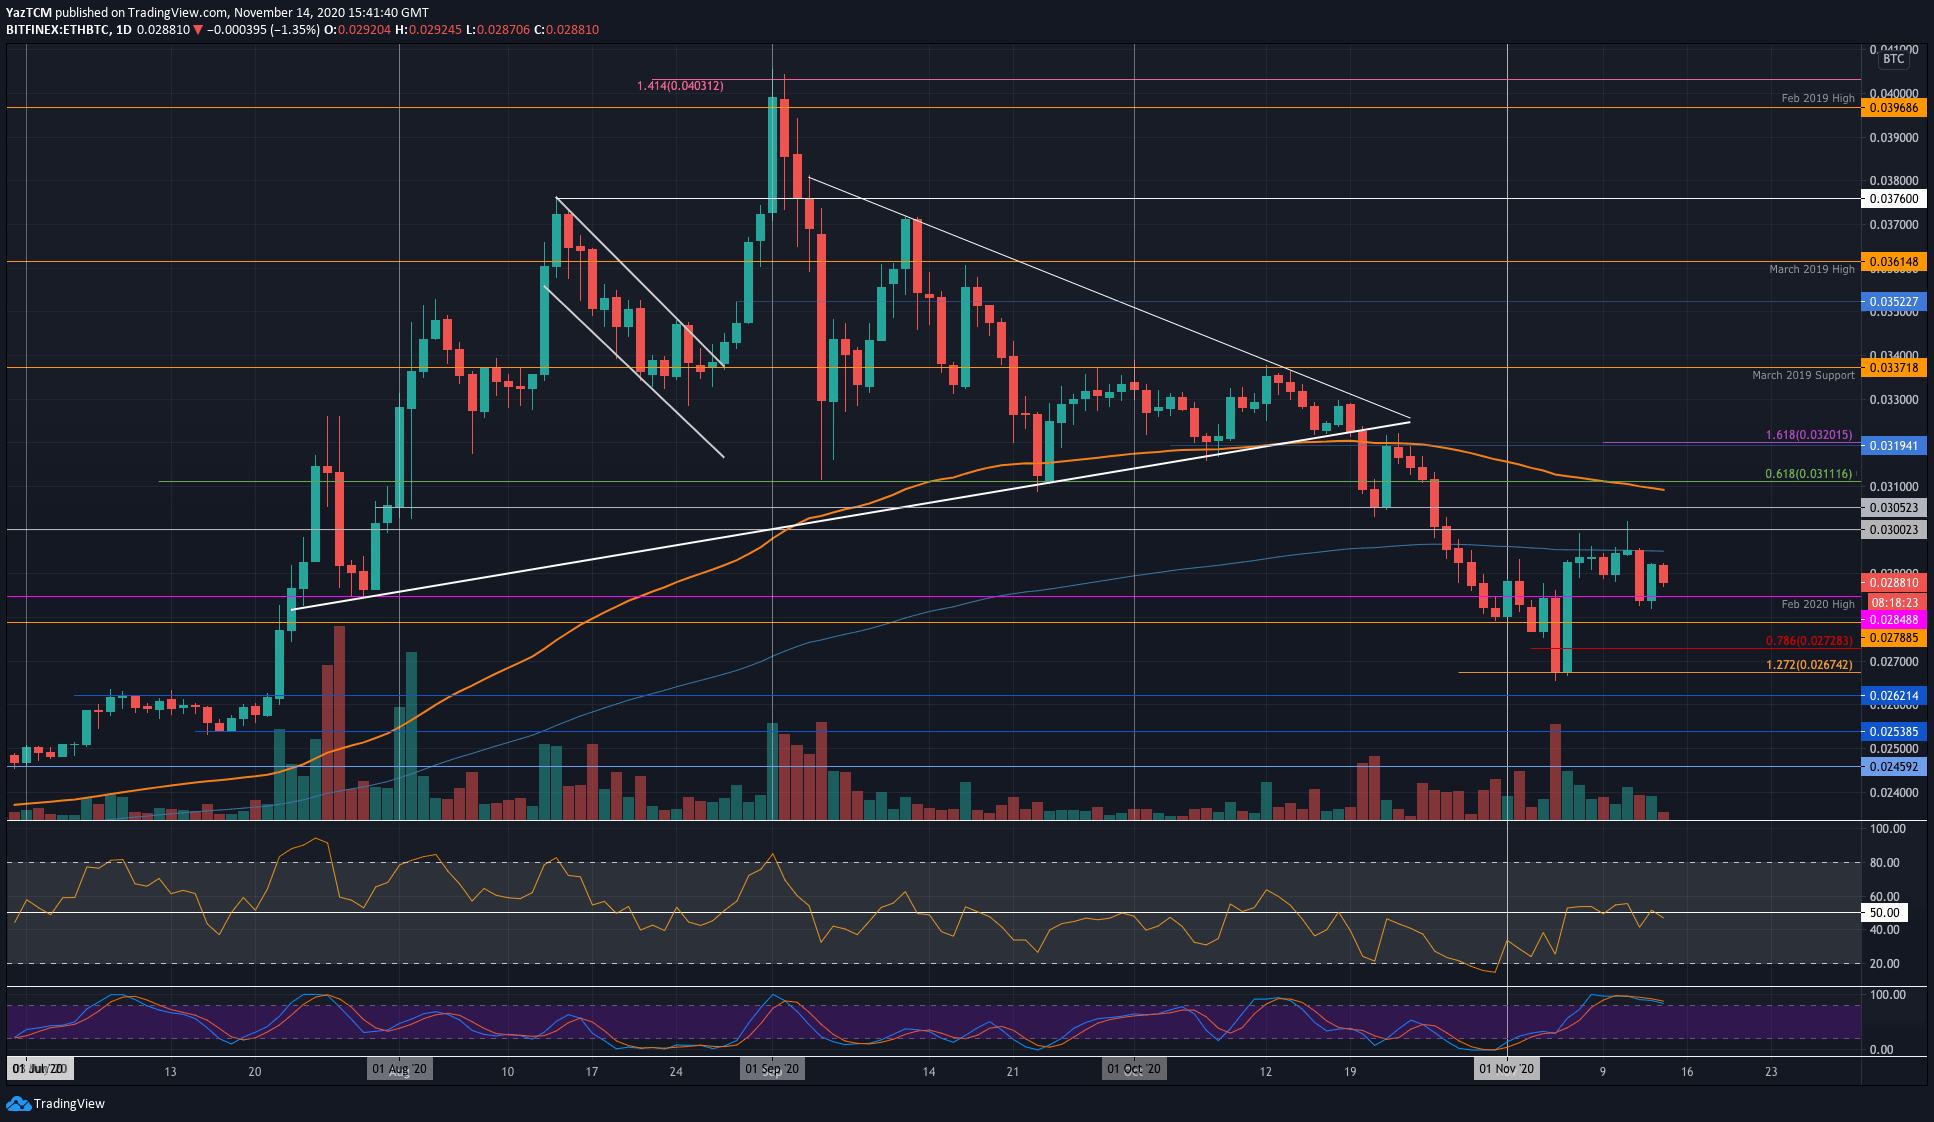
Against Bitcoin, ETH has struggled to break the resistance at the 200-days EMA so far during November. The coin recently headed to the support at 0.0284 BTC (Feb 2020 Highs) and rebounded yesterday.
After rebounding, ETH went on to climb above 0.029 BTC but has since dropped lower into the current 0.0288 BTC level.

ETH-BTC Short Term Price Prediction
Looking ahead, if the sellers push lower again, the first level of support lies at 0.0284 BTC (Feb 2020 High). Beneath this, support lies at 0.0278 BTC, 0.0272 BTC, and 0.0267 BTC (November lows).
On the other side, resistance first lies at 0.0295 BTC (200-days EMA). Above this, resistance is expected at 0.03 BTC, 0.0305 BTC, and 0.031 BTC (100-days EMA).
The RSI has struggled to break the mid-line to indicate that the buyers are struggling to take control over the market momentum. Additionally, the Stochastic RSI is also overbought and is primed for a bearish crossover signal.


