Ethereum Price Analysis: ETH Bulls Reclaim $1.6K, What Are The Next Targets?
ETH/USD – Bulls Start Recovery Above 20-day EMA
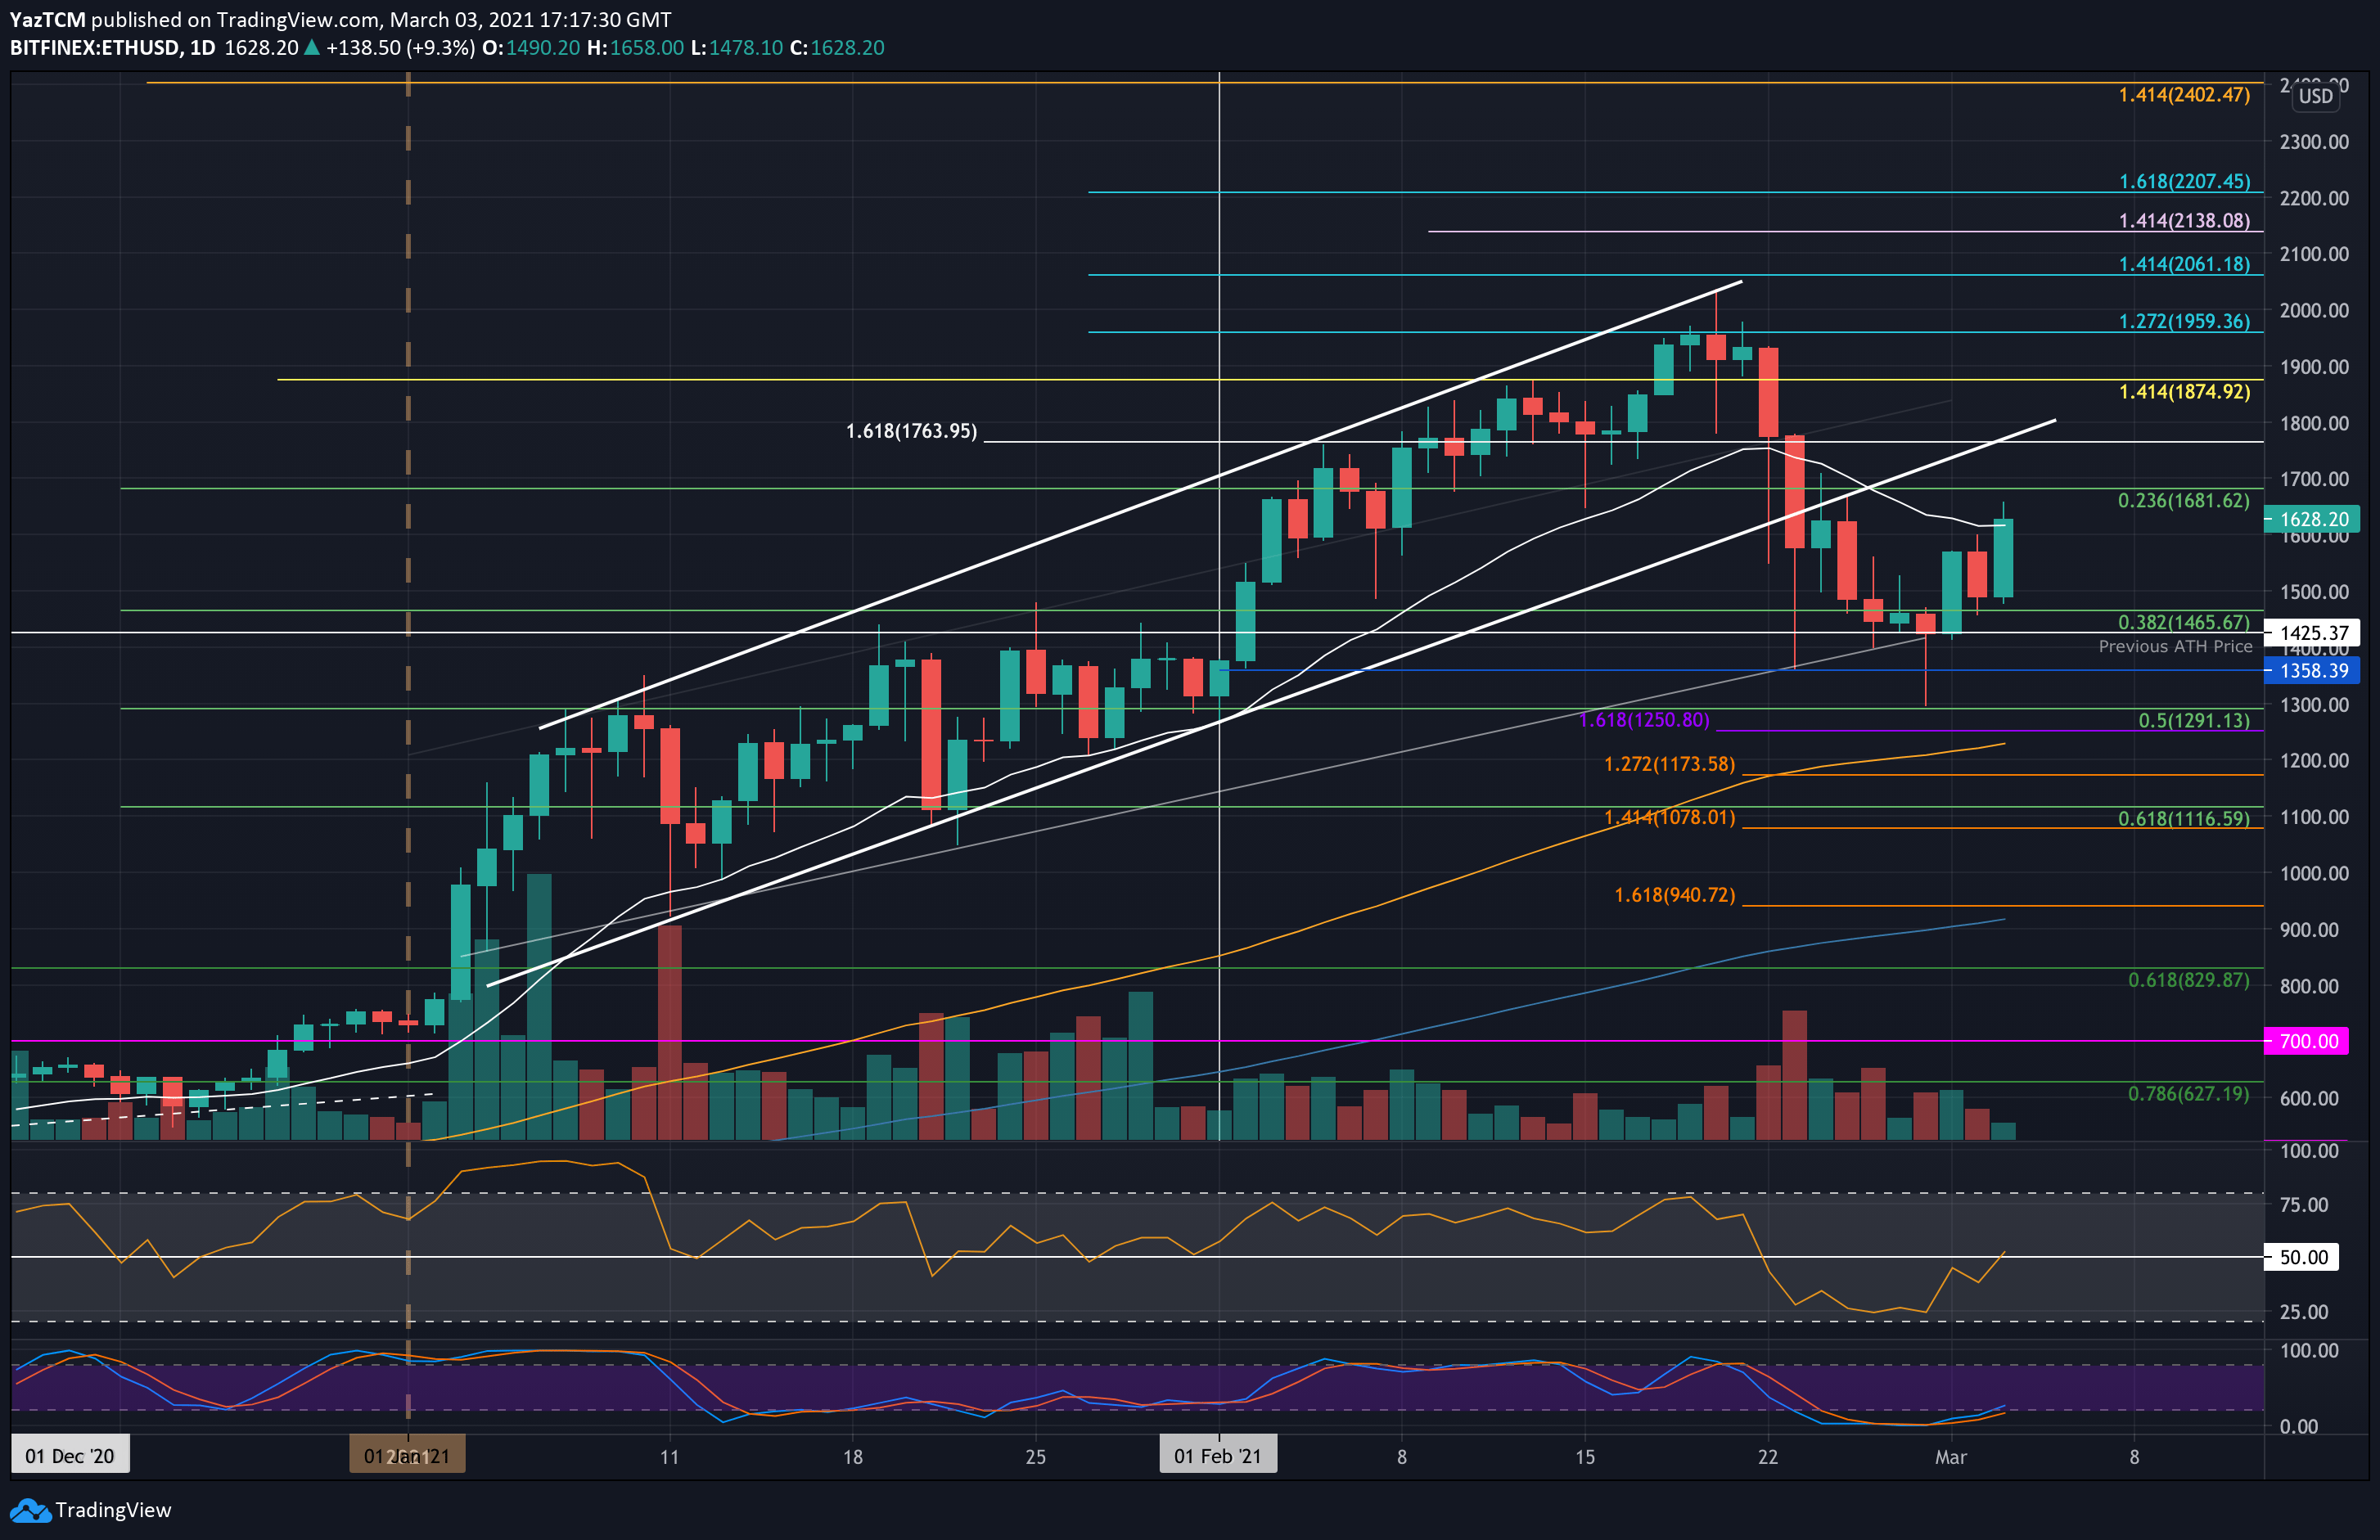
Key Support Levels: $1600, $1500, $1465.
Key Resistance Levels: $1700, $1764, $1800.
Ethereum is starting to recover from last week’s downtrend in which it fell from above $1900 to reach as low as $1290 (.5 Fib Retracement). The coin found solid support at $1425 over the past few days and started to push higher from there.
Today, the 7% price surge allowed Ethereum to bounce from $1500 and break above $1600 to reach as high as $1658. It is now trading above the 20-day EMA, which is a good sign that the retracement has been completed.
ETH-USD Short Term Price Prediction
Looking ahead, the first level of resistance lies at $1700. This is followed by $1764, $1800, and $1975 (1.414 Fib Extension – yellow). Additional resistance lies at $1960 (1.272 Fib Extension), $2000, and $2036 (ATH Price).
On the other side, the first support lies at $1600. This is followed by $1500, $1465 (.382 Fib), and $1425.
The daily RSI has now started to poke above the midline as the buyers attempt to gain control of the market momentum. Additionally, the Stochastic RSI is in the middle of producing a bullish crossover signal that indicates the buying pressure is increasing.
ETH/BTC – Bulls Break Above Descending Price Channel
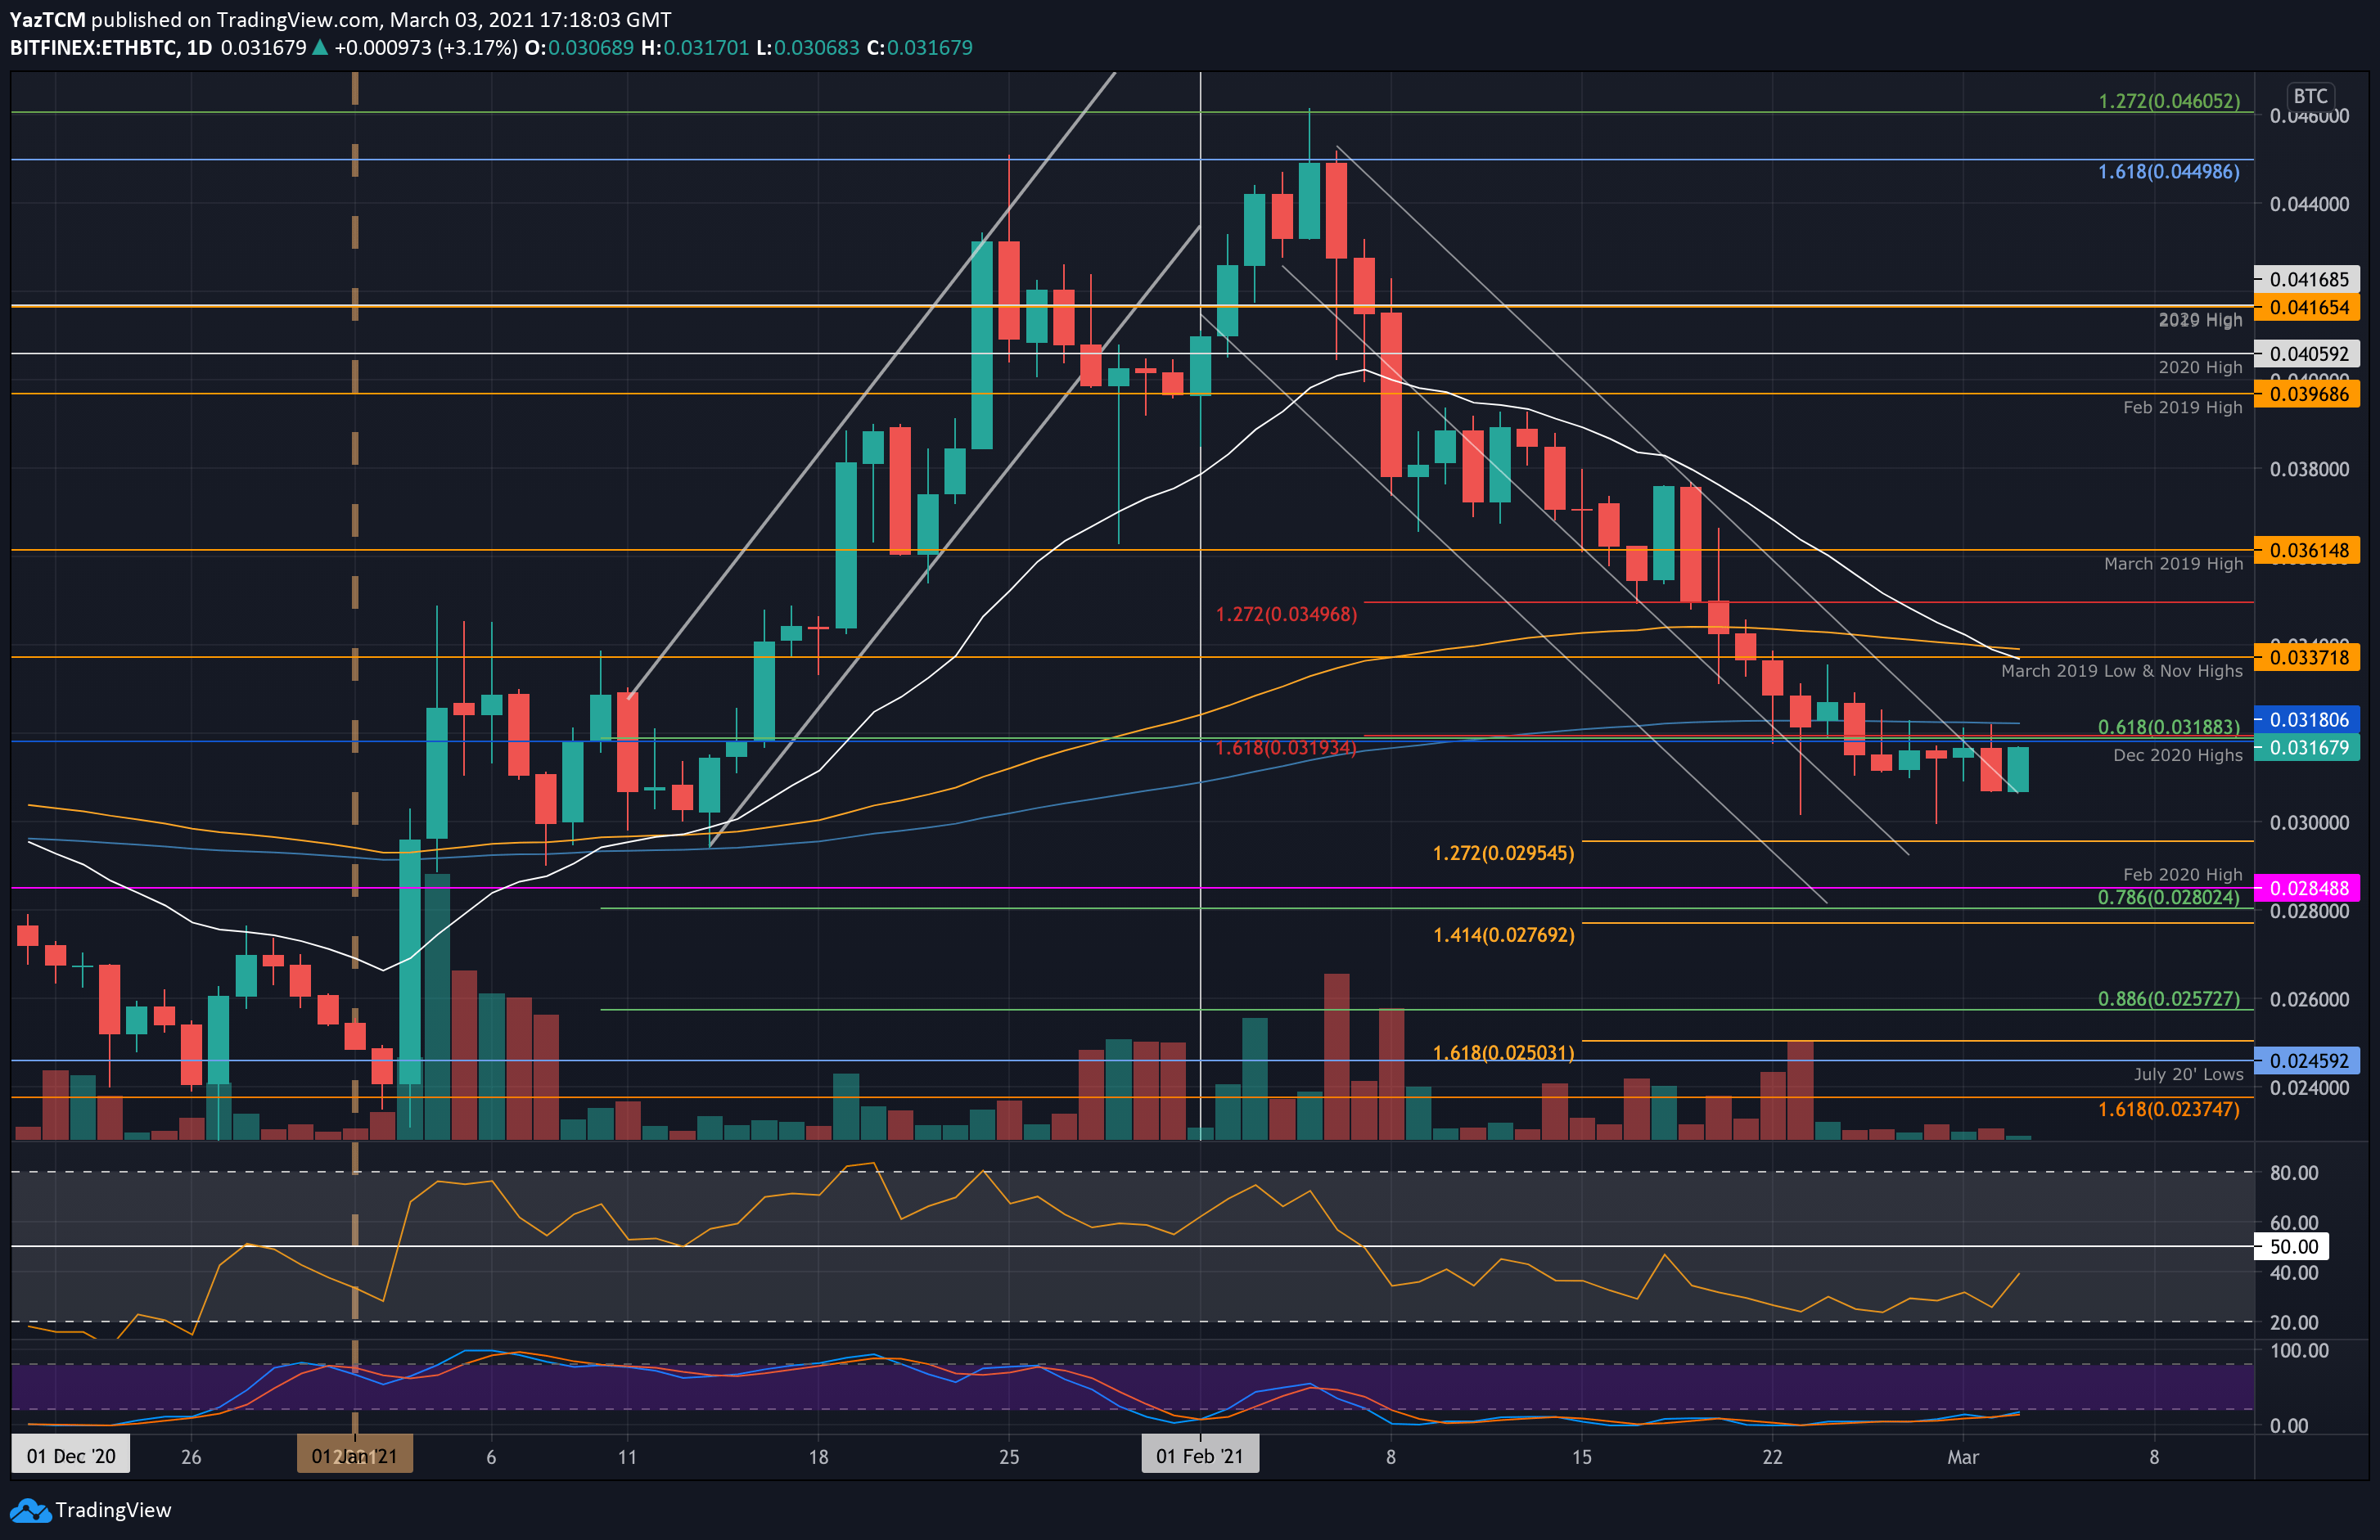
Key Support Levels: 0.0306 BTC, 0.03 BTC, 0.0295 BTC.
Key Resistance Levels: 0.0318 BTC, 0.0337 BTC, 0.035 BTC.
Against Bitcoin, Ethereum had been trading inside a descending price channel for the entire period of December. Yesterday, it dropped as low as 0.0306 BTC, but it quickly rebounded today to reach 0.0316 BTC.
The price hike today has also allowed ETH/BTC to break above the previous descending price channel, providing the first signal that the downtrend might be coming to an end. It now faces strong resistance at 0.0318 BTC (December 2020 Highs & 200-days EMA).
ETH-BTC Short Term Price Prediction
Looking ahead, the first resistance lies at 0.0318 BTC. This is followed by 0.337 BTC (Nov 2020 Highs & 100-days EMA), 0.035 BTC, and 0.0361 BTC (March 2019 High).
On the other side, the first level of support lies at 0.0306 BTC (yesterday’s low). This is followed by 0.03 BTC, 0.0295 BTC (downside 1.272 Fib Extension), and 0.0285 BTC (Feb 2020 Highs).
The Daily RSI has started to show an uptick, indicating the previous bearish momentum might be starting to fade. It will still need to rise further and break above the midline to indicate the bulls are in charge again.