Ethereum Price Analysis: ETH Breaks Above The Crucial MA-200, Soon To Reach $200?
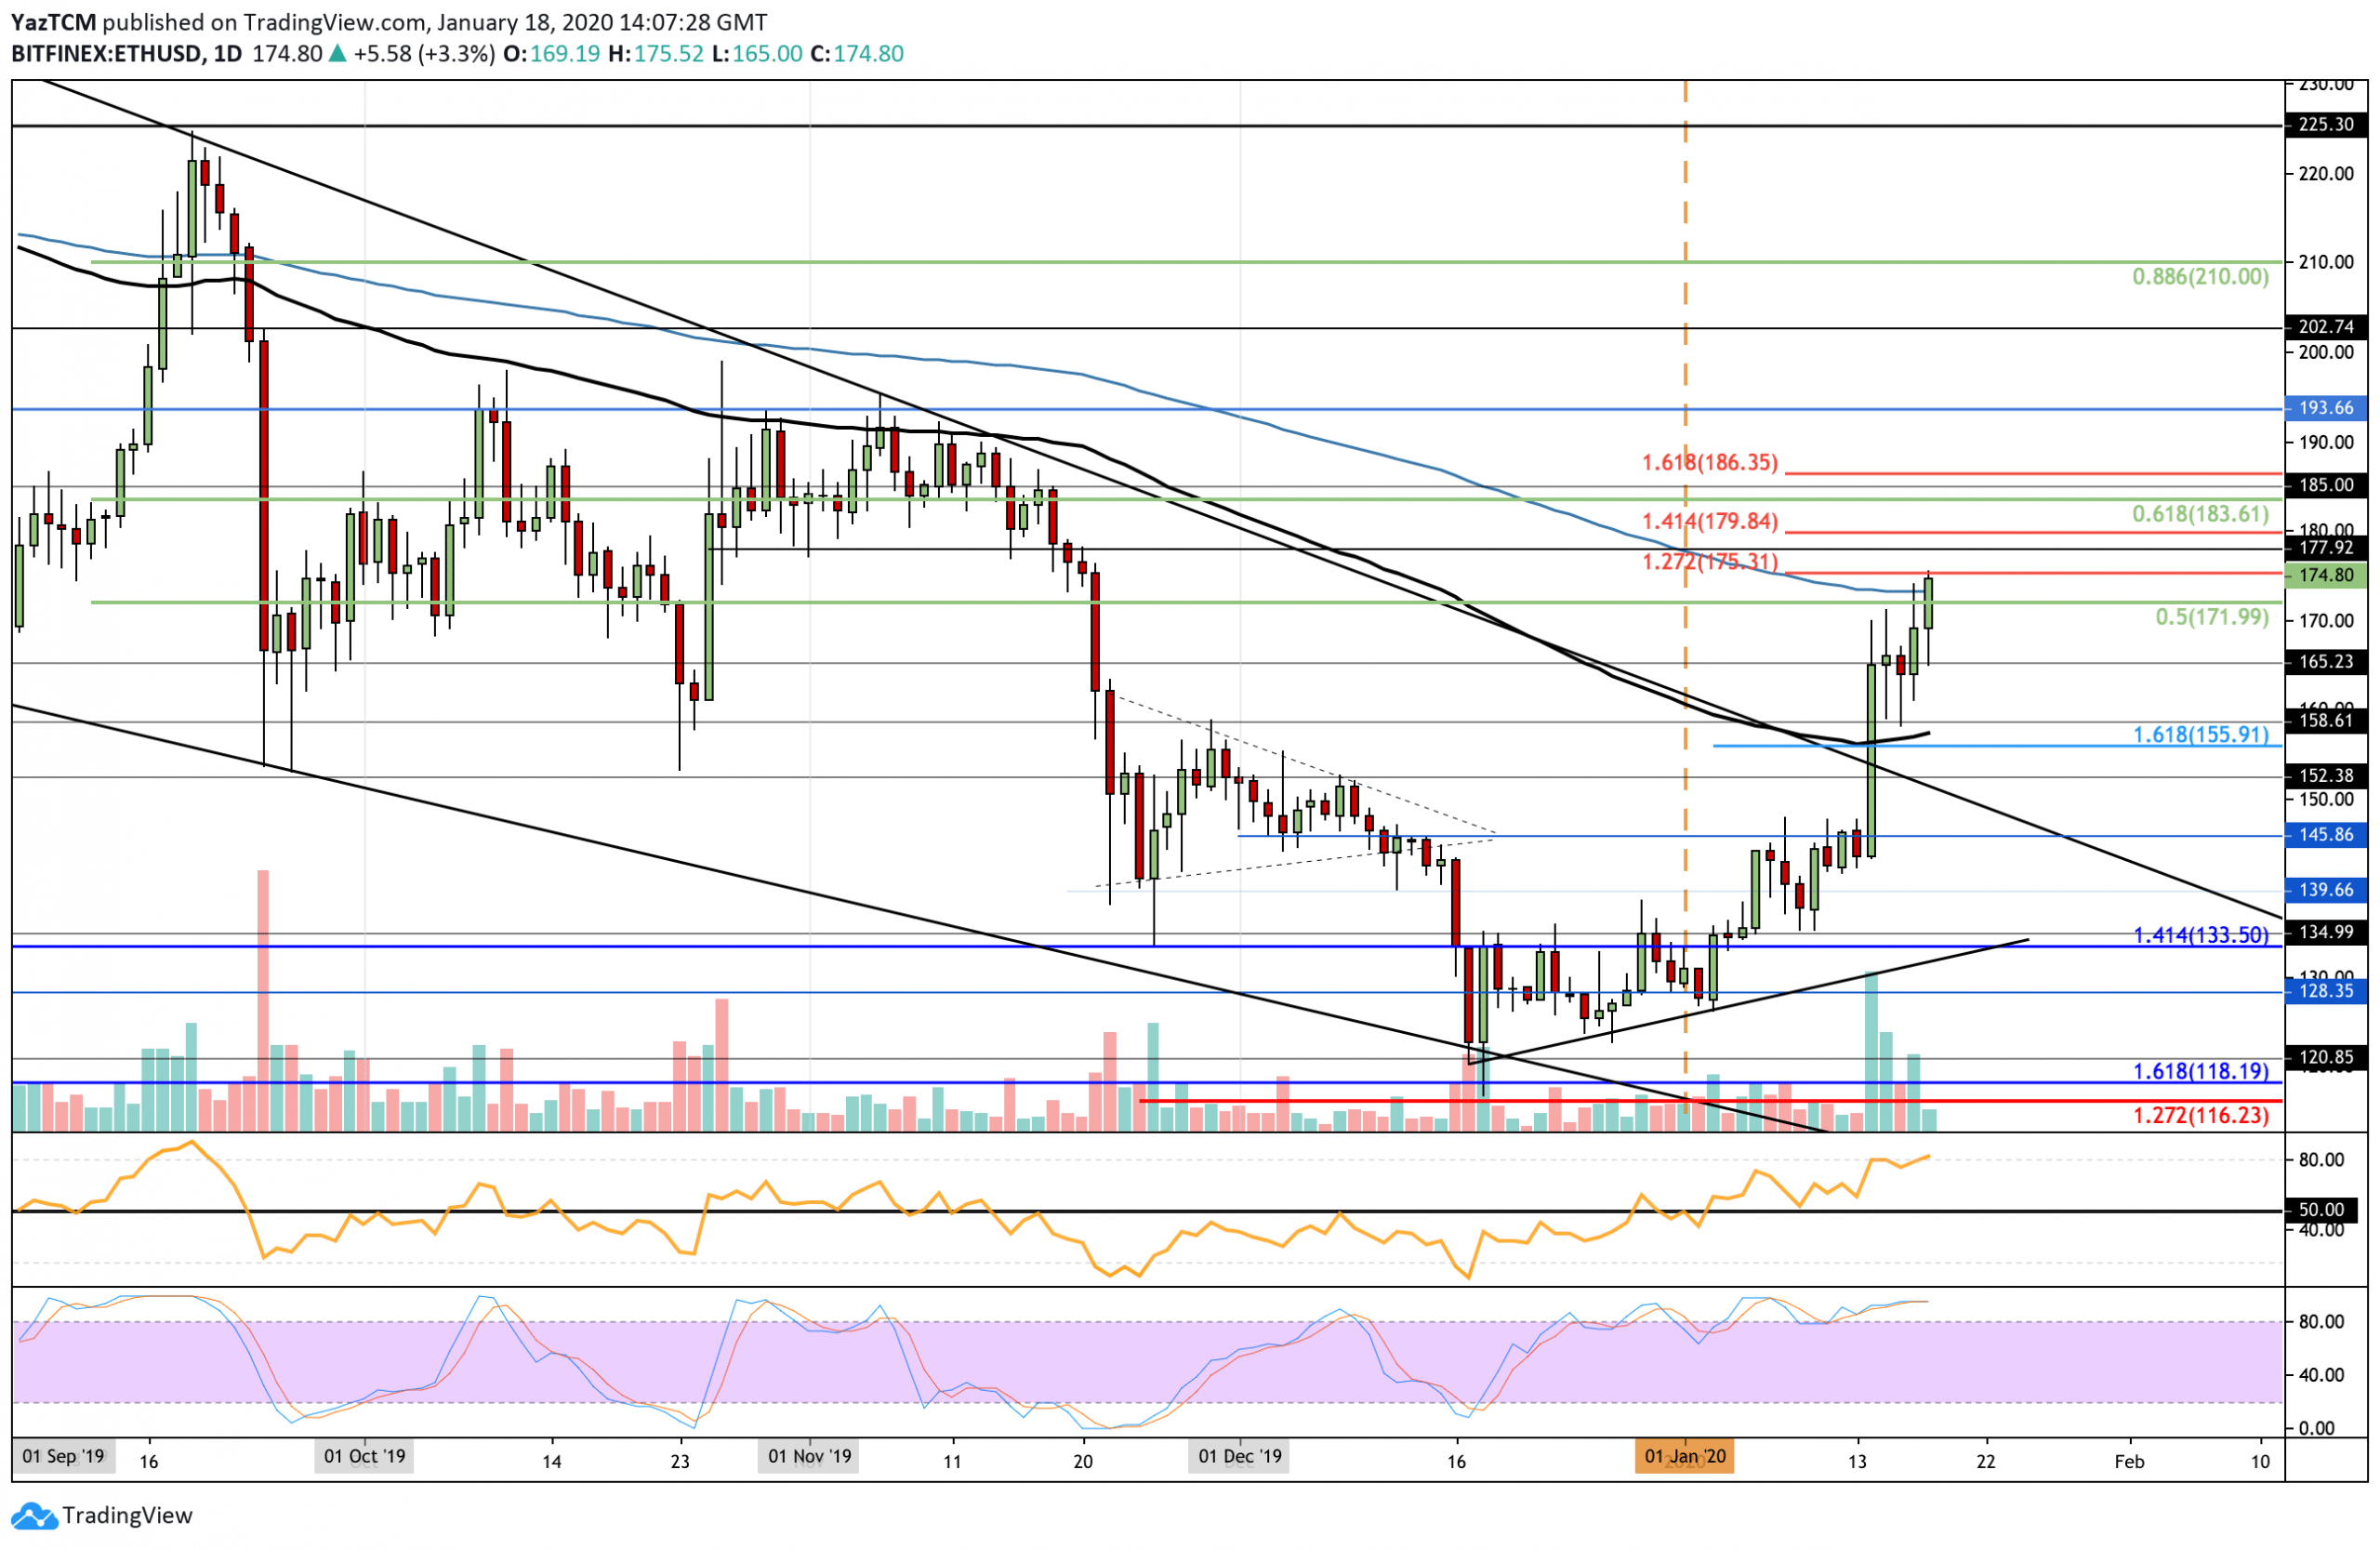
- Ethereum saw an incredible 21% price surge this week, bringing the price for the coin up toward $175.
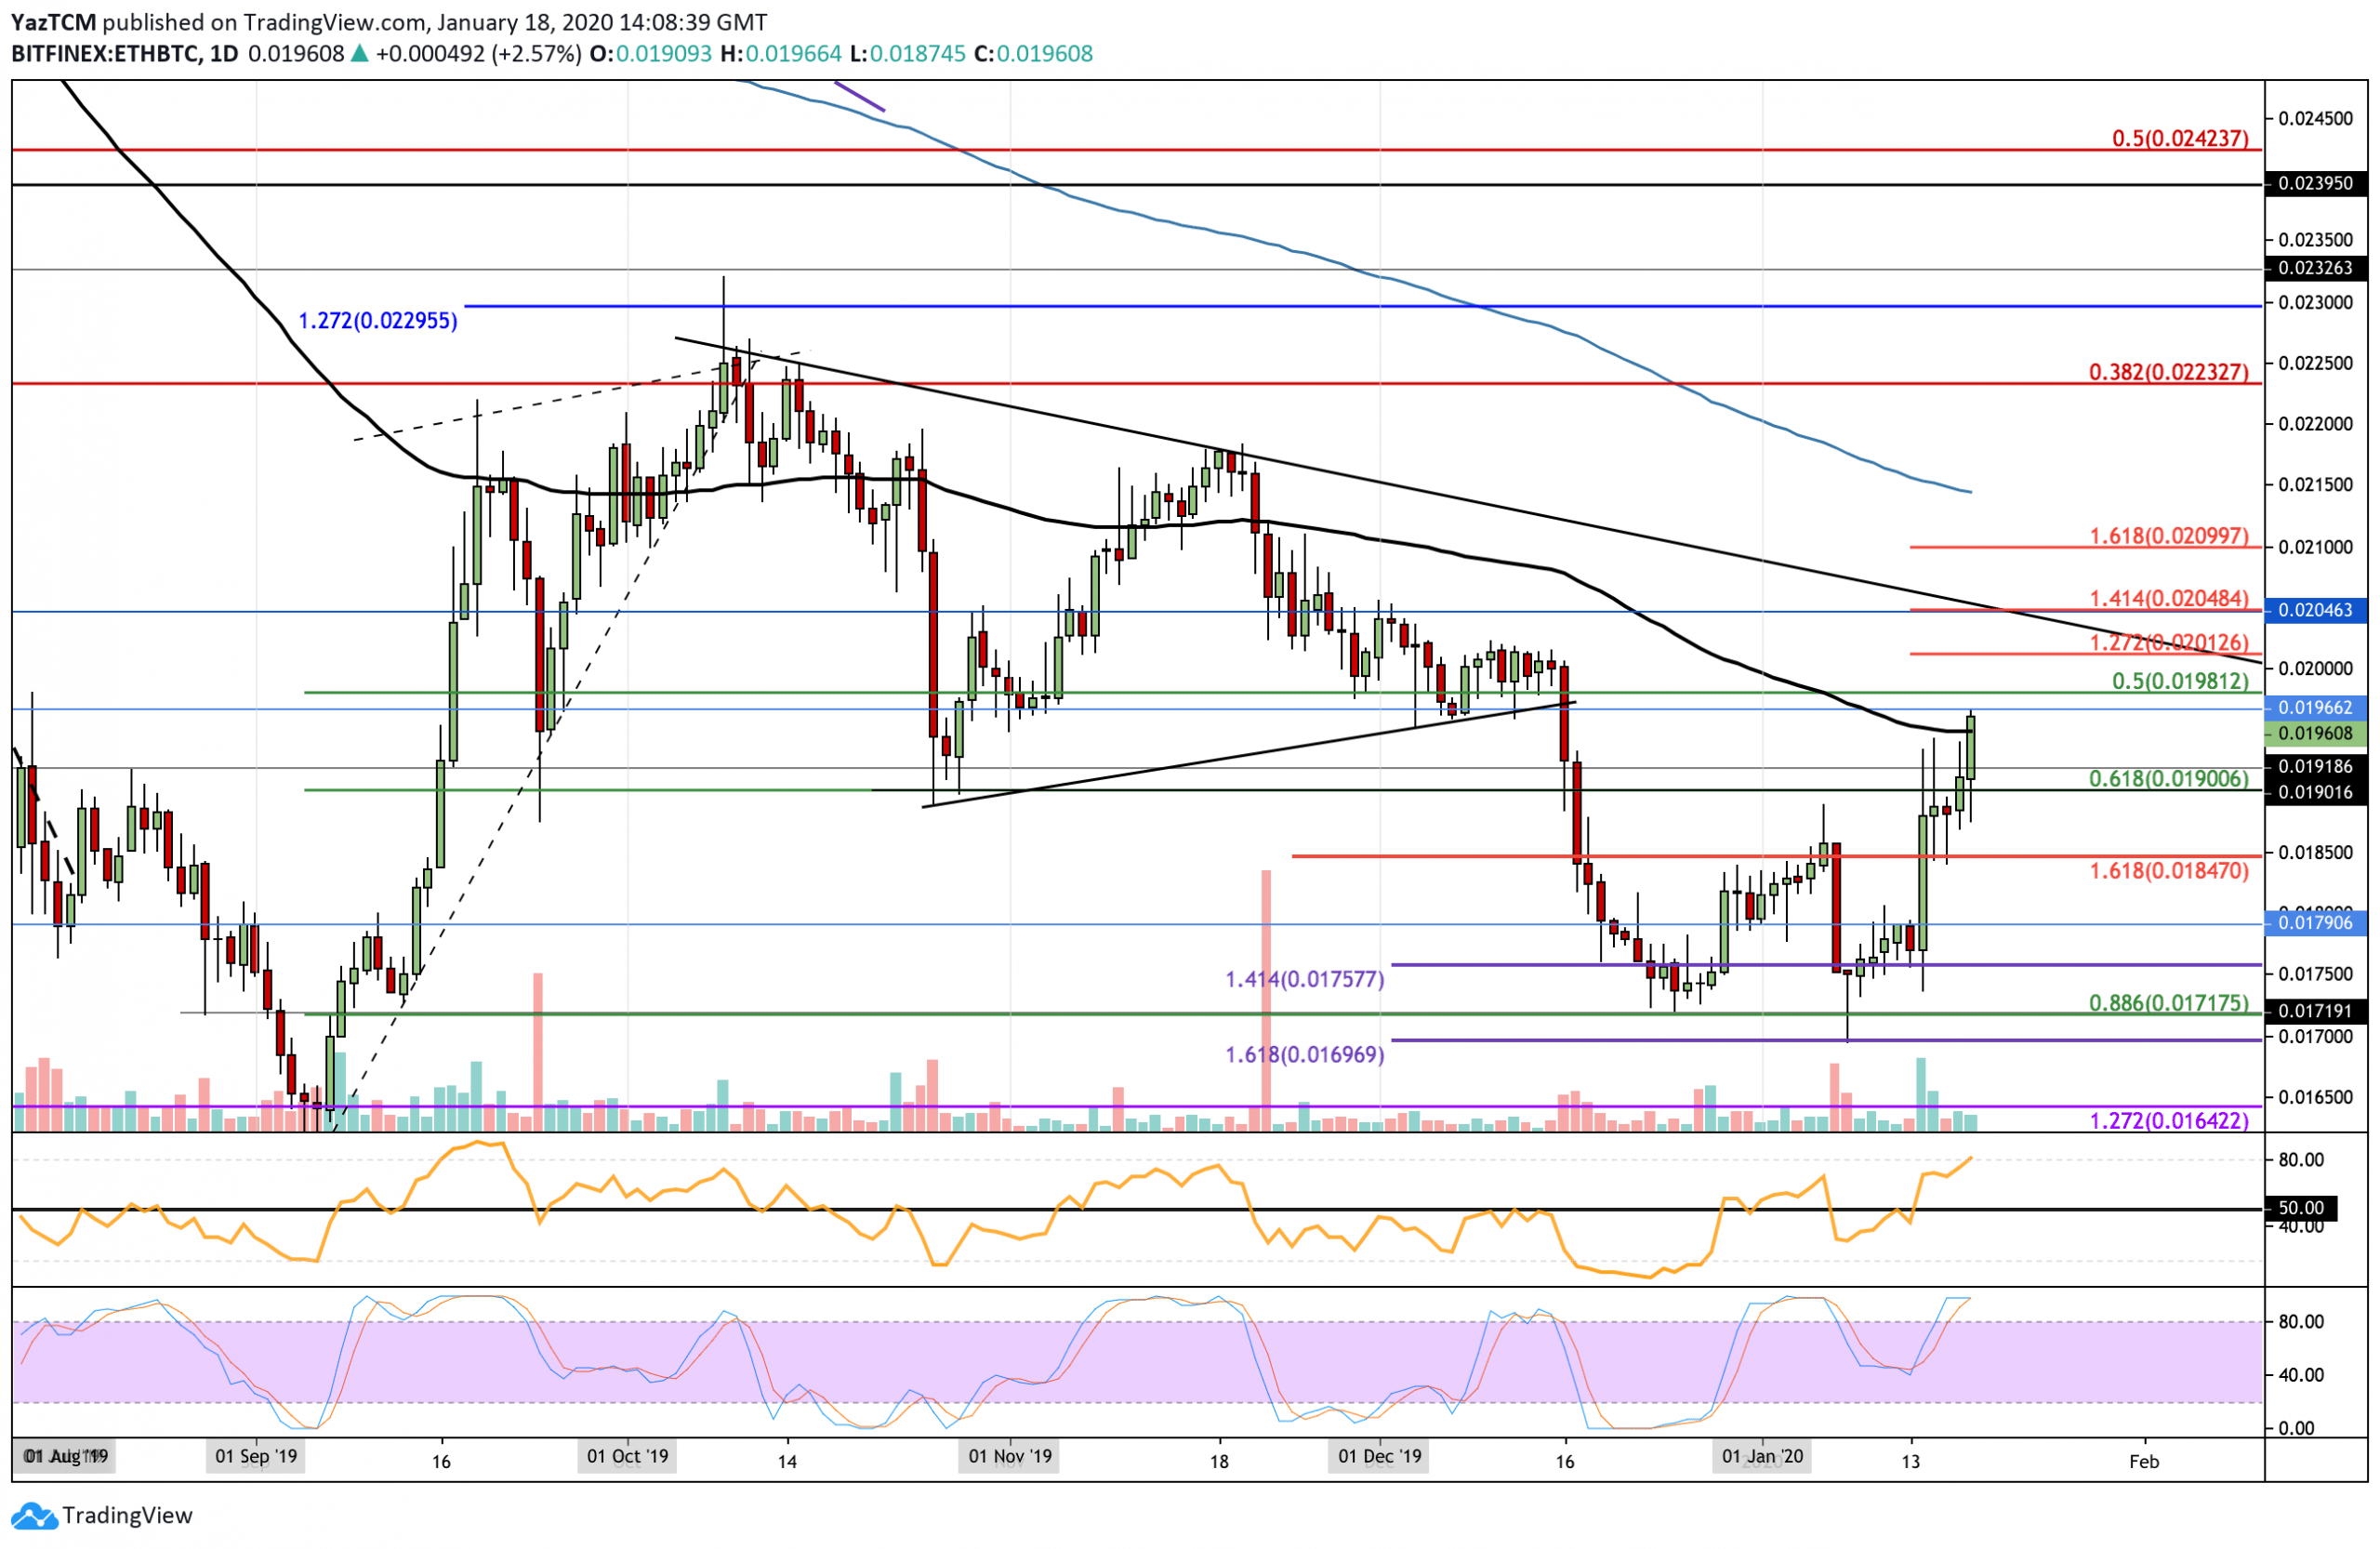
- Against BTC, ETH climbed further higher to meet resistance at the 100-days EMA.
- Ethereum has now turned bullish after breaking above the December 2019 high at $152.
Key Support & Resistance Levels
ETH/USD
Support: $165, $155, $145, $133.50.
Resistance: $175, $180, $186, $194.
ETH/BTC:
Support: 0.019 BTC, 0.0185 BTC, 0.0171 BTC.
Resistance: 0.0196 BTC, 0.020 BTC, 0.0204 BTC.
ETH/USD: ETH Shoots Above 200-days EMA – Are We Gearing Up Toward $200?

Since our last analysis, ETH went on to find brief resistance at the $145 level. However, on January 14, this all changed as it surged by a total of 16% to break above the December 2019 high and the 100-days EMA. Ethereum went on to climb higher from here as it broke above the 200-days EMA in today’s trading session to reach the current trading level of $178.
Ethereum is now undoubtedly within a bullish trading condition. If the cryptocurrency would drop back beneath $155, then it would be considered as neutral with a further drop beneath $133.50, turning the market bearish.
Ethereum Short Term Price Prediction
If the buyers continue to drive Ethereum above $178, immediate higher resistance lies at $180 (1.414 Fibonacci Extension level). Above this, higher resistance lies at $184.60, $186.35 (1.618 Fib Extension), $194, and $200.
Alternatively, if the sellers regroup and start to push Ethereum lower, the first level of support can be expected at $174 (provided by the 200-days EMA). Beneath this, additional support is located at $170, $165, and $156 (100-days EMA).
The RSI is in extremely overbought conditions. However, it is essential to note that during parabolic shifts, the RSI can remain in extremely overbought territory for extended periods. For a first sign that the bulls are losing steam, look for the RSI to drop slightly from the current extreme overbought conditions.
ETH/BTC: ETH Climbs Above 100-Days EMA But Will We Break 0.02 BTC?

Against Bitcoin, ETH went on to rebound from the support at 0.0175 BTC, which allowed ETH to surge much higher as it reaches the resistance at 0.0196 BTC. Ethereum has now created a fresh 2020 high but must break above the resistance at 0.0204 BTC (December highs) to confirm any form of long term bullish trend.
ETH managed to break above the 100-days EMA in today’s trading session. However, the candle has not yet closed to confirm this. For Ethereum to return to a neutral trend, it must fall beneath the support at 0.0185 BTC. If ETH were to drop beneath the support at 0.0171 BTC, the market would then be considered as bearish.
Ethereum Short Term Price Prediction
If the bulls continue to push ETH above 0.0196 BTC, the next level of strong resistance is located at 0.0198 BTC and 0.02 BTC. Above this, higher resistance lies at 0.0201 BTC (1.272 Fib Extension) ad 0.0204 BTC (1.414 Fib Extension and descending trend line resistance). Beyond 0.0204 BTC, resistance lies at 0.0209 BTC and 0.0215 BTC (200-days EMA). Alternatively, if the sellers push the market lower, initial support lies at 0.018 BTC. Beneath this, additional support lies at 0.0185 BTC and 0.0179 BTC.
The RSI has recently approached overbought conditions, which shows that the bulls are in complete control over the market momentum at this time. However, the Stochastic RSI is shaping up for a bearish crossover signal that could push the market lower.
The post Ethereum Price Analysis: ETH Breaks Above The Crucial MA-200, Soon To Reach $200? appeared first on CryptoPotato.


