Ethereum Price Analysis: ETH Breaking ATH Surpassing $2200, What Are The Next Targets?
ETH/USD – Bulls Set New Highs Above $2200
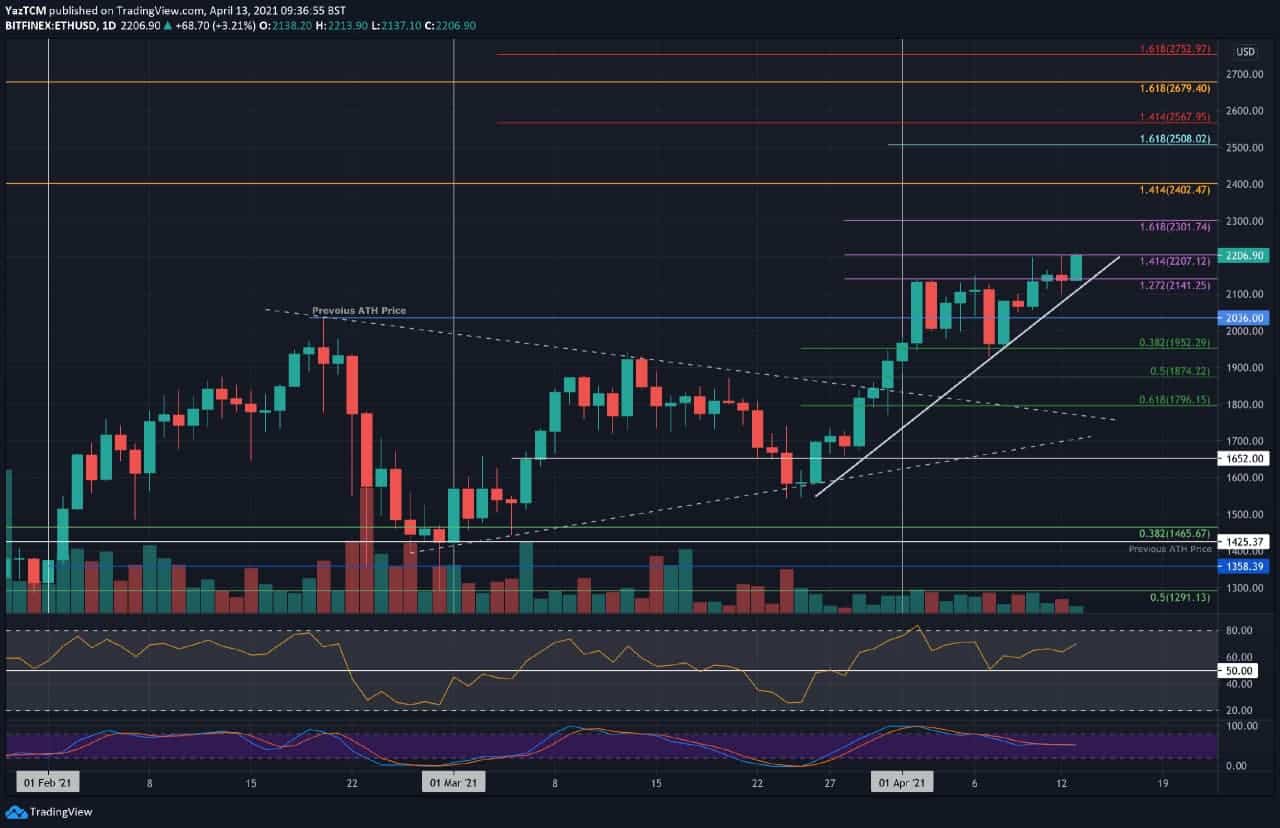
Key Support Levels: $2140, $2100, $2036.
Key Resistance Levels: $2200, $2300, $2400.
Ethereum managed to set a new ATH price yesterday at $2200 on Bitstamp. However, the cryptocurrency ended up closing the day beneath $2140. Today, however, the bulls regrouped for another leg up and charted a fresh ATH slightly above that – at $2214 on Bitstamp.
The coin had pushed higher from $1950 at the start of the month as it battled with resistance at $2141 (1.272 Fib Extension). The market finally penetrated this resistance over the weekend as ETH pushed above $2150 and spiked to the new ATH above $2200, where it met resistance at a 1.414 Fib Extension.
A daily candle closing above $2200 would be needed for Ethereum to continue higher toward $2300.
ETH-USD Short Term Price Prediction
Moving forward, if the bulls break resistance at $2200, the first level of higher resistance lies at $2300 (1.618 Fib Extension). This is followed by $2400 (1.414 Fib Extension – orange), $2500 (1.618 Fib Extension – blue), and $2567.
On the other side, the first support lies at $2140. This is followed by $2100, $2036, $2000, and $1950 (.382 Fib).
The RSI is in the bullish favor and is not near overbought conditions. The RSI would need to push higher for the bullish momentum to be able to create new highs above $2200.
ETH/BTC – Market Sees Rangebound Price Action
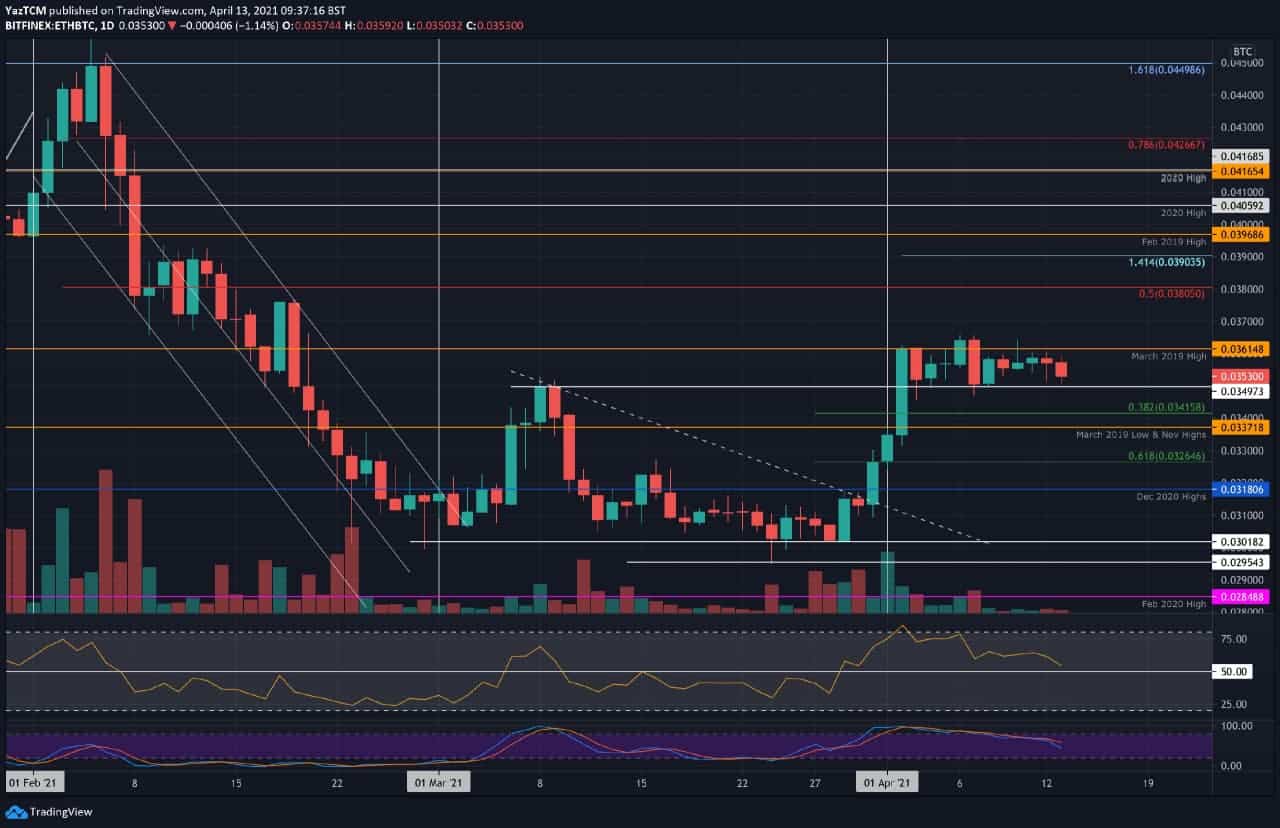
Key Support Levels: 0.0349 BTC, 0.0341 BTC, 0.0337 BTC.
Key Resistance Levels: 0.0361 BTC, 0.037 BTC, 0.038 BTC.
Ethereum pushed higher from 0.0326 BTC at the start of the month to meet the resistance at 0.0361 BTC (March 2019 Highs). Since reaching this resistance, the market has been rangebound between there and the support at 0.0349 BTC.
It did briefly spike above this resistance on April 6th as it hit as high as 0.0365 BTC. However, this was short-lived as ETH returned into the range on the following day. A breakout of this range would be needed to dictate the next trading direction.
ETH-BTC Short Term Price Prediction
Looking ahead, if the buyers break resistance at 0.0361 BTC, the first level of strong resistance lies at 0.037 BTC. This is followed by 0.038 BTC (bearish .5 Fib), 0.039 BTC (1.414 Fib Extension), 0.04 BTC (Feb 2019 highs), and 0.0405 BTC (2020 highs).
On the other side, the first support lies at the lower boundary of the current range at 0.0349 BTC. This is followed by 0.0341 BTC (.382 Fib), 0.0337 BTC (Nov 2020 highs), 0.0326 BTC (.618 Fib), and 0.0318 BTC (Dec 2020 Highs).
The RSI has been falling throughout April, indicating fading bullish momentum. It would need to rebound from the midline for any hope of Etheruem breaking the upper boundary of the range. Otherwise, it is likely to fall beneath the current range.