Ethereum Price Analysis: ETH Breaches $250, Is $300 In Sight?
Ethereum has seen another 2.43 percent price increase over the past 24 hours which has allowed the cryptocurrency to climb back above the $250 level to where it currently trades at around $152. Despite the recent price declines, Ethereum is still up by a total of 21 percent over the past week and by 42 percent over the past 30 trading days.
Ethereum sits in 2nd place amongst the top cryptocurrencies by market cap value as it presently holds a $26.17 billion market cap.
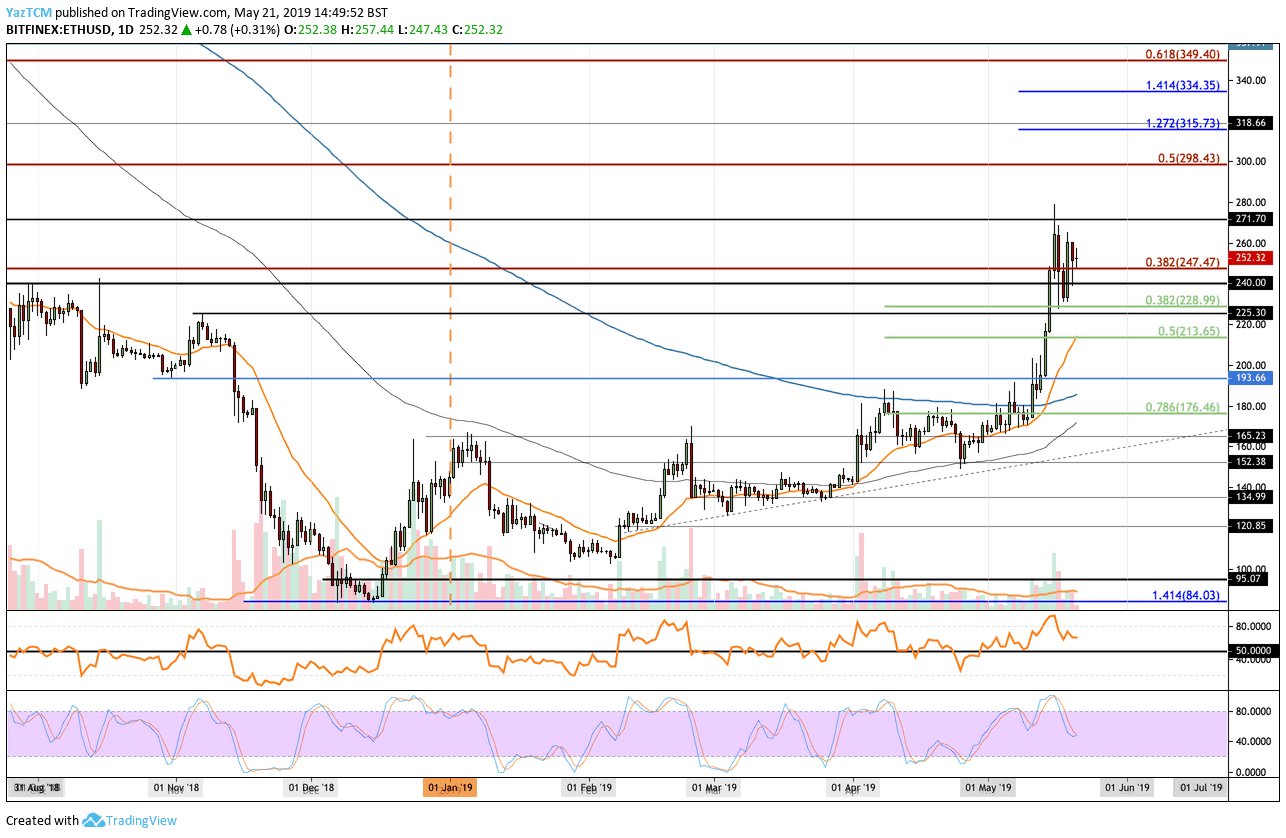
Looking at the ETH/USD 1-Day Chart:
- Since our previous ETH/USD analysis, we can see that ETH/USD was unable to overcome the resistance at $271 and proceeded to fall into support around the $228 area before rebounding back above $250.
- From above: The nearest level of resistance now lies at $271. If buyers can cause ETH/USD to climb above $280, higher resistance is then located at $298 – $300 which is provided by a bearish .5 Fibonacci Retracement level. Above $300, further resistance is found at $315, $334 and $349.
- From below: The nearest level of support now lies at $250 – $247. Beneath this, further support can be located at $240, $225, $213 and $200. Further support beneath $200 can be found at $193 and $176.
- The trading volume has dropped significantly over the past few days.
- The RSI suggests that the previous bullish pressure is fading as it’s heading toward 50.
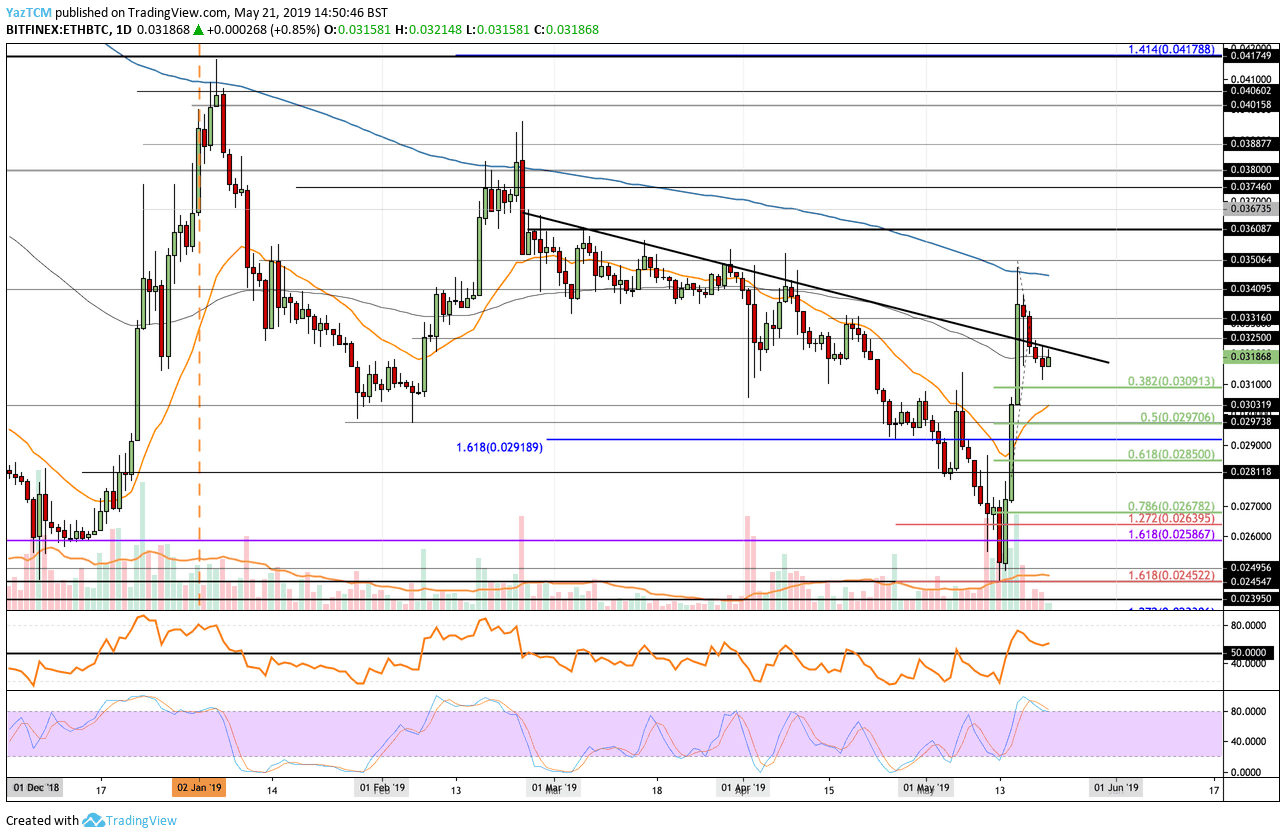
Looking at the ETH/BTC 1-Day Chart:
- Against Bitcoin, we can see that ETH/BTC had met resistance around the 0.035 BTC level which contains the 200 day moving average line and fell lower. ETH/BTC is now currently trading at 0.03186 BTC.
- From above: The nearest levels of resistance now lie at 0.0325 BTC, 0.03316 BTC, 0.034 BTC, and 0.035 BTC. If bulls can break above the resistance at 0.035 BTC then higher resistance can be located at 0.036 BTC and 0.0374 BTC.
- From below: The nearest level of support now lies at 0.031 BTC and 0.030 BTC. Beneath 0.03 BTC, further support can be found at 0.0297 BTC, 0.02918 BTC, 0.0285 BTC, and 0.027 BTC.
- The trading volume has also significantly dropped in ETH/BTC over the past few days.
- The Stochastic RSI is suggesting that a retracement may be imminent as it produces a bearish crossover signal in overbought territory.
The post Ethereum Price Analysis: ETH Breaches $250, Is $300 In Sight? appeared first on CryptoPotato.