Ethereum Price Analysis: ETH Bears Resurface Below $240
- Ethereum saw a small 1.6% price drop today as the coin reached the $240 level.
- Earlier in the week, ETH hit the $250 level but was unable to overcome it, which caused it to fall to $240.
- Against Bitcoin, Ethereum has traded in a range between 0.026 BTC and 0.026 BTC this past week.
ETH/USD: Ethereum Bulls Retreat From $250
Key Support Levls: $240, $225, $215.
Key Resistance Levels: $250, $265, $274.
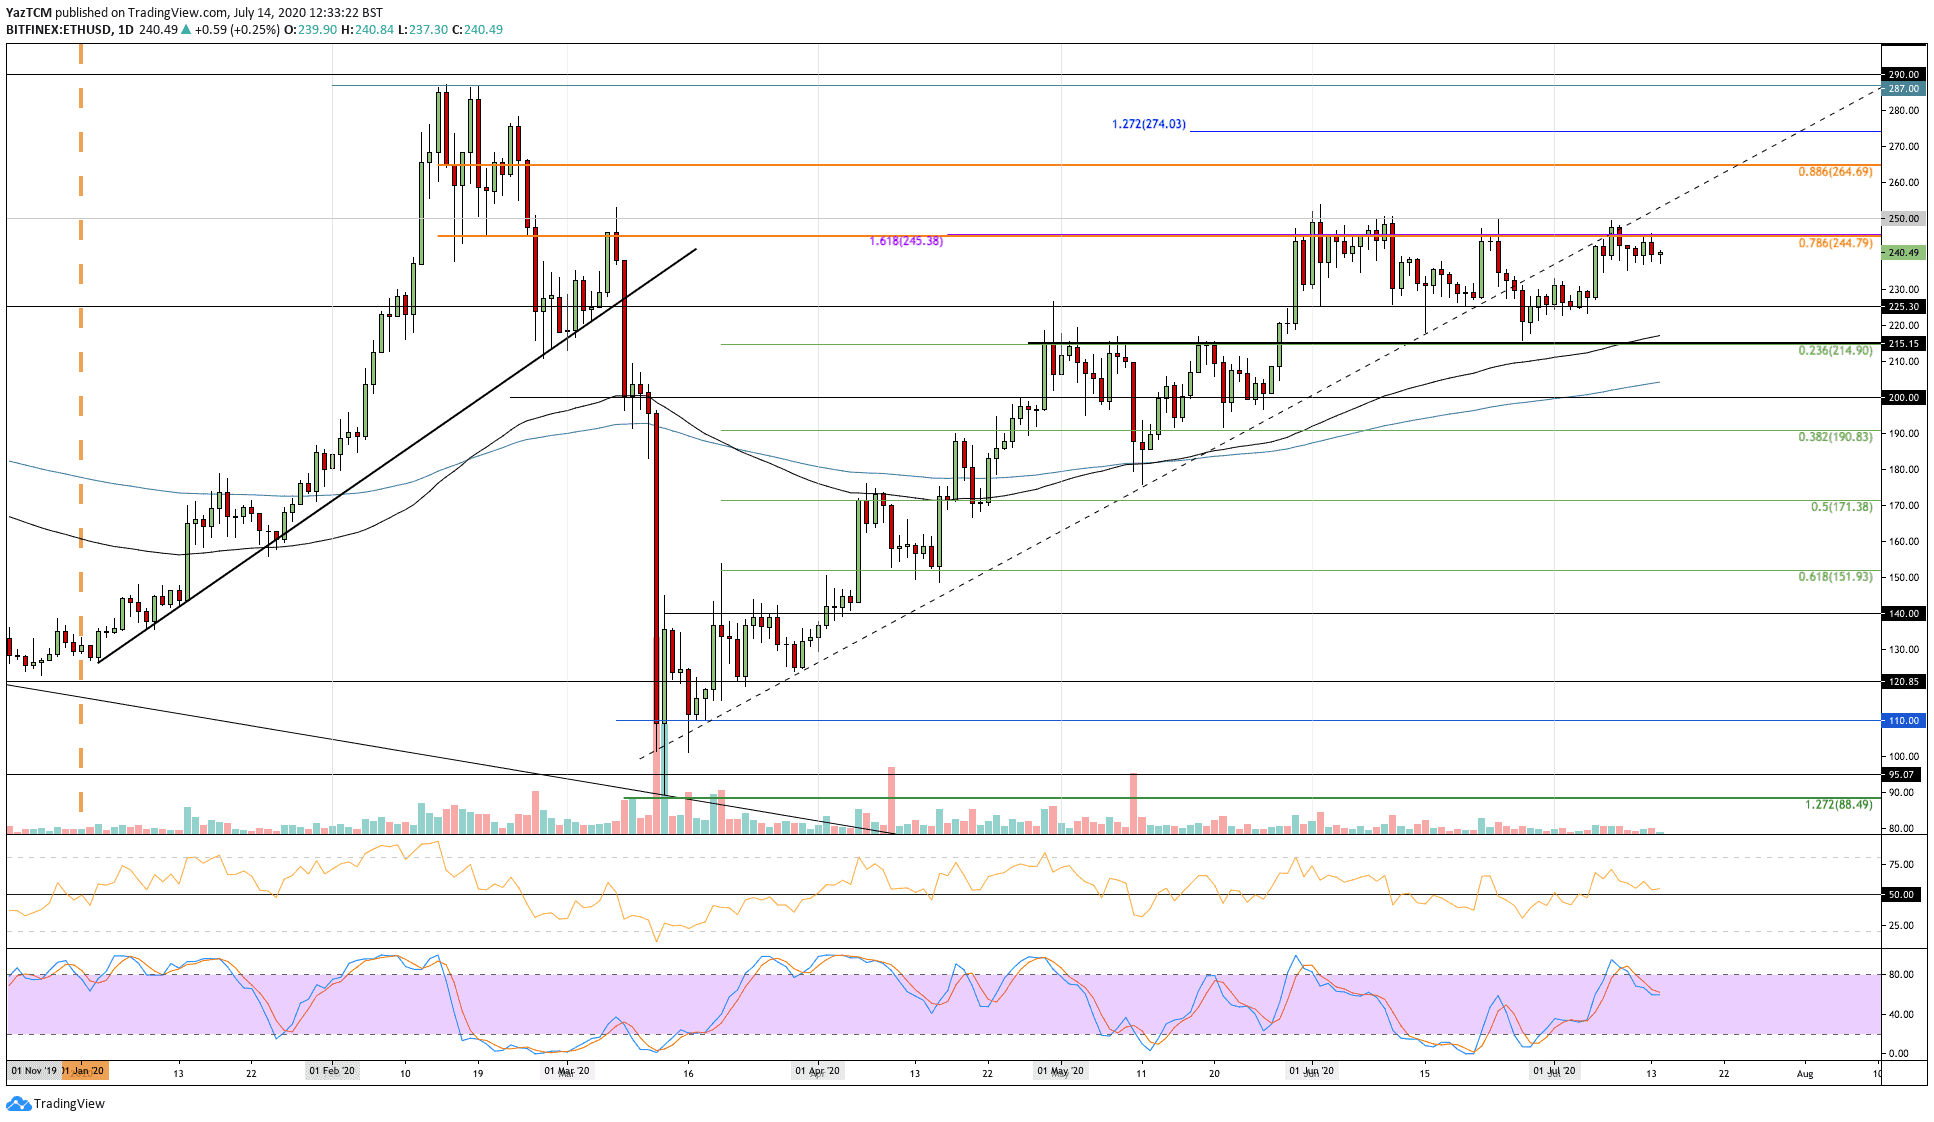
At the start of July, Ethereum bounced higher from the support at $225 to reach the resistance at $250 seven days ago. The buyers were unable to overcome this level as the price retreated to $240 today.
More specifically, over the past four days, ETH has struggled to break the resistance at $245, which is provided by a bearish .786 Fib Retracement. A break above $250 would kickstart a bull run for ETH back toward the 2020 highs at $287.
ETH-USD Short Term Price Prediction
Looking ahead, if the bulls break $245 and pass $250, higher resistance is expected at $265 (bearish .886 Fib Retracement). This is followed by added resistance at $274 and $287.
Alternatively, if the sellers push beneath $240, strong support is found at $225. Beneath this, added support lies at $215 (100-days EMA & .236 Fib Retracement) and $200.
The RSI is above the 50 line, but it is falling, which suggests that the bullish momentum is fading. However, so long as the RSI can remain above the 50 line, ETH can be expected to remain bullish in the short term.
ETH/BTC: Buyers Struggling At 0.0263 BTC Resistance
Key Support Levls: 0.026 BTC, 0.0253 BTC, 0.025 BTC.
Key Resistance Levels: 0.0263 BTC, 0.0266 BTC, 0.027 BTC.
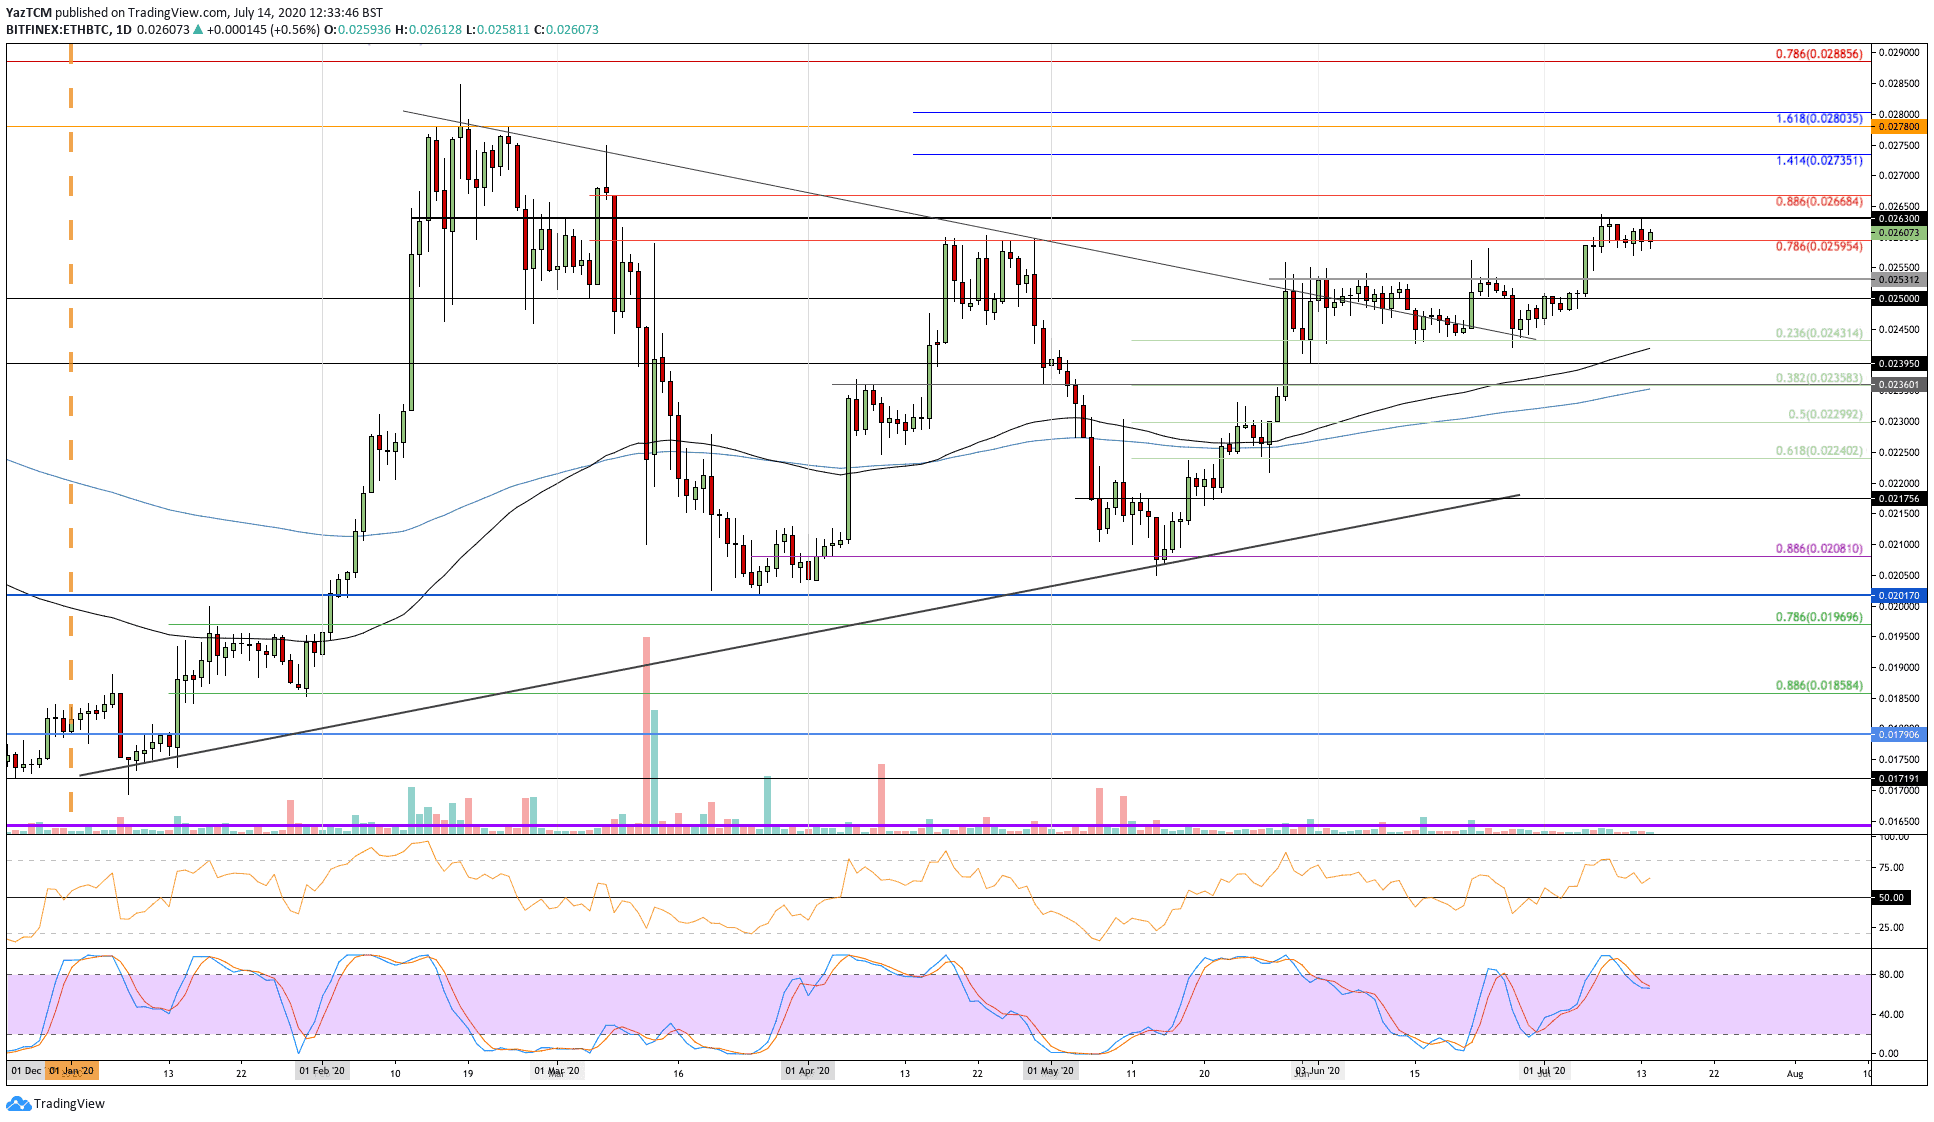
Against Bitcoin, ETH headed higher from 0.0253 BTC at the start of July until it reached the resistance at 0.0263 BTC last week. The coin has been unable to break this level during the week as it trades sideways between 0.0263 BTC and 0.0263 BTC.
A break above the 0.0263 BTC would create a fresh 4-month high for ETH and would allow the coin to head to the 2020 high at 0.0278 BTC.
ETH-BTC Short Term Price Prediction
Looking ahead, once 0.0263 BTC is conquered, added resistance lies at 0.0266 BTC (bearish .886 Fib Retracement), 0.0273 BTC (1.414 Fib Extension), and 0.0278 BTC.
On the other hand, the first level of support lies at 0.026 BTC. Beneath this, added support is found at 0.0253 BTC, 0.025 BTC, and 0.0242 BTC (.236 Fib Retracement).
The RSI is still above the 50 line for ETH/BTC, which suggests that the buyers are in complete control of the market momentum.
The post Ethereum Price Analysis: ETH Bears Resurface Below $240 appeared first on CryptoPotato.


