Ethereum Price Analysis: ETH Back Below $170 But Is The Bleeding Over?
Etheruem followed in the footsteps of Bitcoin this week as the cryptocurrency dropped by as much as 21%. The latest price fall caused ETH to drop back to $167, returning to support from late-August/early-September.
Ethereum has lost a total of 45% over the past 3 months which puts its market cap at $18.17 making it the second-largest cryptocurrency.
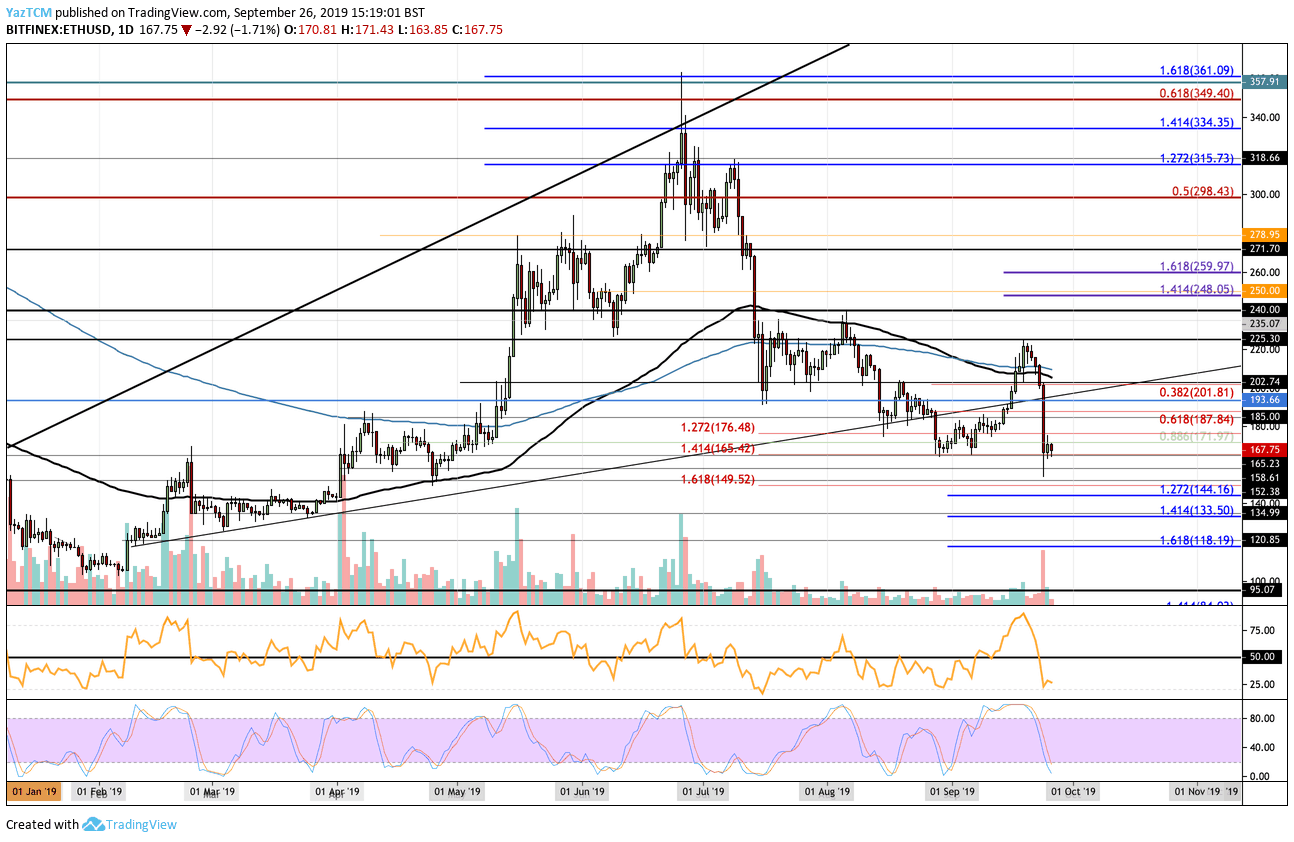
Looking at the ETH/USD 1-day chart:
- Since our previous ETH/USD analysis, the BTC bloodbath caused ETH to plummet beneath $200. ETH continued to drop until finding the current support at $165.42, where the decline stalled.
- From above: The nearest level of resistance lies at $171.97. Above this, resistance is found at $180, $187.84, $19, $193.66, and $200. If the bulls continue back above $200, resistance is found at $201.81, $210, $225, and $235.
- From below: The nearest level of support lies at $165.42. Beneath this, support is found at $160, $158.61, $152, and $150. Beneath $150, support lies at $149.52, $144.16 (downside 1.272 Fib Extension), $133.50 (downside 1.414 Fib Extension), and $120.
- The trading volume remains low but has seen some huge spikes in September.
- The Stochastic RSI has plummeted toward extreme oversold conditions which shows that the selling may need a break – allowing for a rebound.
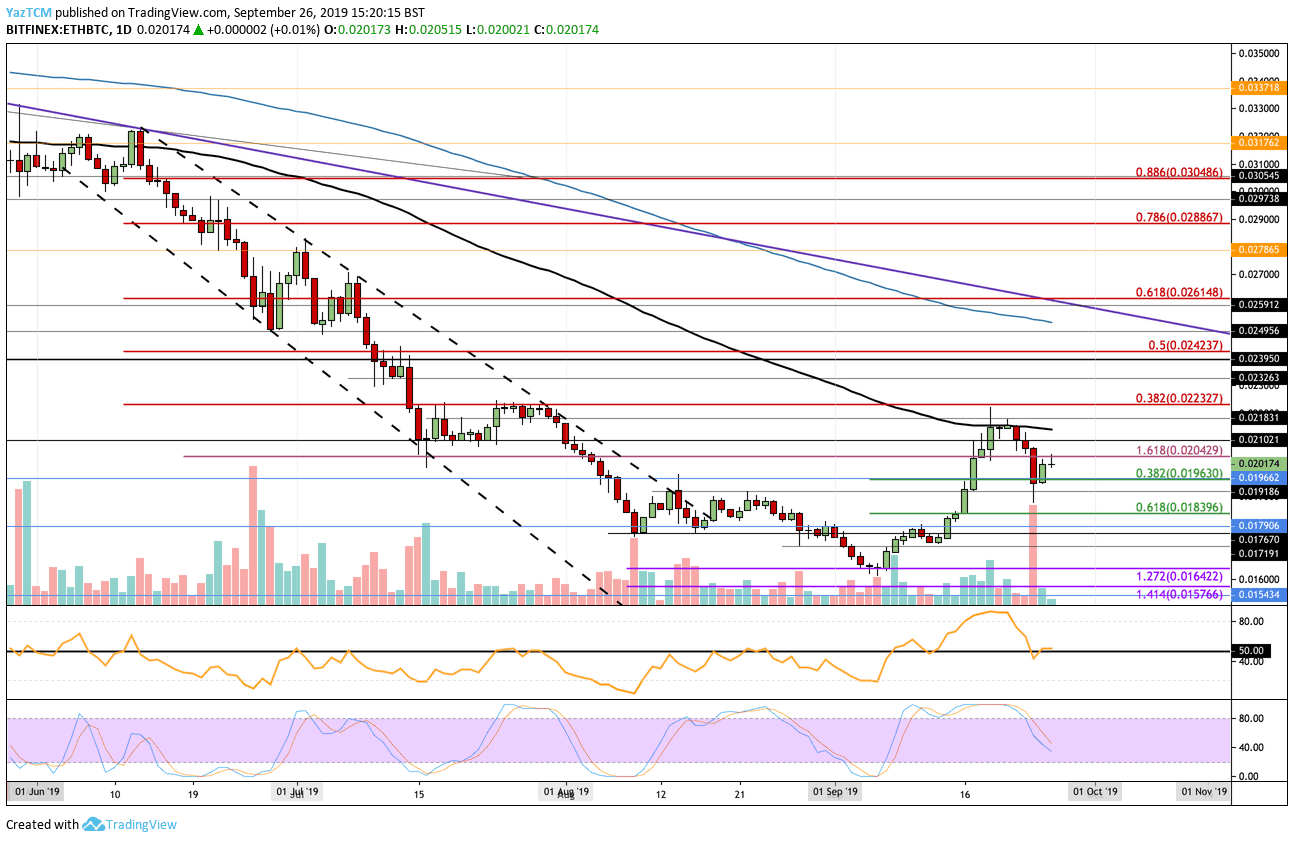
Looking at the ETH/BTC 1-day chart:
- Against BTC, ETH continued to slide from the resistance at 0.02183. However, during the latest plunge, ETH held up relatively strong. It dropped to as low as 0.01918 BTC but was able to swiftly rebound higher as it returns back above 0.02 BTC.
- From above: The nearest level of resistance lies at 0.020429 BTC. Above this, resistance lies at 0.0210 BTC, 0.0216 BTC (100-days EMA), and 0.02183 BTC. Above 0.022 BTC, resistance lies at 0.02232 BTC, 0.02326 BTC, and 0.0024 BTC.
- From below: The nearest level of support lies at 0.02 BTC. Beneath this, support lies at 0.0196 BTC, 0.01918 BTC, 0.01839 BTC, and 0.01790 BTC. If the selling continues, support can be found at 0.0176 BTC, 0.0171 BTC, and 0.01642 BTC.
- The trading volume remains at an average level for September.
- The RSI has managed to remain above the 50 level which shows that the bulls still control the market momentum.
The post Ethereum Price Analysis: ETH Back Below $170 But Is The Bleeding Over? appeared first on CryptoPotato.