Ethereum Price Analysis: ETH At Crical Level, Breaks Below 0.021BTC
Ethereum has struggled this week after losing a total of 21%, causing the price to drop to the $216 level. ETH fell beneath $200 but managed to find strong support at $193, where we saw a rebound.
ETH remains the second-largest cryptocurrency with a market cap of $23.28 billion. The cryptocurrency had been on a tear against the USD but this was largely caused by Bitcoin’s aggressive growth. On the other hand, it struggled heavily against BTC and has created fresh multi-year lows.
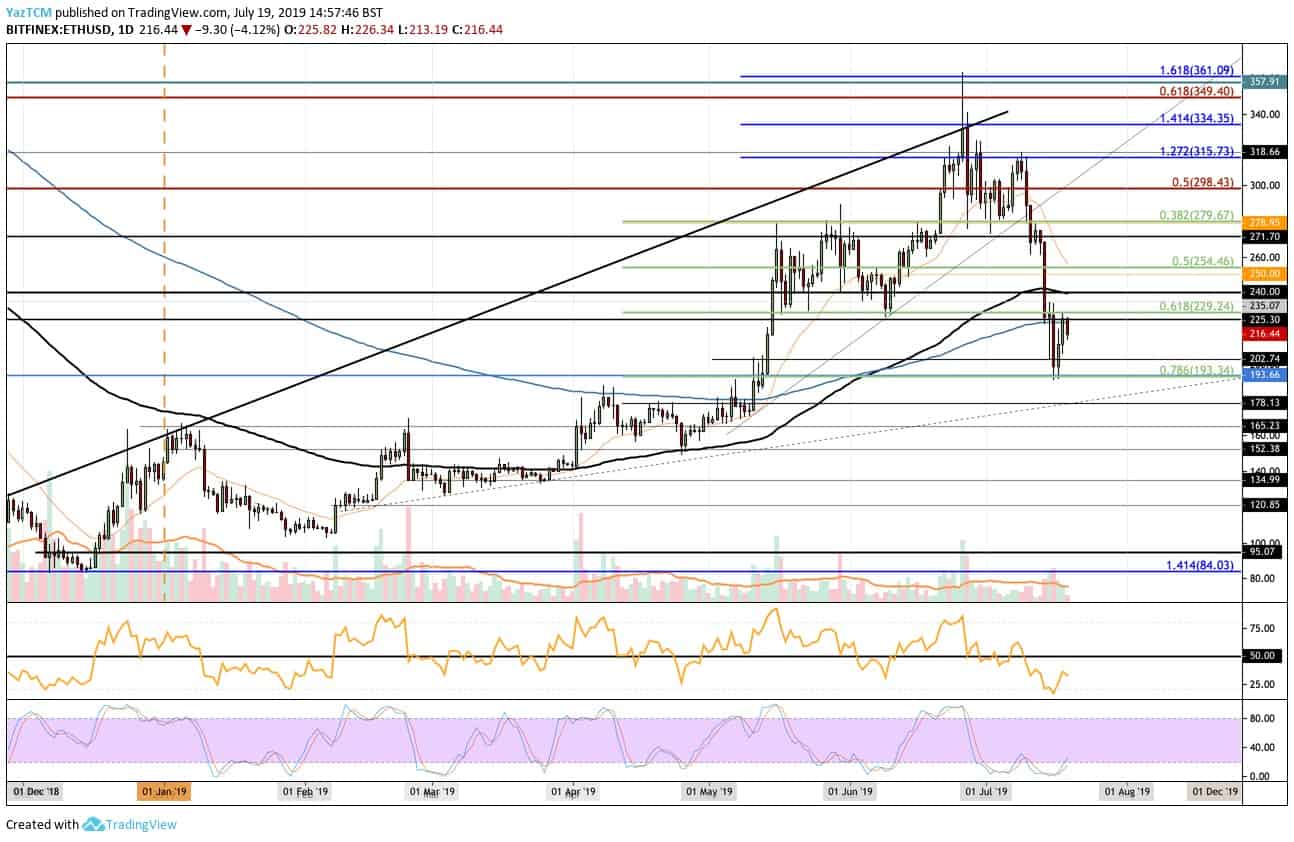
Looking at the ETH/USD 1-Day Chart:
- Since our previous ETH/USD analysis, ETH dropped beneath the support at the $225 level and continued lower. It eventually founds support at $193 which contains the short term .786 Fibonacci Retracement level. After reaching this level, Ethereum rebounded back toward the resistance at the 200 days EMA.
- From above: If the bulls can break above the $220 resistance, further higher resistance then lies at $229 and $240. The resistance at $240 is strengthened by the 100 days EMA. The next levels of resistance above $240 are located at $254, $279, and $300.
- From below: The nearest level of support now lies between $202 and $200. If the sellers drop the market beneath $200, the next level of strong support is located at $193. Below $193, further support lies at $180, $178, $165, and $150.
- The trading volume has surged during the middle of the month but has started to decrease again.
- The Stochastic RSI has recently produced a bullish crossover signal in oversold conditions as we wait for the moving average to expand to confirm that a push higher is about to commence. The RSI itself is beneath 50 which shows that the bears are still in control of the market momentum.
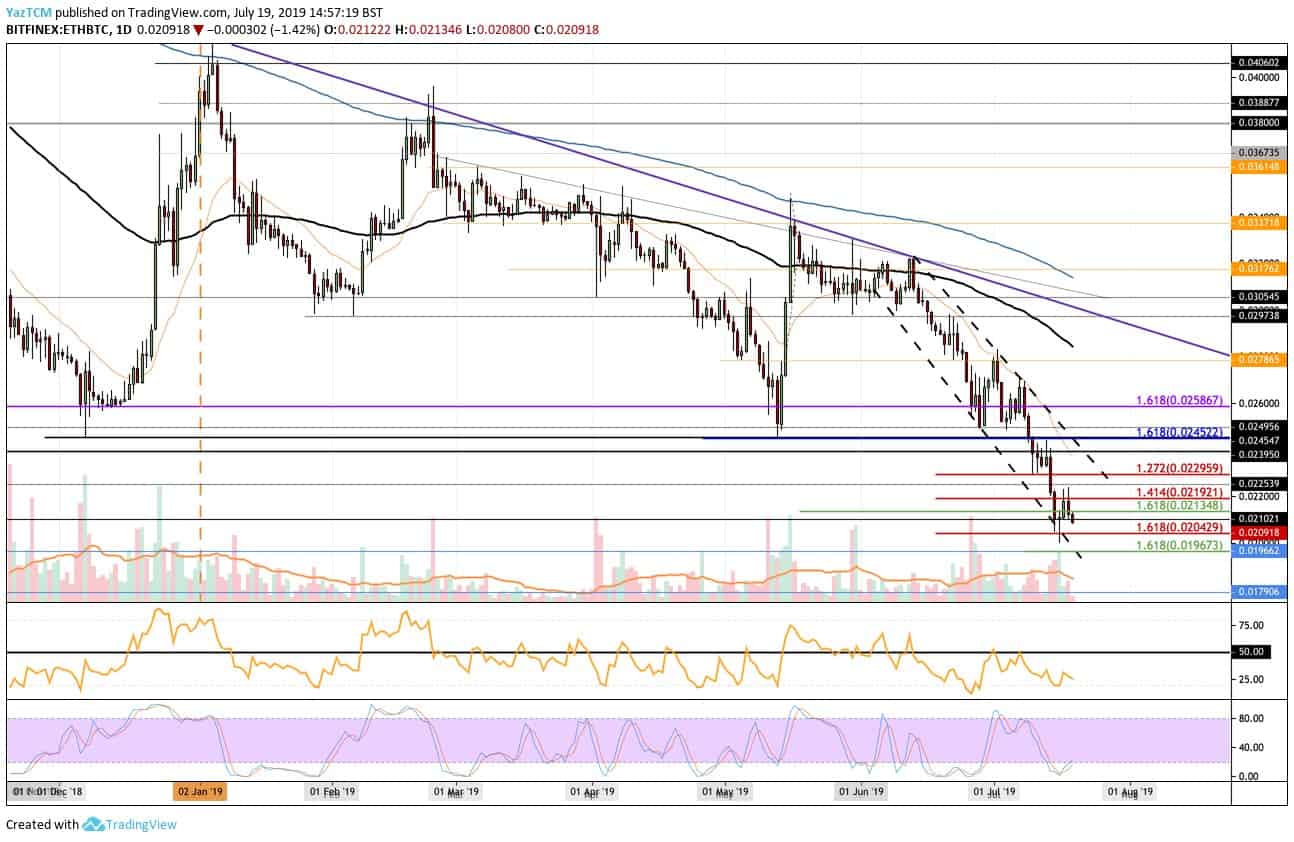
Looking at the ETH/BTC 1-Day Chart:
- Against Bitcoin, we can see that ETH had somewhat stabilized around the 0.021 BTC level. However, today it looks like ETH is about to go lower against BTC as it currently trades at 0.02042 BTC.
- From above: The nearest level of resistance lies at 0.021 BTC. Above this, higher resistance lies at 0.02134 BTC, 0.022 BTC, 0.023 BTC, and 0.0245 BTC. If the buyers can continue above 0.0245 BTC, higher resistance lies at 0.026 BTC and 0.02786 BTC.
- From below: The nearest level of support lies at 0.02042 BTC which contains the short term downside 1.618 Fibonacci Extension level. If the sellers continue to break below 0.02 BTC, the next level of support lies at 0.01967 BTC.
- The trading volume has remained at an average level for the year.
- The Stochastic RSI has also recently produced a bullish crossover signal as we wait for the moving averages to expand to confirm the bullish move.
The post Ethereum Price Analysis: ETH At Crical Level, Breaks Below 0.021BTC appeared first on CryptoPotato.