Ethereum Price Analysis: Bulls Eye $3,000 as Next Target as ETH Charts 14% Weekly Gains
Ethereum has recently seen a surge in demand near the crucial $2.1K support zone, resulting in a significant bullish retracement. The price has now reclaimed the middle threshold of the multi-month descending channel, suggesting the potential for further gains toward the upper boundary near $3K.
Technical Analysis
By Shayan
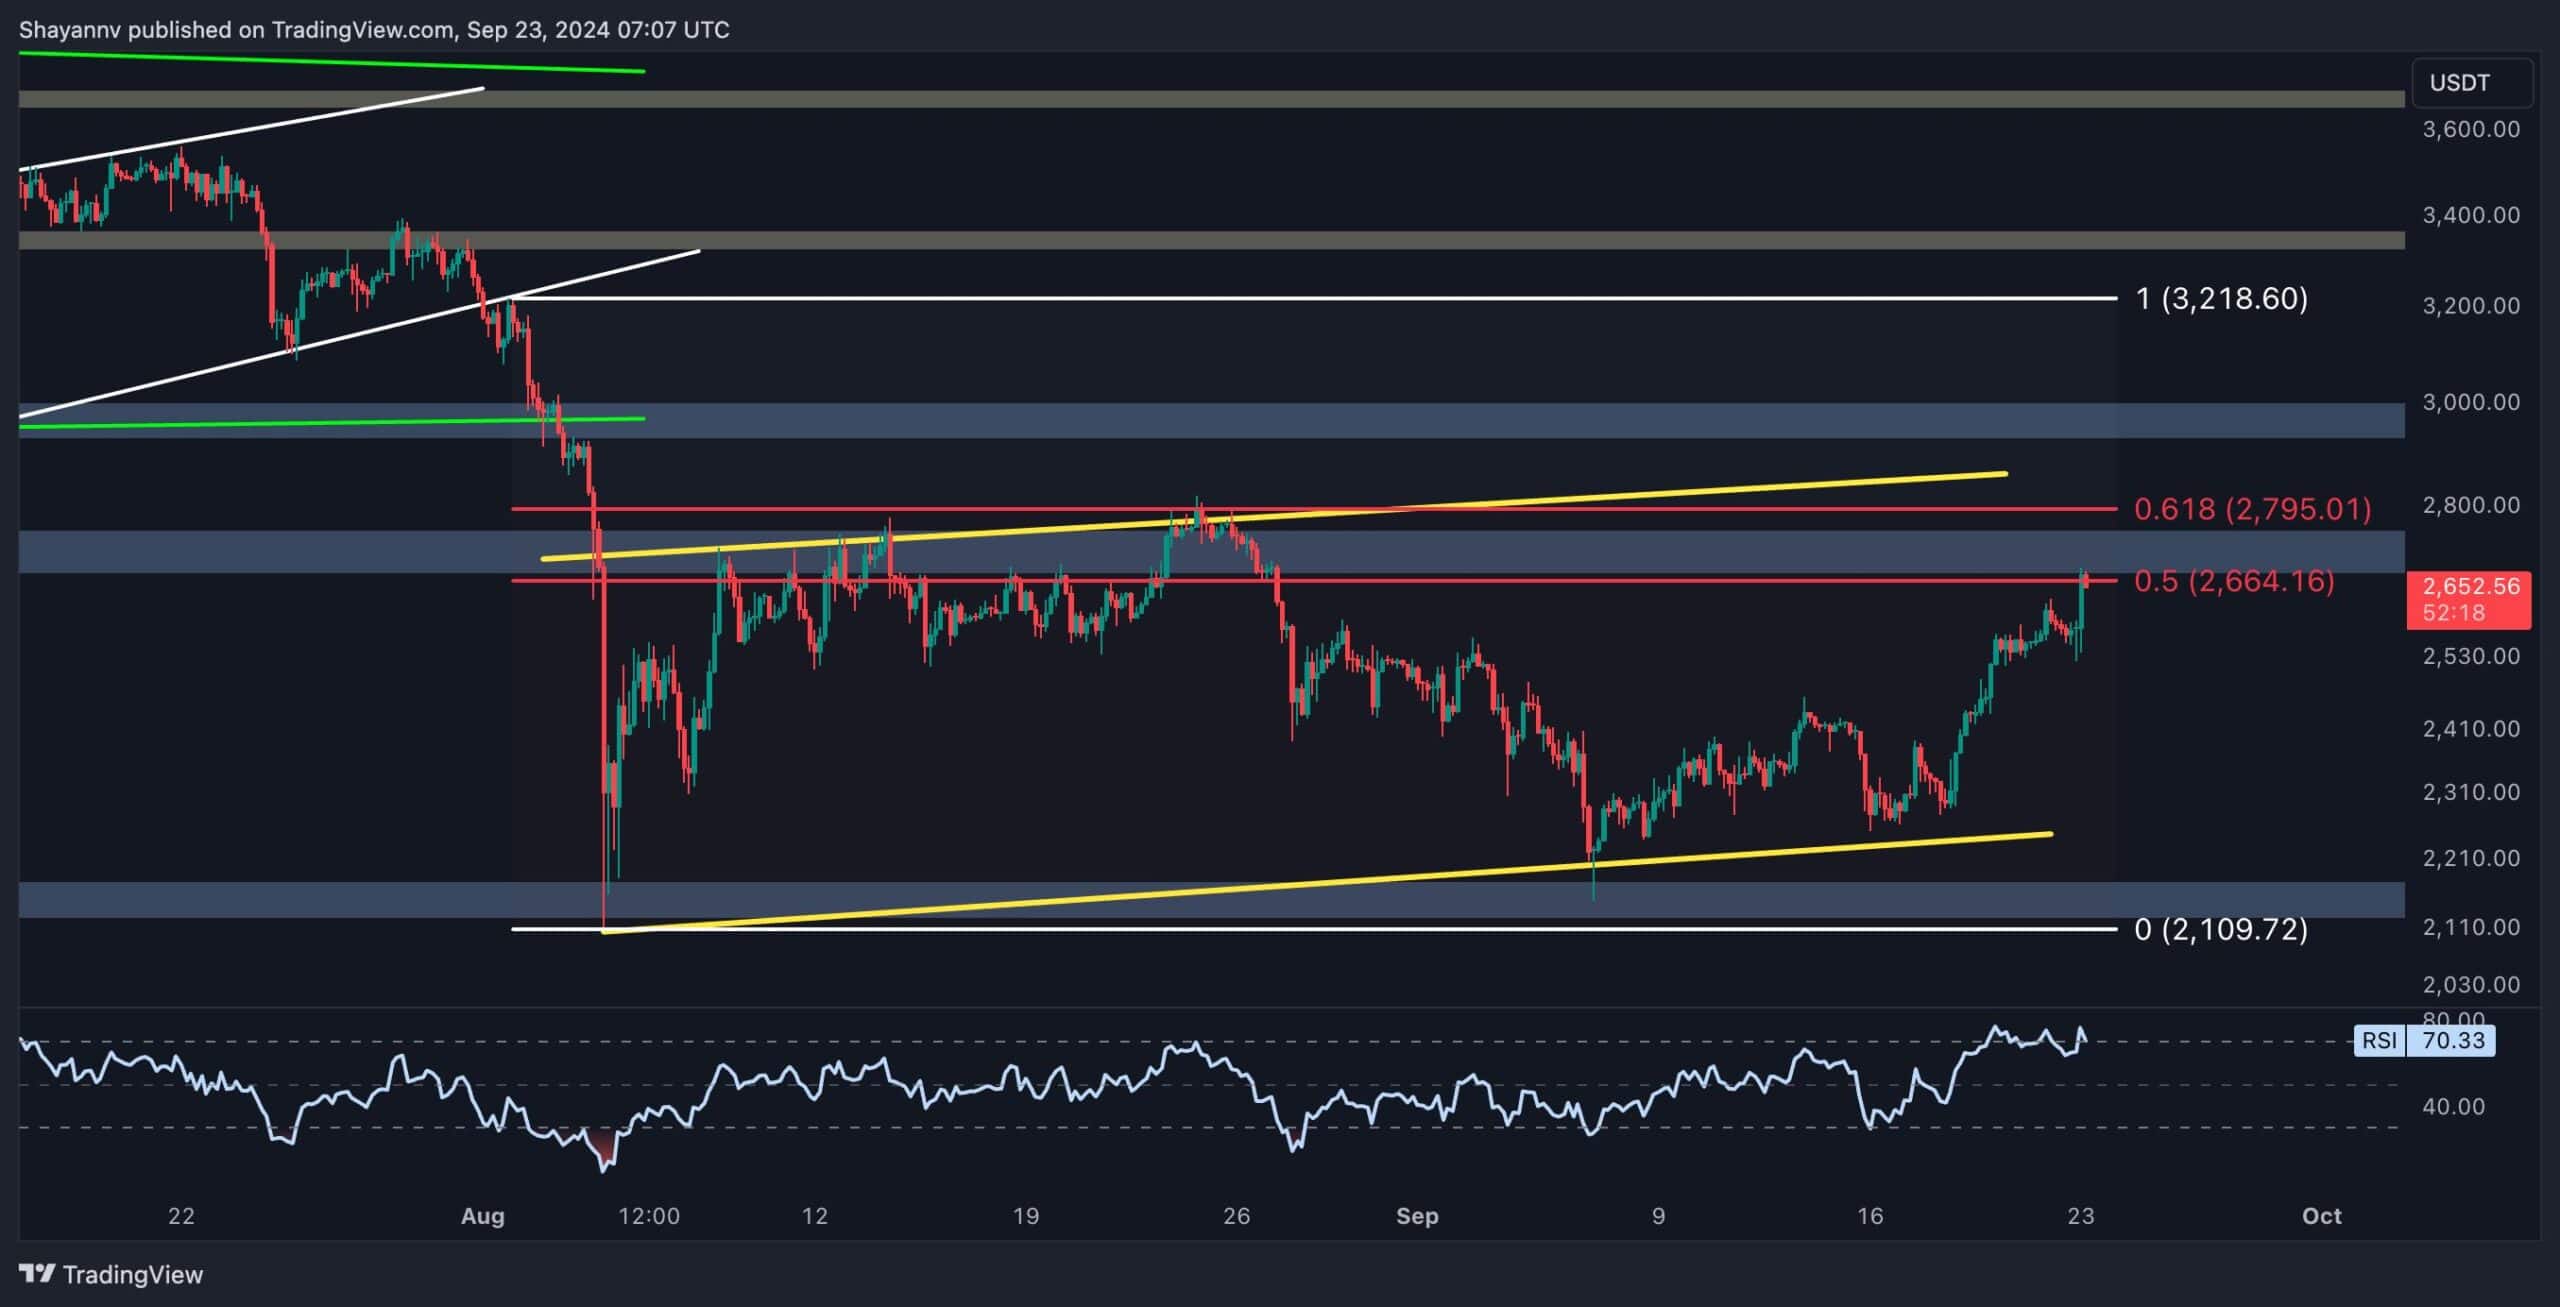
The Daily Chart
On the daily chart, Ethereum experienced increased buying pressure near the critical support region around the lower trendline of the multi-month descending channel, which aligns with the $2.1K support zone.
This resurgence in demand triggered a bullish reversal, pushing the price above a critical resistance area that includes the channel’s middle boundary at $2,530 and $2.5K. Reclaiming this zone signals a potential shift in market sentiment toward bullishness, albeit temporarily.
However, Ethereum is approaching a crucial barrier of around $2.8K, where sellers will likely step up. The price action at this level will be pivotal in determining Ethereum’s medium-term direction. A successful breakout could signal the continuation of the bullish trend, while failure to clear this resistance may lead to renewed selling pressure.
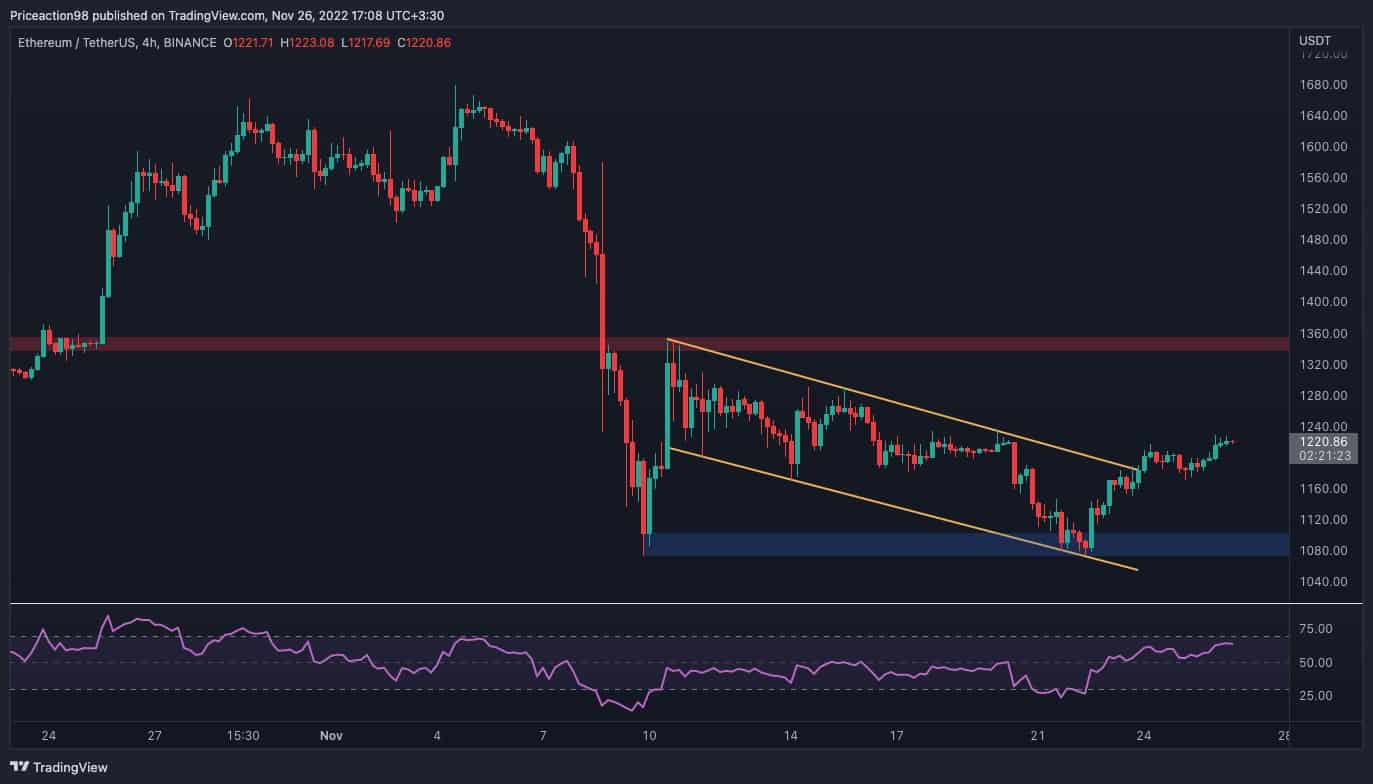
The 4-Hour Chart
On the 4-hour chart, Ethereum saw a strong surge from the $2.1K support zone, corresponding with the flag pattern’s lower boundary.
This upward momentum carried the price toward the critical resistance range between the 0.5 ($2.6K) and 0.618 ($2.8K) Fibonacci levels. The short-term action suggests that the bearish momentum has subsided, with buyers now attempting to push the price above the $2.8K resistance.
The $2.8K level has been a strong barrier for the bulls in recent months, filled with supply and selling pressure. However, Ethereum could see a breakout if the momentum persists, leading to a short-squeeze and further gains.
On the other hand, a rejection at this crucial resistance may result in a continued sideways consolidation within the flag pattern, maintaining short-term uncertainty.
Onchain Analysis
By Shayan
As Ethereum’s price continues to form higher highs and lows, approaching the $2.8K level, insights from the Binance liquidation heatmap provide valuable context for this movement. The ETH/USDT heatmap highlights significant liquidity pools often targeted by larger market participants or so-called “smart money.”
According to the heatmap, the $2.8K level contains the highest concentration of liquidity near Ethereum’s current price. Liquidity tends to act as a magnet for price, drawing the market toward these pools. As a result, this zone has become a key short-term target for Ethereum.
Given this dynamic, a bullish continuation toward the $2.8K level is highly likely driven by the market’s tendency to gravitate toward high liquidity areas. This makes the $2.8K price range a critical area to monitor, as a potential breakout above this level could signal the continuation of Ethereum’s current upward trend.

The post Ethereum Price Analysis: Bulls Eye $3,000 as Next Target as ETH Charts 14% Weekly Gains appeared first on CryptoPotato.