Ethereum Price Analysis: After Breaking $4K, Is $5000 Possible Before a Major Correction?
ETH/USD – 40% Weekly Surge Sees ETH at $4,000
Key Support Levels: $4000, $3750, $3660.
Key Resistance Levels: $4205, $4535, $4755.
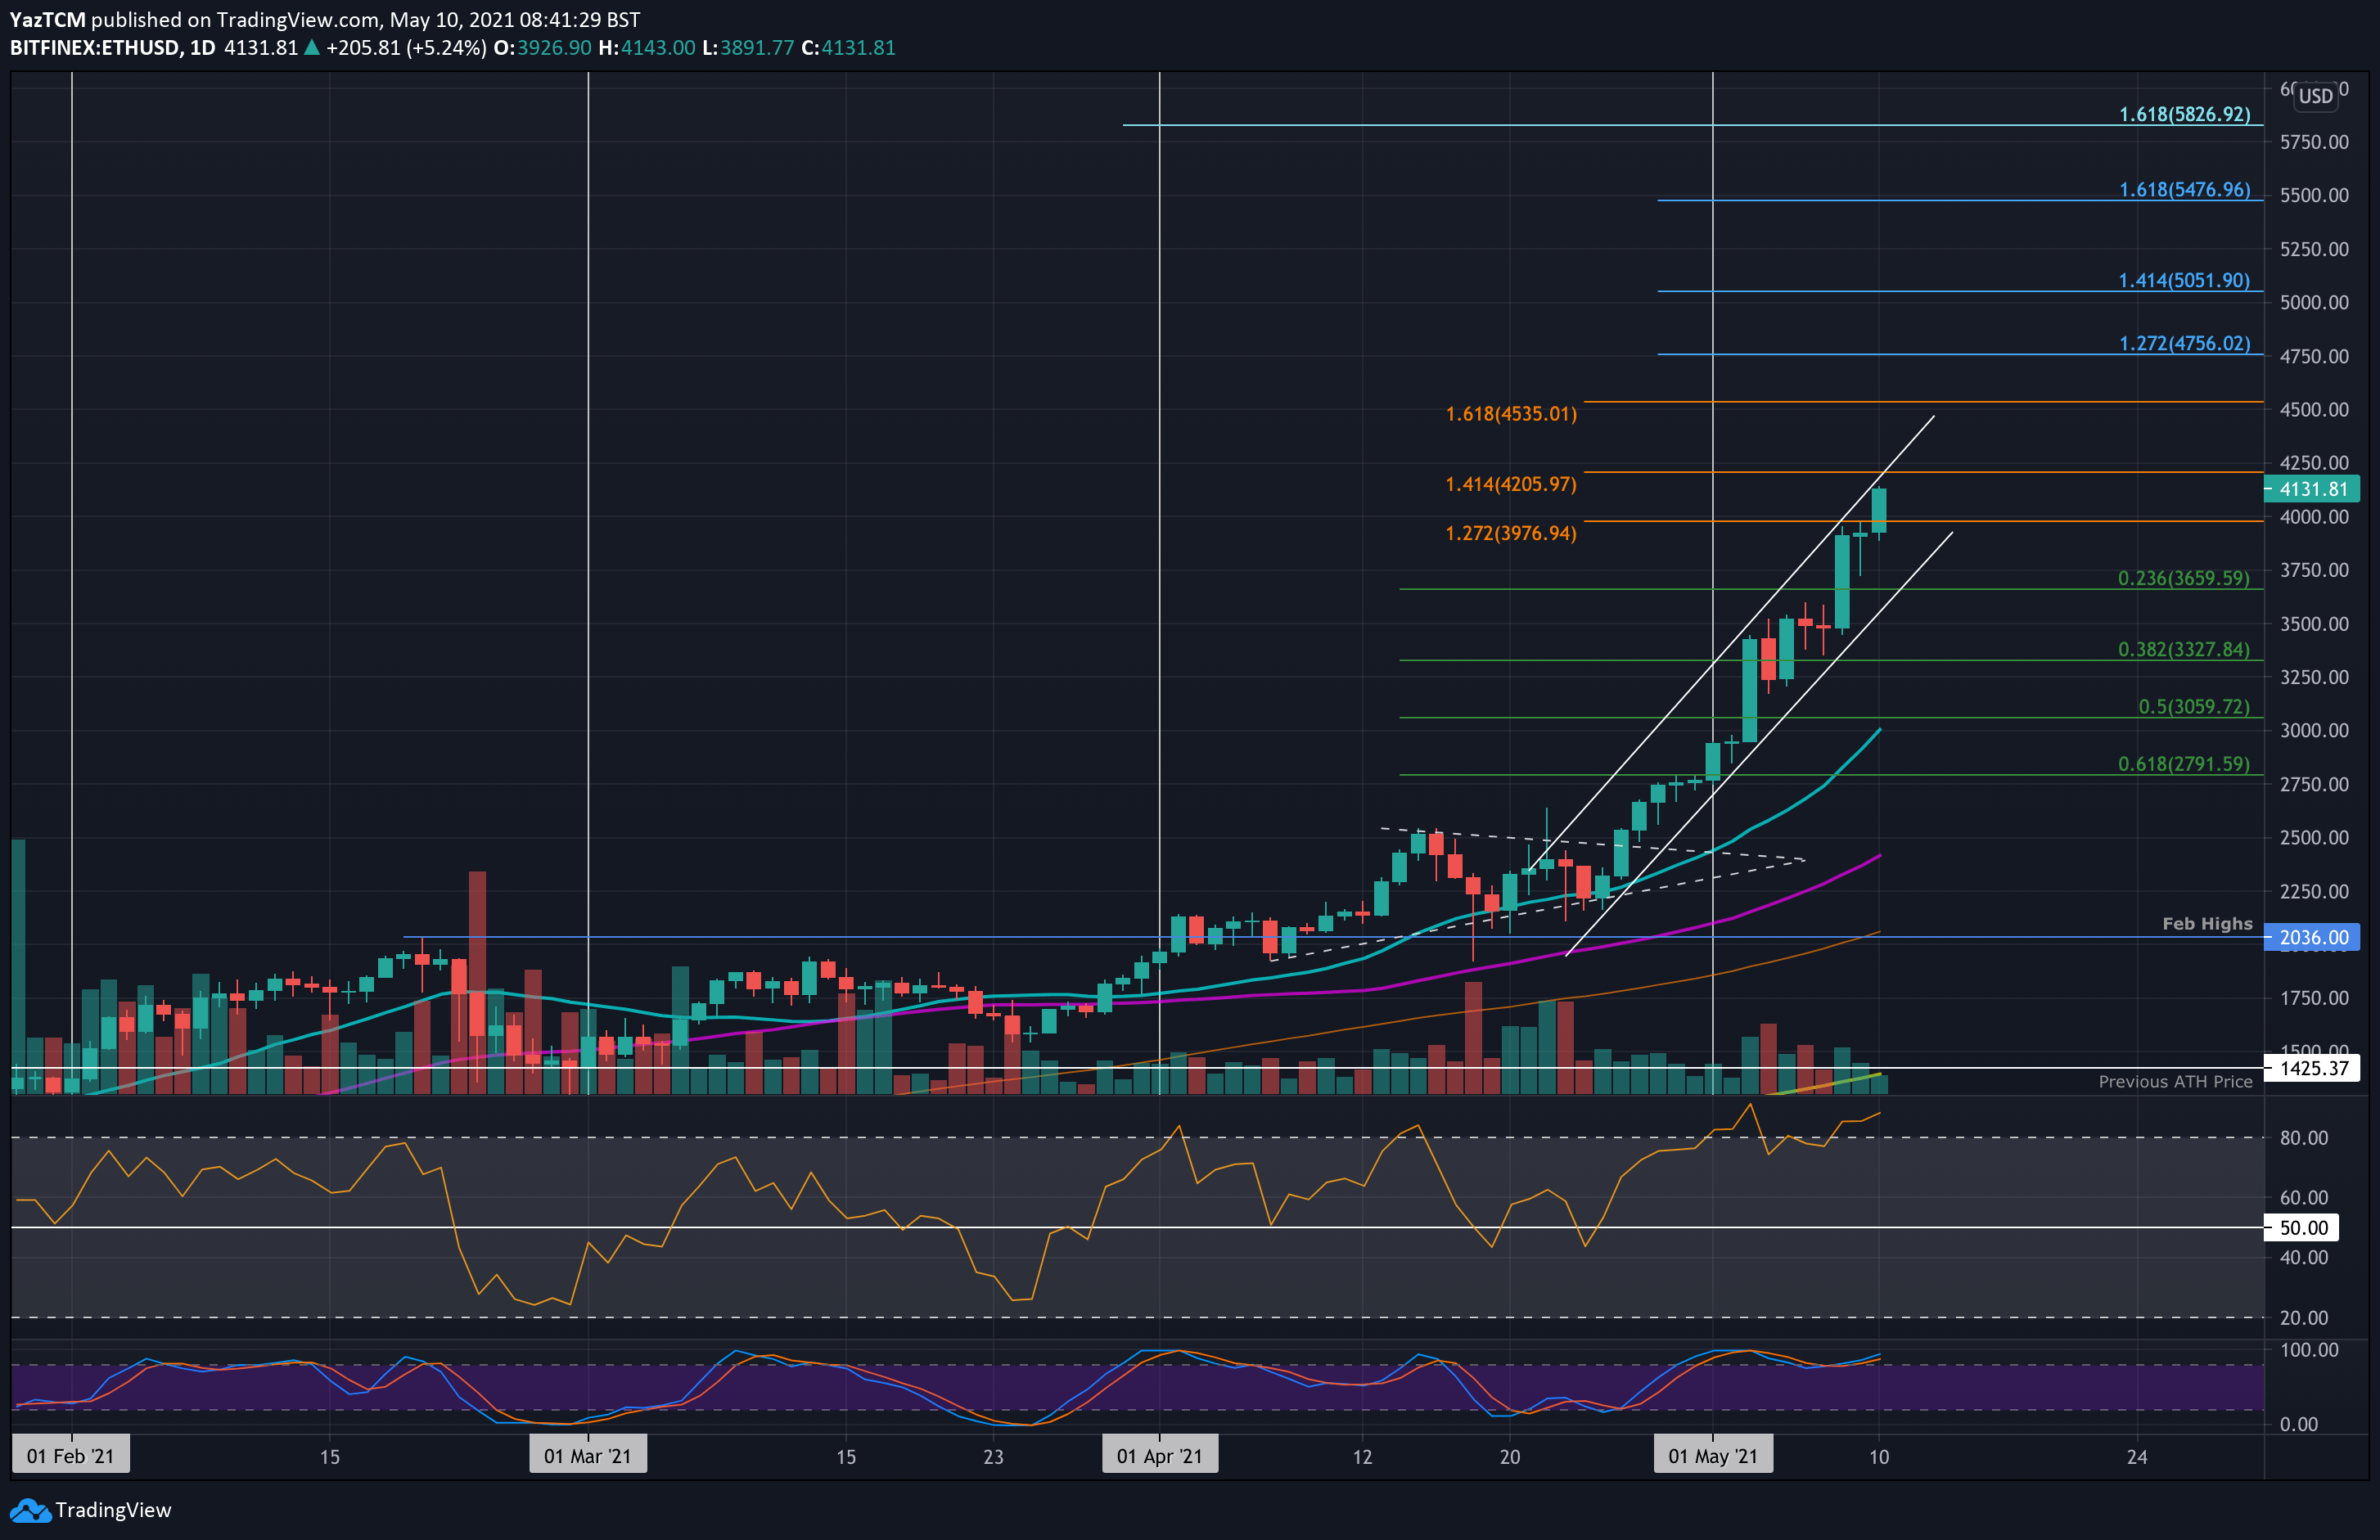
ETH exploded by 40% this week, allowing the price of the second largest crypto to climb above the $4,000 mark for the first time in its history. The cryptocurrency blasted past $4,000 today to set a new ATH price at $4,143.
ETH broke above a symmetrical triangle pattern toward the end of April, soaring above $2,500, and initiated a parabolic move since then. This can be seen as the marked ascending price channel on the following chart. At the start of May, ETH was trading at $2,750 but quickly managed to surpass $3,000 on May 3, and just 7 days later, it broke above the next milestone of $4K.
As of now, ETH had set a new ATH of $4,143 as it met resistance at the upper boundary of the ascending price channel.

ETH-USD Short Term Price Prediction
Looking ahead, the first resistance lies at $4,204 (1.414 Fib Extension). This is followed by the upper boundary of the price channel, further above lies $4,535 (1.618 Fib Extension), $4,755 (1.272 Fib Extension – blue), the $5,000 milestone, and $5,050 (1.414 Fib Extension – blue).
On the other side, the first support now becomes the recent major resistance at $4,000. This is followed by $3,750, $3,660 (.236 Fib), $3,500, $3,228 (.382 Fib), and $3,000 (20-days MA).
As expected, the RSI is extremely overbought and is printing hints of bearish divergence. Nevertheless, the RSI can remain overbought, and the price can reach even higher. However, as in parabolic moves, we have to remember that ETH hadn’t seen a major correction since breaking above $2500.
ETH/BTC – Bulls Breach 0.07 BTC
Key Support Levels: 0.0675 BTC, 0.0651 BTC, 0.0618 BTC.
Key Resistance Levels: 0.073 BTC, 0.075 BTC, 0.077 BTC.
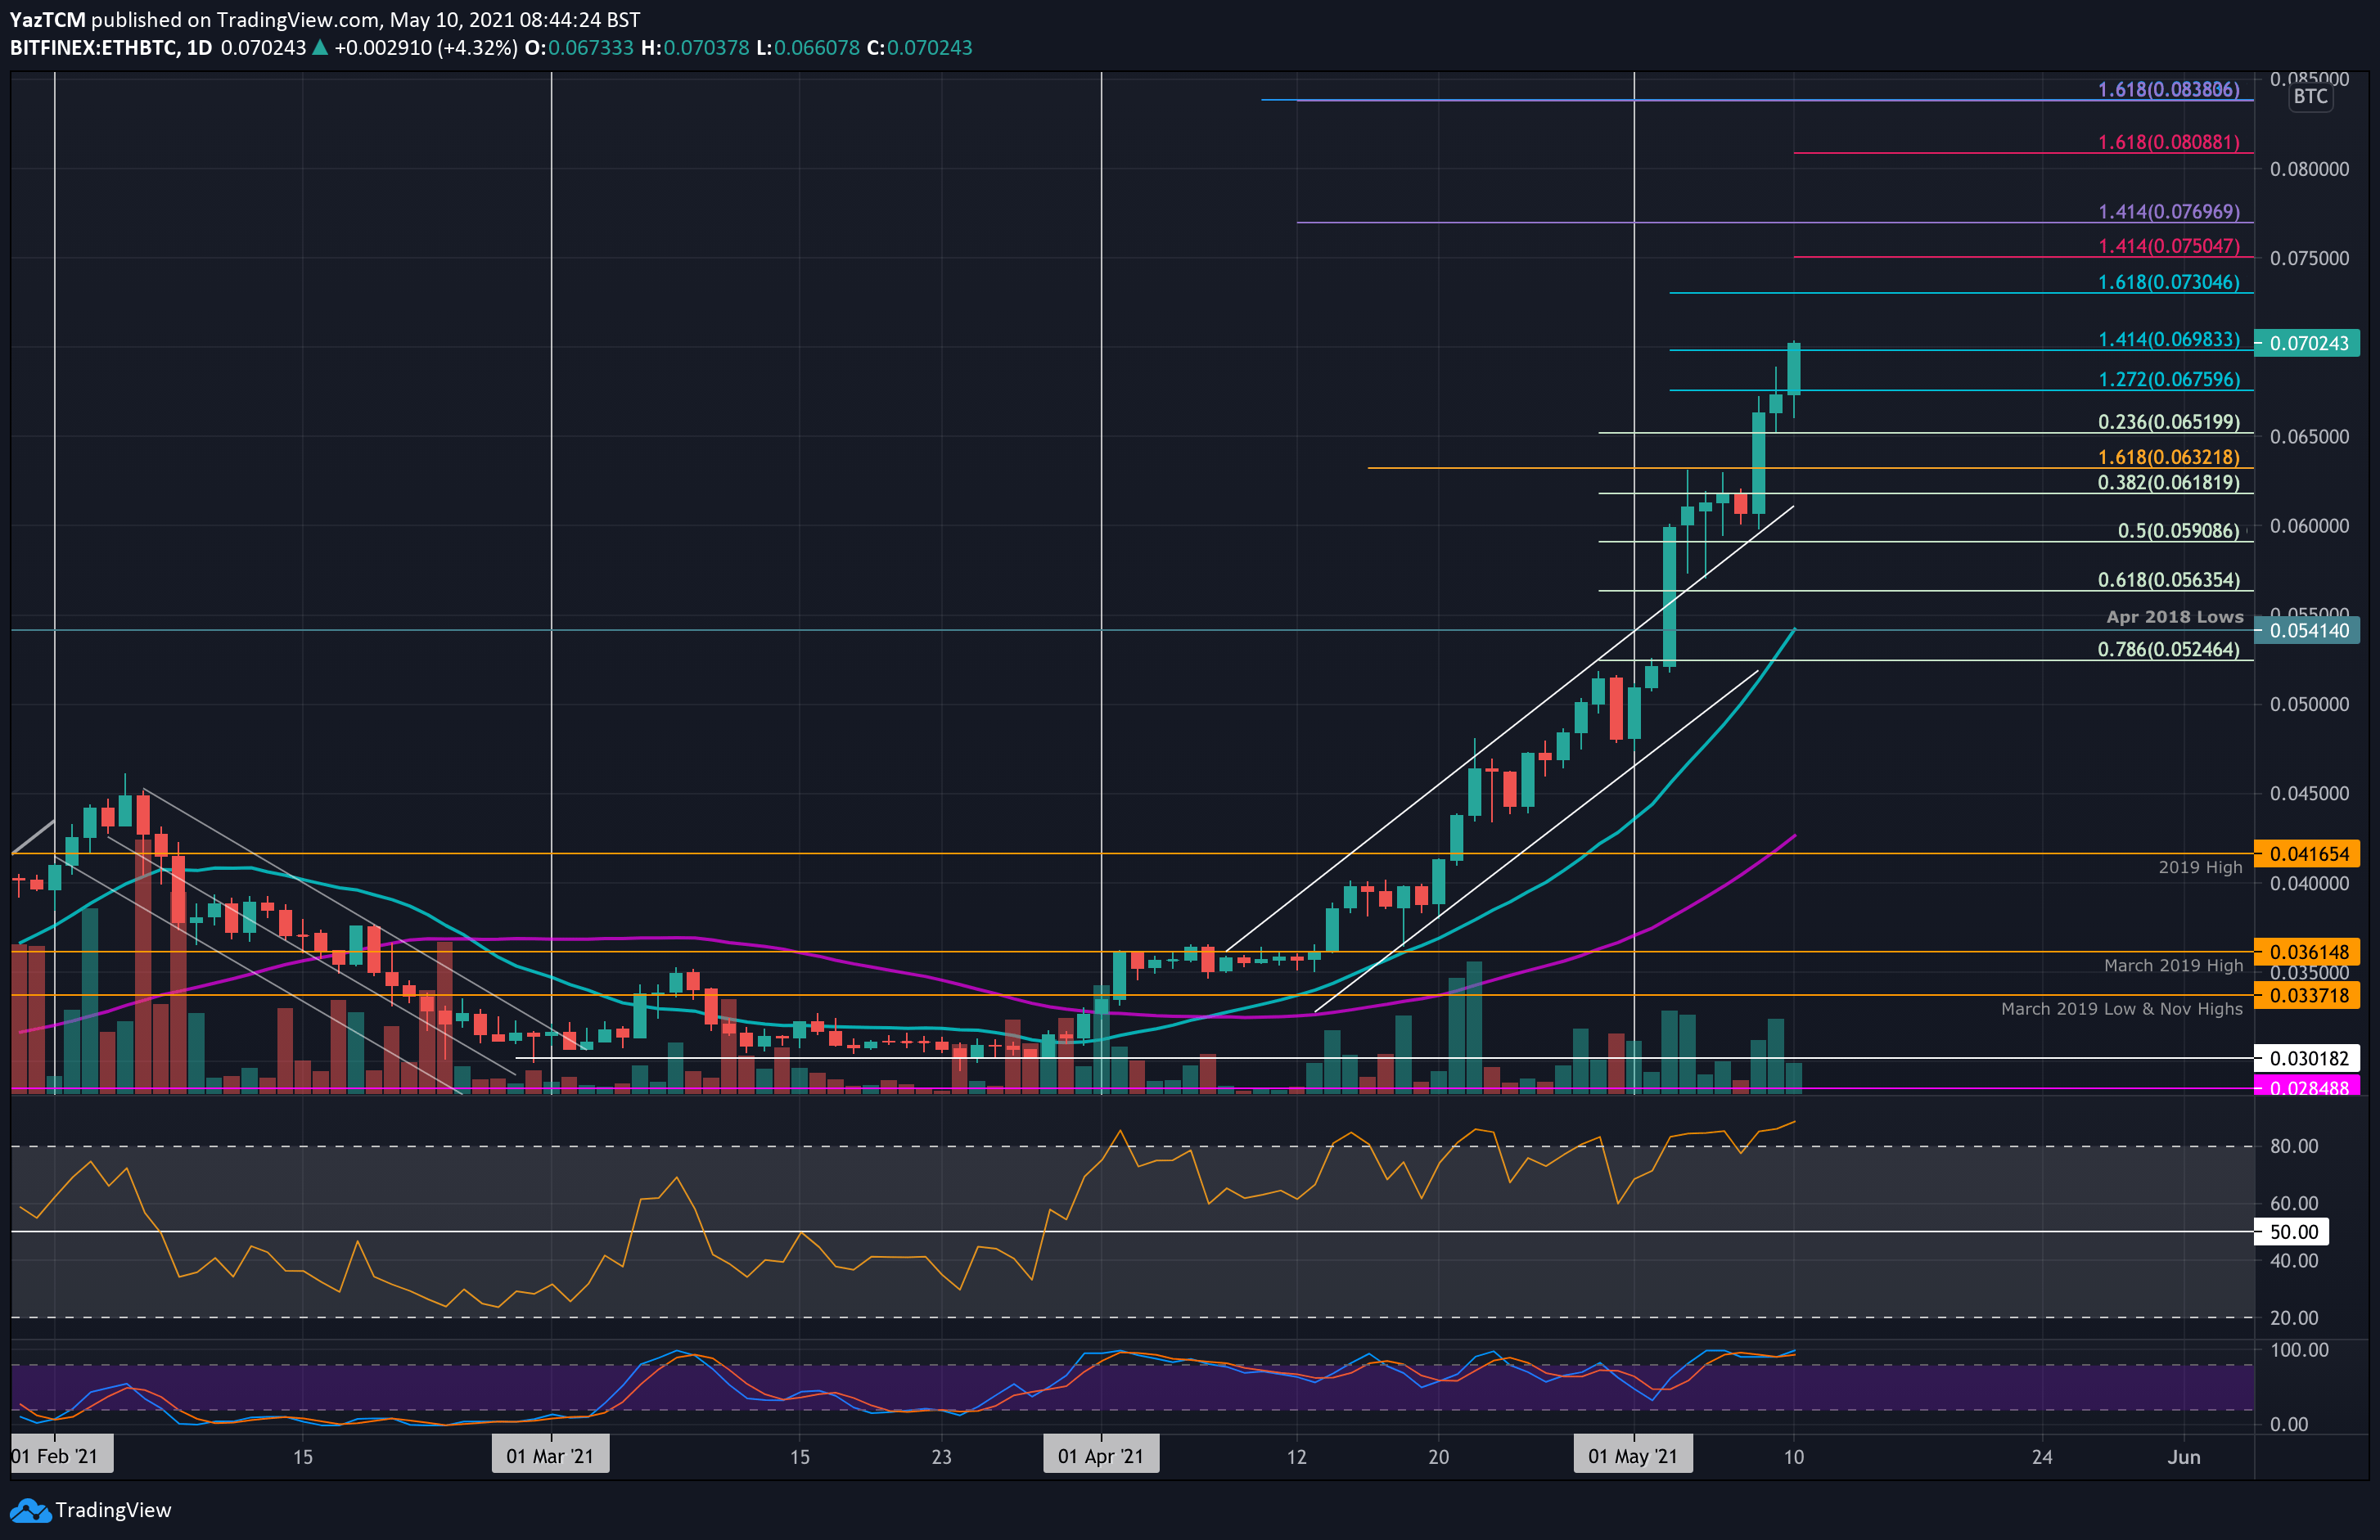
Ethereum is also outperforming Bitcoin as it breaches the 0.07 BTC level today. The coin had met resistance around 0.062 BTC last week and struggled to break above there until the weekend, which saw ETH/BTC climbing as high as 0.0657 BTC (1.272 Fib Extension). Today, along with breaking the $4K resistance, ETH/BTC continued beyond 0.0657 BTC to reach the current 0.0702 BTC level.
Amazingly, ETH/BTC is still far away from its January 2018 all-time high levels around 0.14.

ETH-BTC Short Term Price Prediction
Looking ahead, if the buyers continue higher, the first resistance lies at 0.073 BTC (1.618 Fib Extension). This is followed by 0.075 BTC (1.414 Fib Extension – pink), 0.077 BTC (1.414 Fib Extension – purple), and 0.08 BTC.
On the other side, the first support lies at 0.0675 BTC (this weekend’s resistance). Beneath this, support lies at 0.0651 BTC (.236 Fib), 0.0618 BTC (.382 Fib), and 0.06 BTC.
Again, just like the ETH/USD pair, the RSI is extremely overbought here but is not showing signs of bearish divergence.


