Ethereum (ETH) Price Analysis Feb.14: Ethereum Consolidates Around $120. What’s Next?
Ethereum has now seen a modest price increase totaling over 16% throughout the past week. The cryptocurrency currently trades for approximately $120, after suffering from a 30% price fall over the past 90 days. This consolidation is aligned with the recent price moves of Bitcoin.
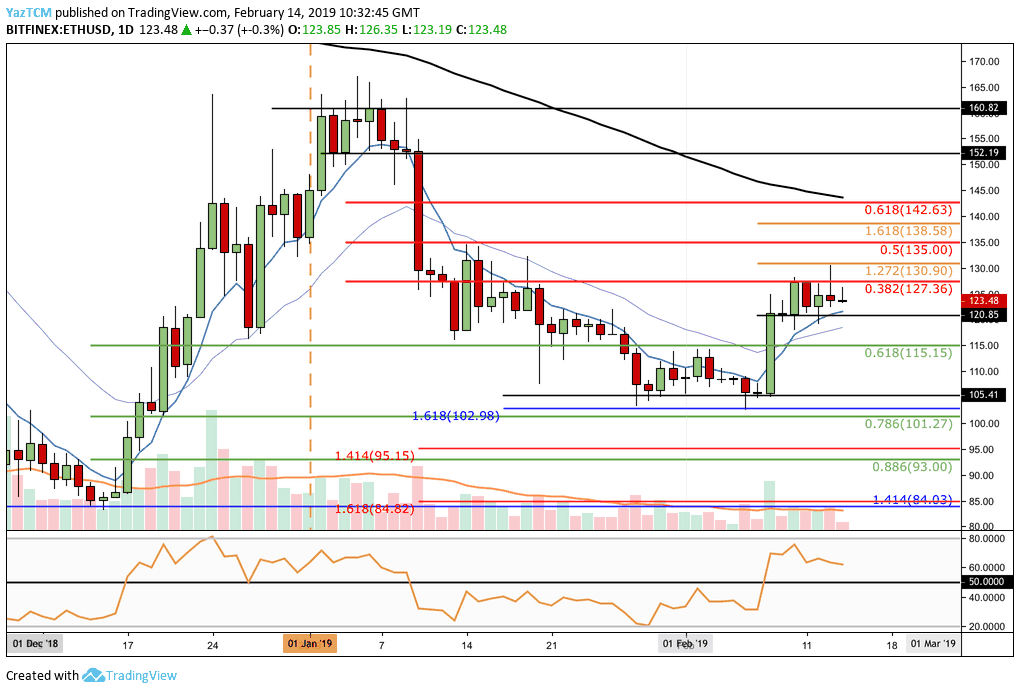
Looking at the ETH/USD 1- Day Chart:
- After bouncing from support level at $105.41, ETH/USD had experienced a price surge that drove the market up to a high of $127.36.
The market had reached resistance at a bearish .382 Fibonacci Retracement level (marked in red). This Fibonacci Retracement is measured from the high of January 2019 to the low of February 2019. - Price action has now formed a trading range between $127.36 and $120.85, from below.
- The nearest support is located at the bottom of the above range at $120.85, whereas the next short-term support at .618 Fibonacci Retracement level (marked in green) located at $115.15.
- Support below this lies at $105.4, $102.98 and psychological level of $100.
- From Above: The nearest resistance is located at the top of the trading range at $127.36.
- This is followed with resistance at a short term 1.272 Fibonacci Extension level (marked in orange) located at $130, and the bearish .5 Fibonacci Retracement level (marked in red) located at $135.
- The RSI indicator remains above 50 which indicates that the bulls are still in control of the market’s momentum.
- The trading volume is slowly decreasing over the past few days.
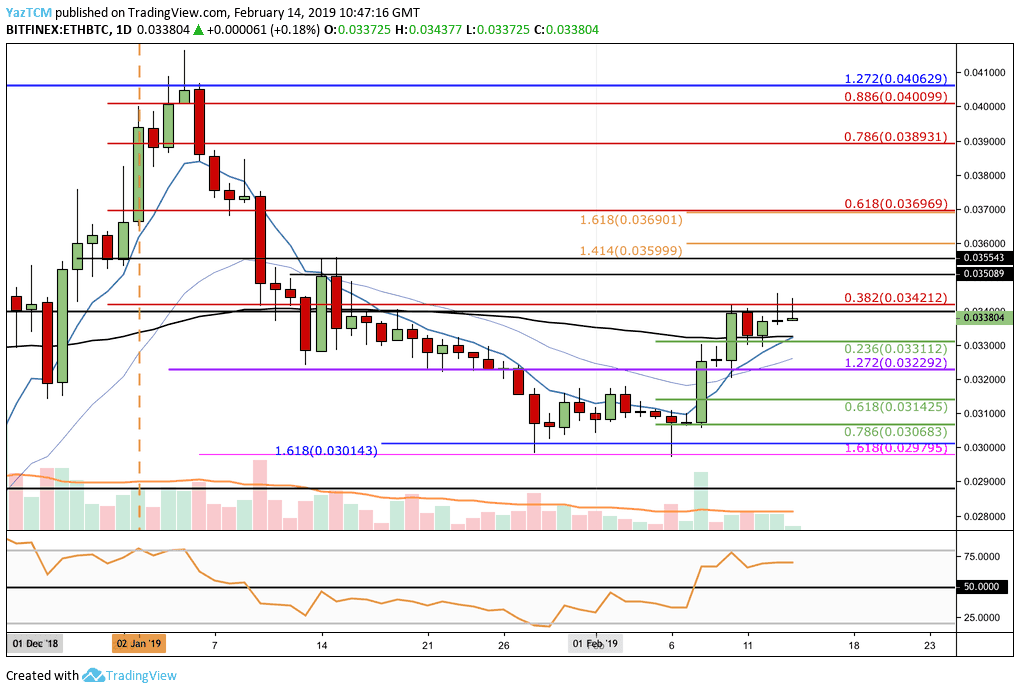
Looking at the ETH/BTC 1-Day Chart:
- The price action had found support at the 0.030143 BTC level, and from there rebounded throughout February 2019.
- The rebound brought the coin up to resistance at the 0.034 BTC level. This resistance extends back to November 2018 and also resistance from a bearish .382 Fibonacci Retracement level (marked in red).
- The market has now established a tight trading range between 0.034212 BTC and 0.033112 BTC.
- From Below: Support lies at 0.032292 BTC and then 0.032000 BTC.
- Further support beneath can be located at the .618 (0.031425 BTC) and .786 (0.030683 BTC) Fibonacci Retracement levels (marked in green).
- From Above: Resistance above the range lies at 0.035089 BTC and 0.035543 BTC.
- Higher resistance lies at the short-term 1.414 Fibonacci Extension level (marked in orange) at 0.035999 BTC and the bearish .618 Fibonacci Retracement level (marked in red) at 0.03696.
- The RSI remains above 50 as the bulls maintain control of the market momentum. However, the RSI looks very fragile.
- Trading volume remains at a steady average level.

The post Ethereum (ETH) Price Analysis Feb.14: Ethereum Consolidates Around $120. What’s Next? appeared first on CryptoPotato.


