Ethereum (ETH) May 16 – Ethereum Breaks Above $250 And Continues Higher
Ethereum has seen a magnificent price surge totaling over 56% throughout the past 7 trading days. This price move has now allowed Ethereum to fly above the $200 level to where it currently is trading at around $265. The Ethereum coin has now created a fresh 8 month high after rising by a total of 121% over the past 90 trading days.
Ethereum remains in 2nd place amongst the top cryptocurrency coins by market cap value as it currently holds a $28.11 billion market cap, according to CoinMarketCap data.
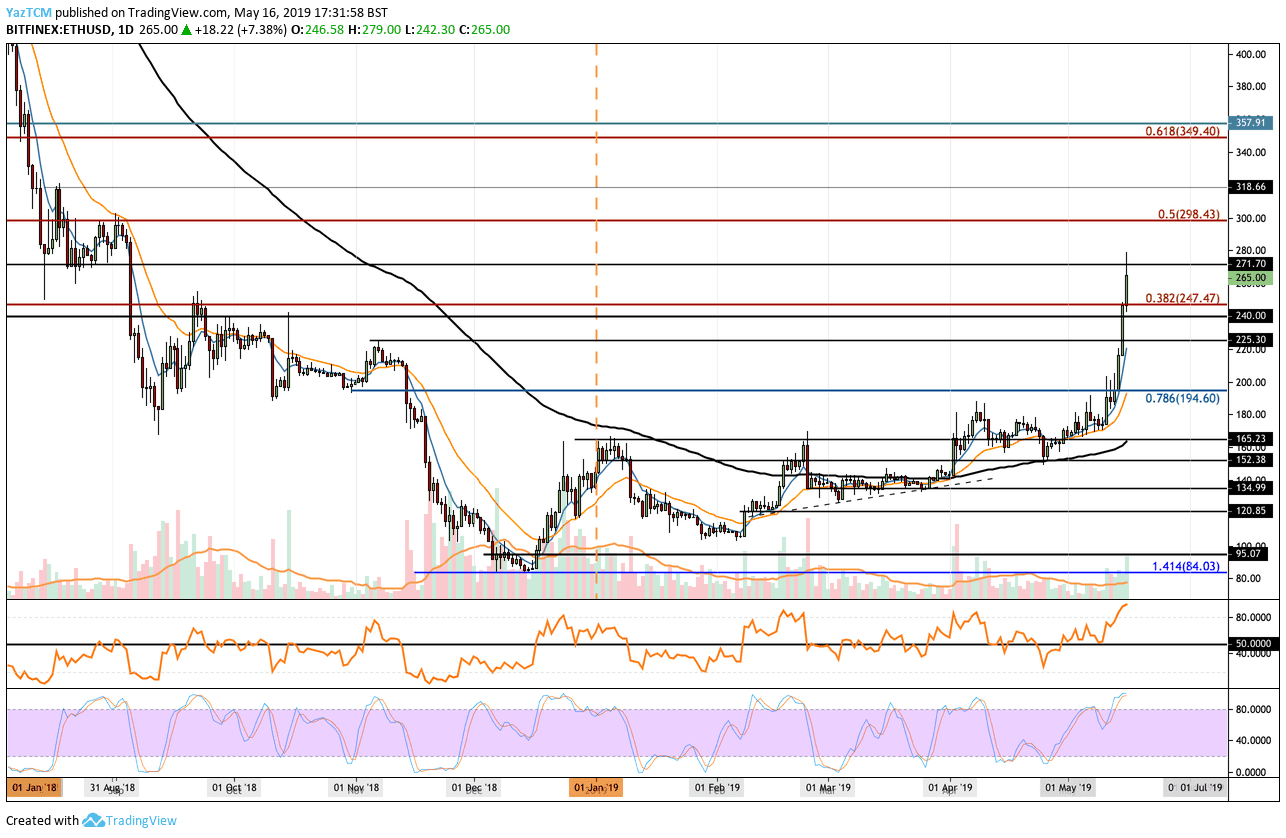
Looking at the ETH/USD 1-Day Chart:
- Since our previous ETH/USD analysis, we can see ETH/USD surged above the resistance at $194 and $200, continuing higher until recently reaching resistance at the $280 level.
- From above: The nearest level of resistance above $271 and $280 now lies at $300. The resistance at $300 is strengthened by a long term bearish .5 Fibonacci Retracement level (marked in red). Above $300, further resistance exists at $318, $340 and $350 (which also contains the bearish .618 Fibonacci Retracement level).
- From below: The nearest level of support now sits between $250 – $247. Beneath this, further support lies at $240, $225, $200 and $194.
- The RSI has reached overbought territory which could suggest that a retracement may be coming soon. This is further confirmed by the Stochastic RSI as it currently trades in overbought territory, primed for a bearish crossover.
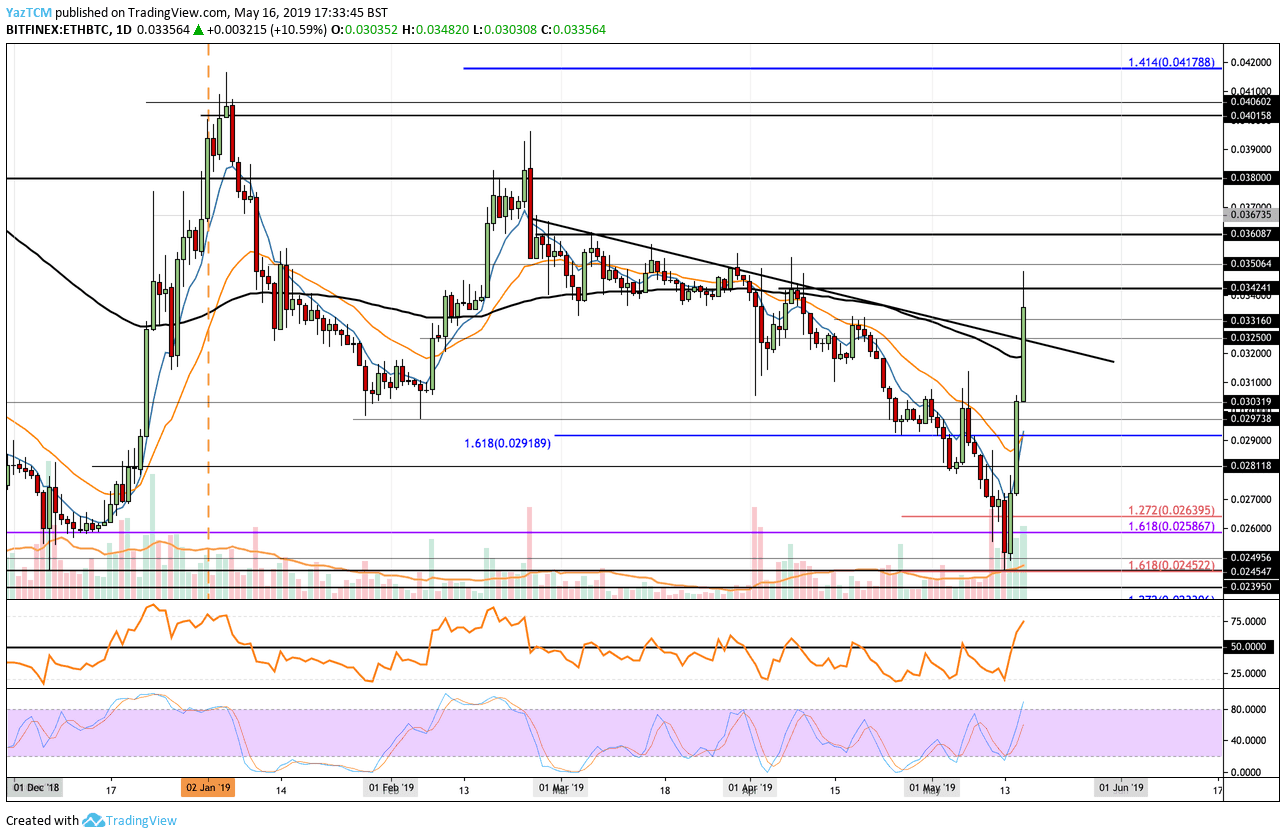
Looking at the ETH/BTC 1-Day Chart:
- Against Bitcoin, we can see ETH/BTC managed to hold support at 0.02455 BTC and proceeded to rebound much higher. The recent price surge has allowed Ethereum to break above the 100-day moving average line, as well as above a 2.5-month-old falling trend line, to where it currently is trading at around 0.033 BTC.
- From above: The nearest level of resistance now lies at 0.03424 BTC. Above this, further resistance exists at 0.035 BTC, 0.036 BTC, 0.0367 BTC and 0.038 BTC
- From below: The nearest level of support now lies at 0.033 BTC. Beneath this, further support sits at 0.032 BTC (which contains the 100-day moving average line) and 0.030 BTC.
- The RSI recently managed to climb above the 50 line for the first time since late February 2019, which is a strong bullish sign.
- Trading volume has been rising significantly over the past few days as the interest for Ethereum starts to grow again.
The post Ethereum (ETH) May 16 – Ethereum Breaks Above $250 And Continues Higher appeared first on CryptoPotato.