Ethereum Daily Transaction Count At A 2-Year High While Gas Fees Calm Down
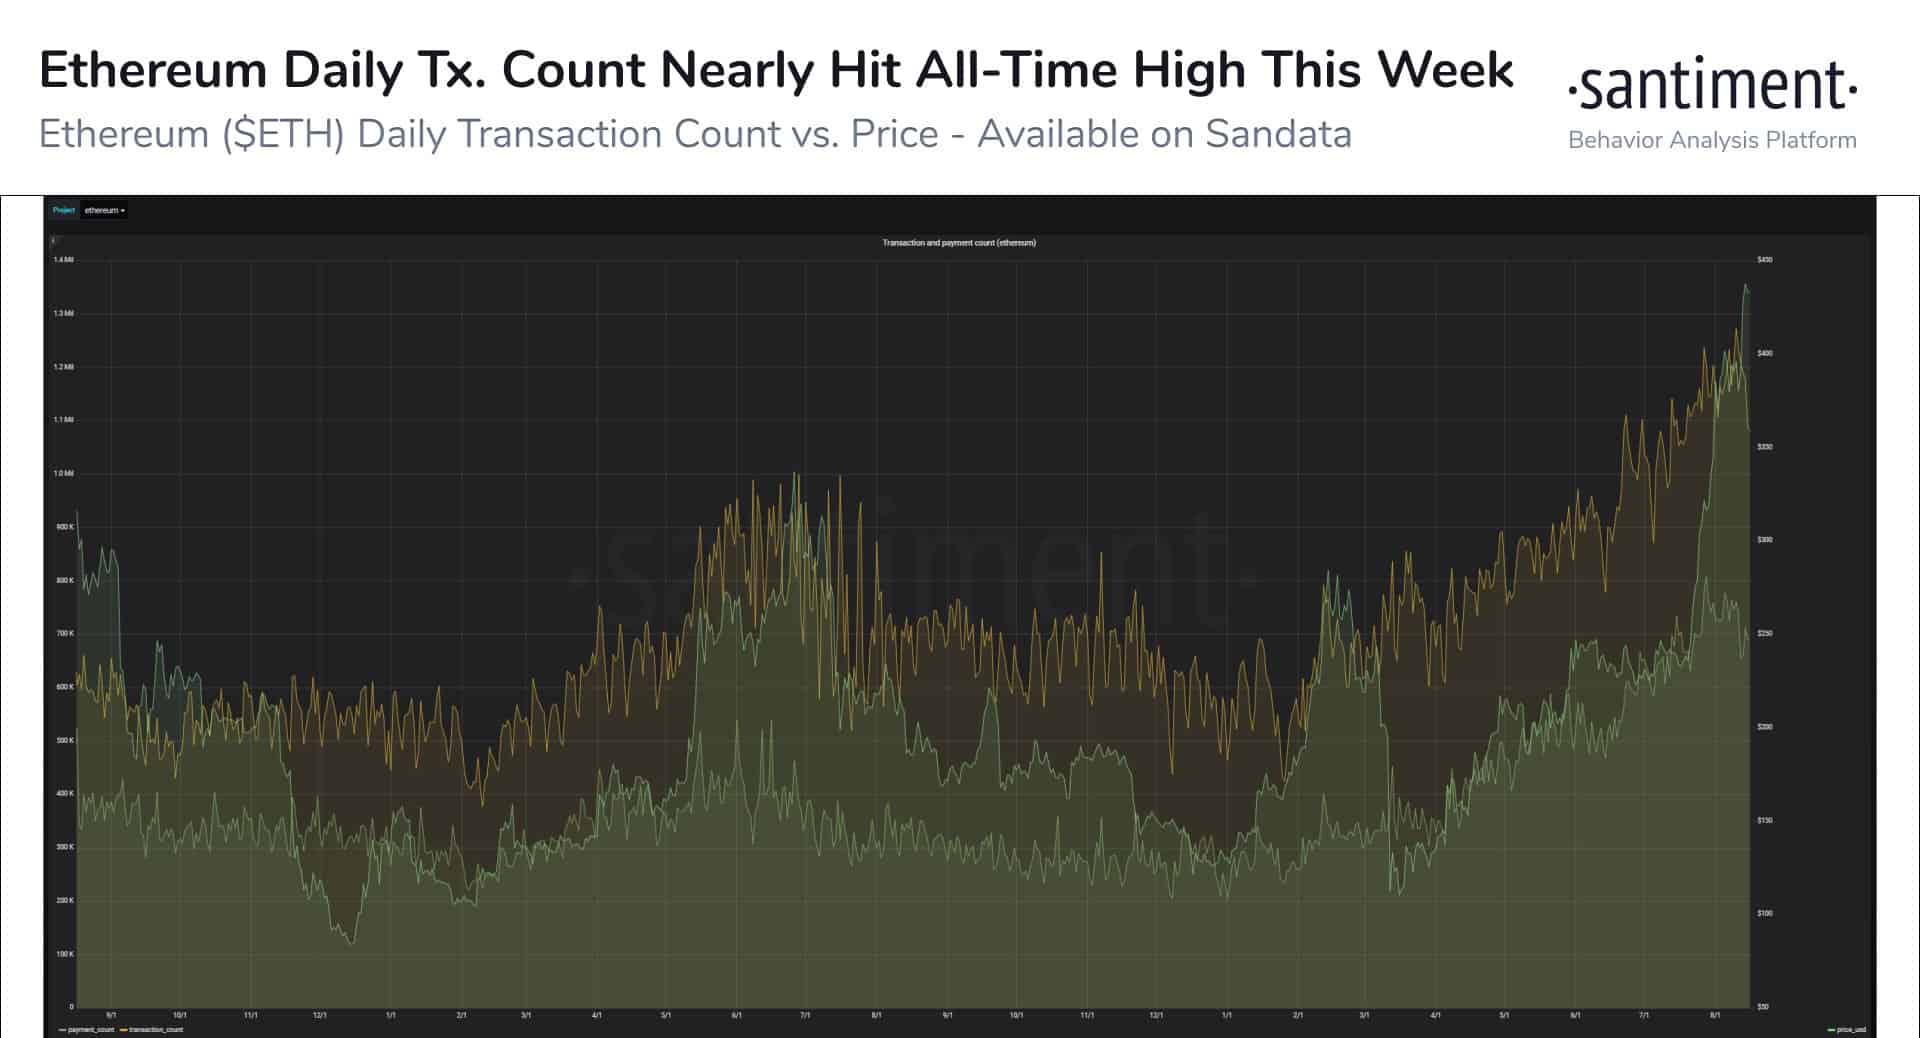
The daily transaction count on the Ethereum network reached a two-year high with 1.27 million, which is the closest number displayed to the all-time high from January 4th, 2018, at 1.34 million.
Simultaneously, the transaction fees have dropped significantly from the ATH marked just a few days ago.
Ethereum Transaction Count At Near ATH
With the ongoing DeFi boom and over $6 billion total value locked, the Ethereum network, which is the underlying technology of most DeFi projects, has experienced an uptick of activity in multiple aspects.
According to the data analytics company Santiment, one such metric is the daily transaction count on the Ethereum blockchain.

The current all-time high of 1.34 million came on January 4th, 2018 – just a few weeks before ETH reached its highest price of over $1,400 during the ICO boom. Now, the DeFi trend has taken the daily transaction count to a “shouting distance at 1.27 million.”
This marks a 200% increase since the yearly bottom in January 2020. According to Santiment, the “increased activity is a good long-term sign of things to come for Ethereum holders.”
Ethereum Transaction Fees Calm Down
As CryptoPotato reported recently, the average gas fees paid on the Ethereum blockchain reached an all-time high as well. The average transaction fees went as high as 0.02 ETH (about $8) and thus surpassed the previous record of 0.017 ETH registered in December 2016.
As the fees topped $8 million on that day, another report reaffirmed the stance that the DeFi sector is responsible for the most substantial part over 65%, while Tether (USDT) followed with 14%. It’s worth noting that Ethereum’s native cryptocurrency (ETH) occupied the 3rd spot with 12.3%.
This sudden surge coincided with the emergence of Yam Finance – another DeFi project that rapidly gathered the community’s attention before an unfortunate turn of events dumped its value.
With about 150,000 pending transactions in the Ethereum mempool at the time, the network showed significant signs of congestion.
Interestingly, the number of such transactions has only increased since then to 155,000 now, but the average transaction fees have decreased to about 0.006 ETH (about $2.5).
This typically means that the number of users wanting to have their transactions prioritized has dropped as they are not willing to pay higher gas fees.

The post Ethereum Daily Transaction Count At A 2-Year High While Gas Fees Calm Down appeared first on CryptoPotato.


