ETH Struggles at $1.8K But is a Pullback Incoming? (Ethereum Price Analysis)
Ethereum’s overall outlook is bullish, but the price is currently facing significant resistance and struggling to surpass it. Considering the recent action, a short-term rejection is possible before the next trend.
Technical Analysis
By Shayan
The Daily Chart
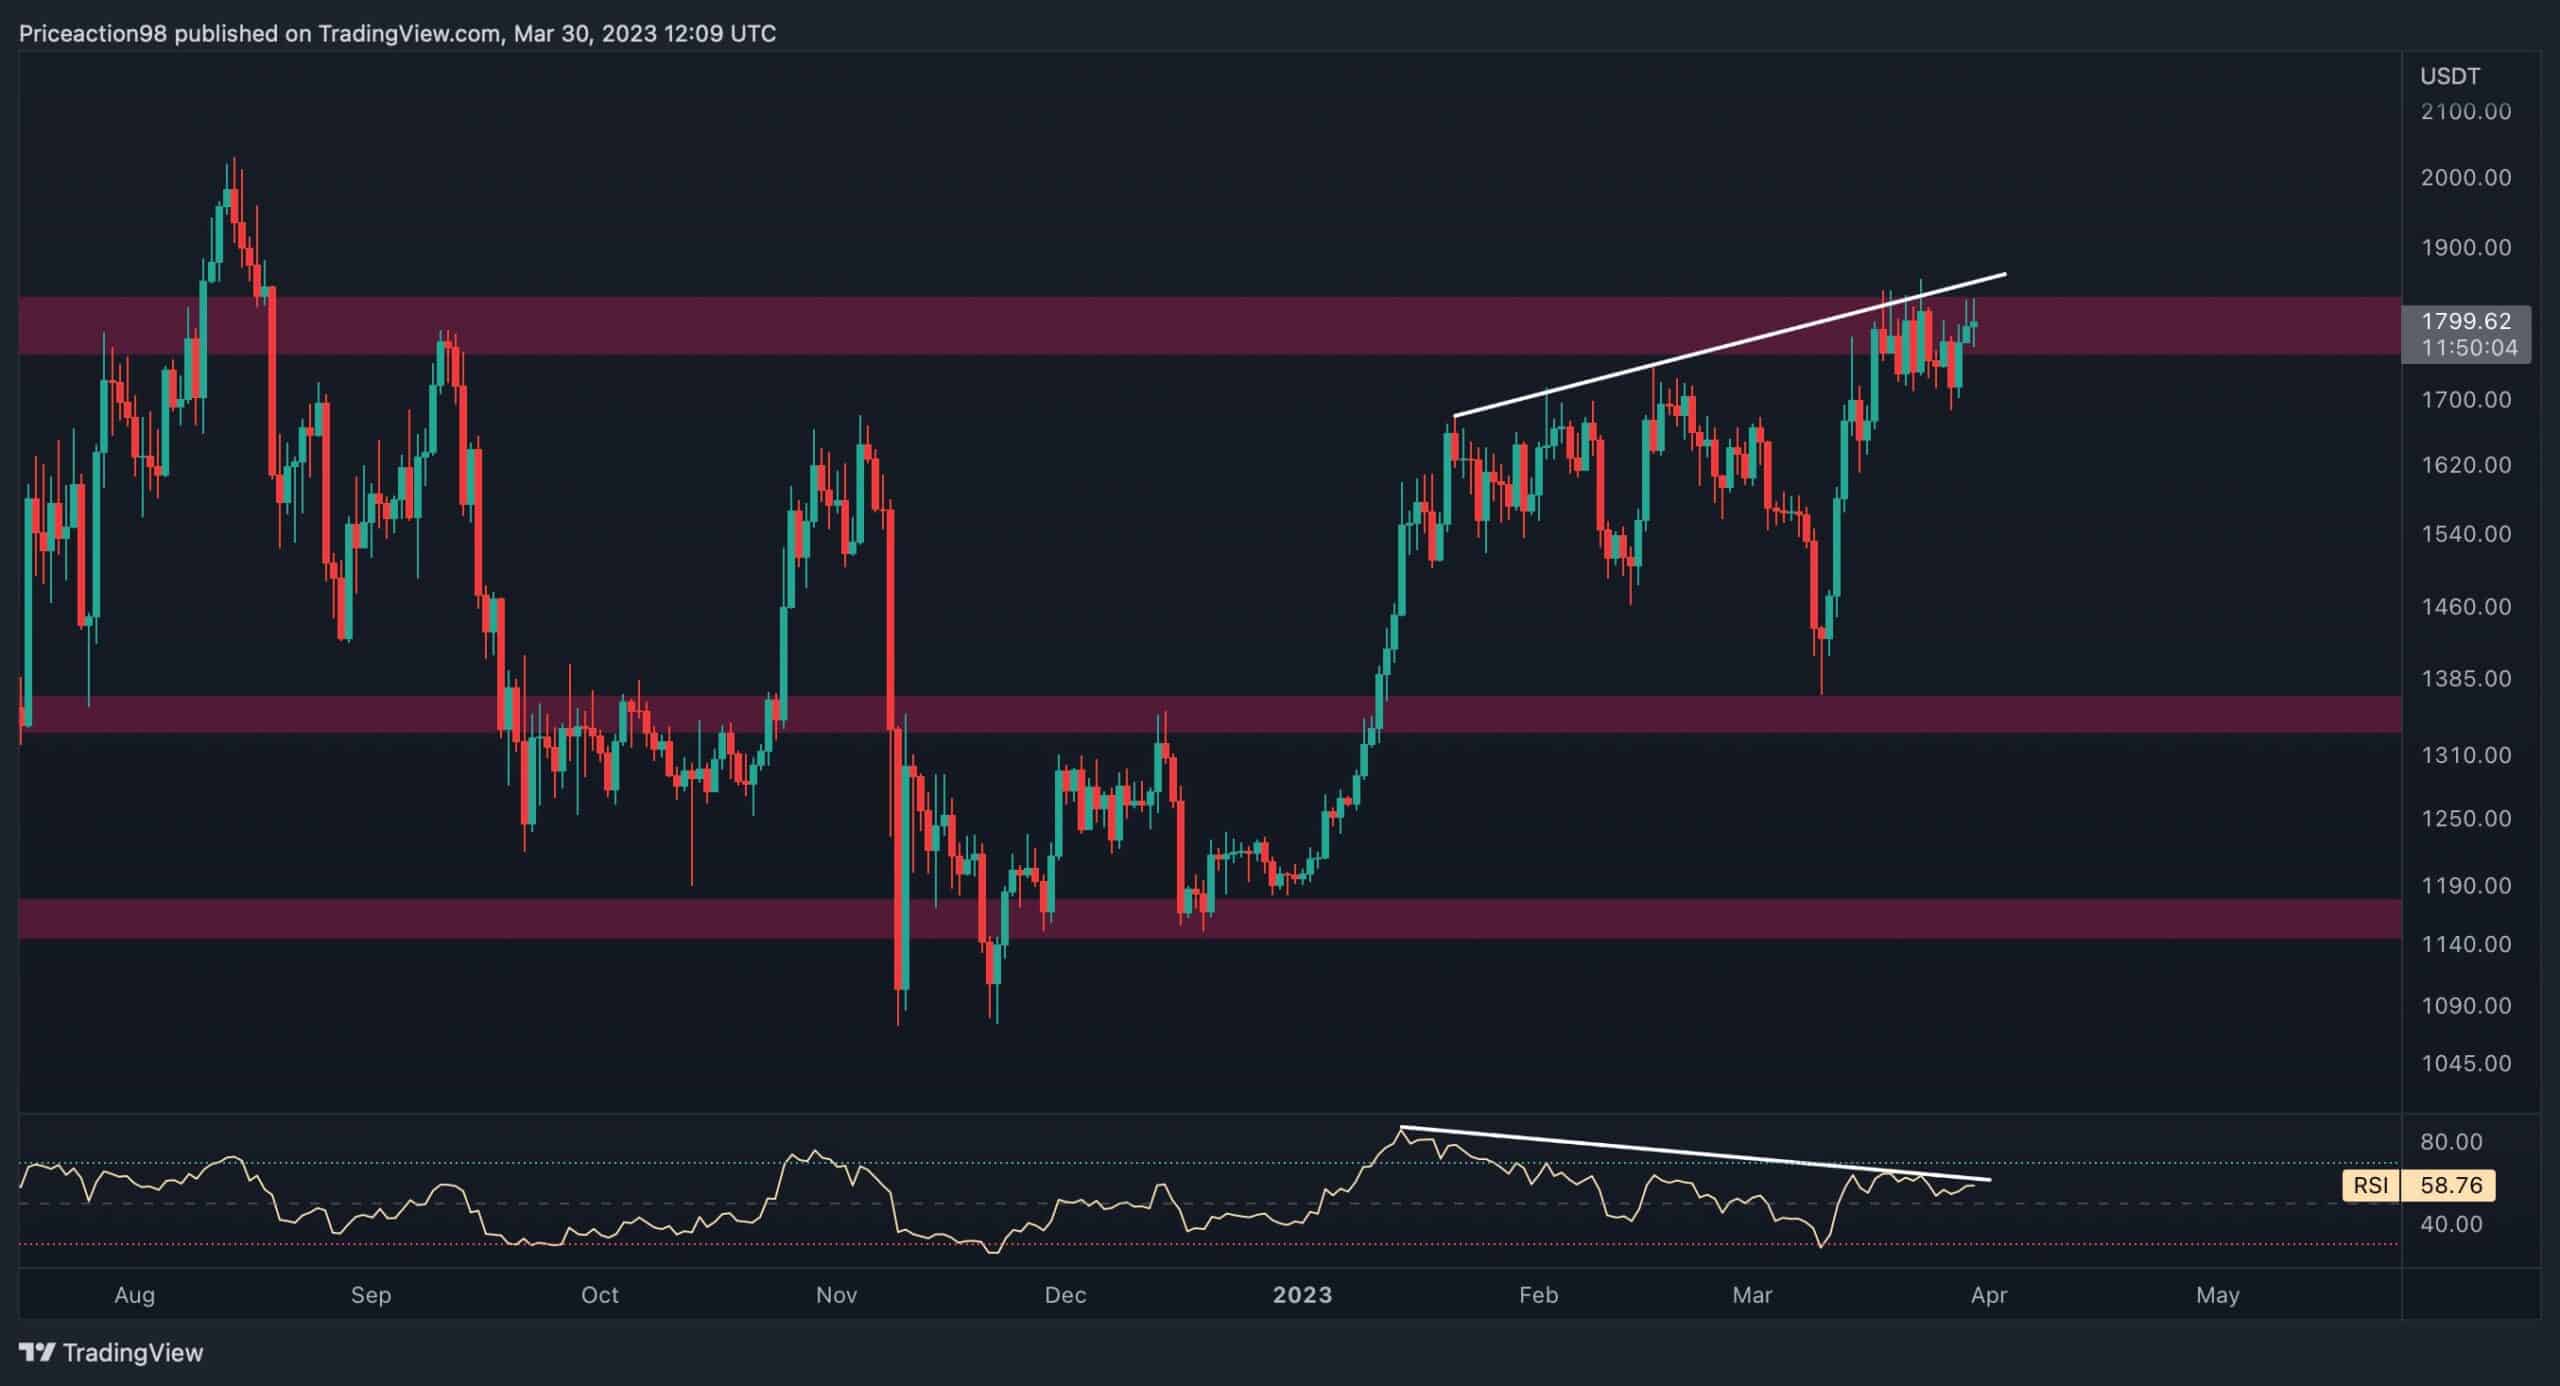
Ethereum bulls are having trouble pushing the price above the significant resistance region of $1.8K. After reaching this crucial range, Ethereum started consolidating with no clear direction, resulting in dull price action.
This indicates a battle between sellers and buyers, and a breakout from this range will likely determine the short-term direction of ETH. Nevertheless, the clear significant bearish divergence between the price and the RSI indicator suggests that there is a higher possibility of the price experiencing a short-term rejection before initiating the next bullish rally.

The 4-Hour Chart
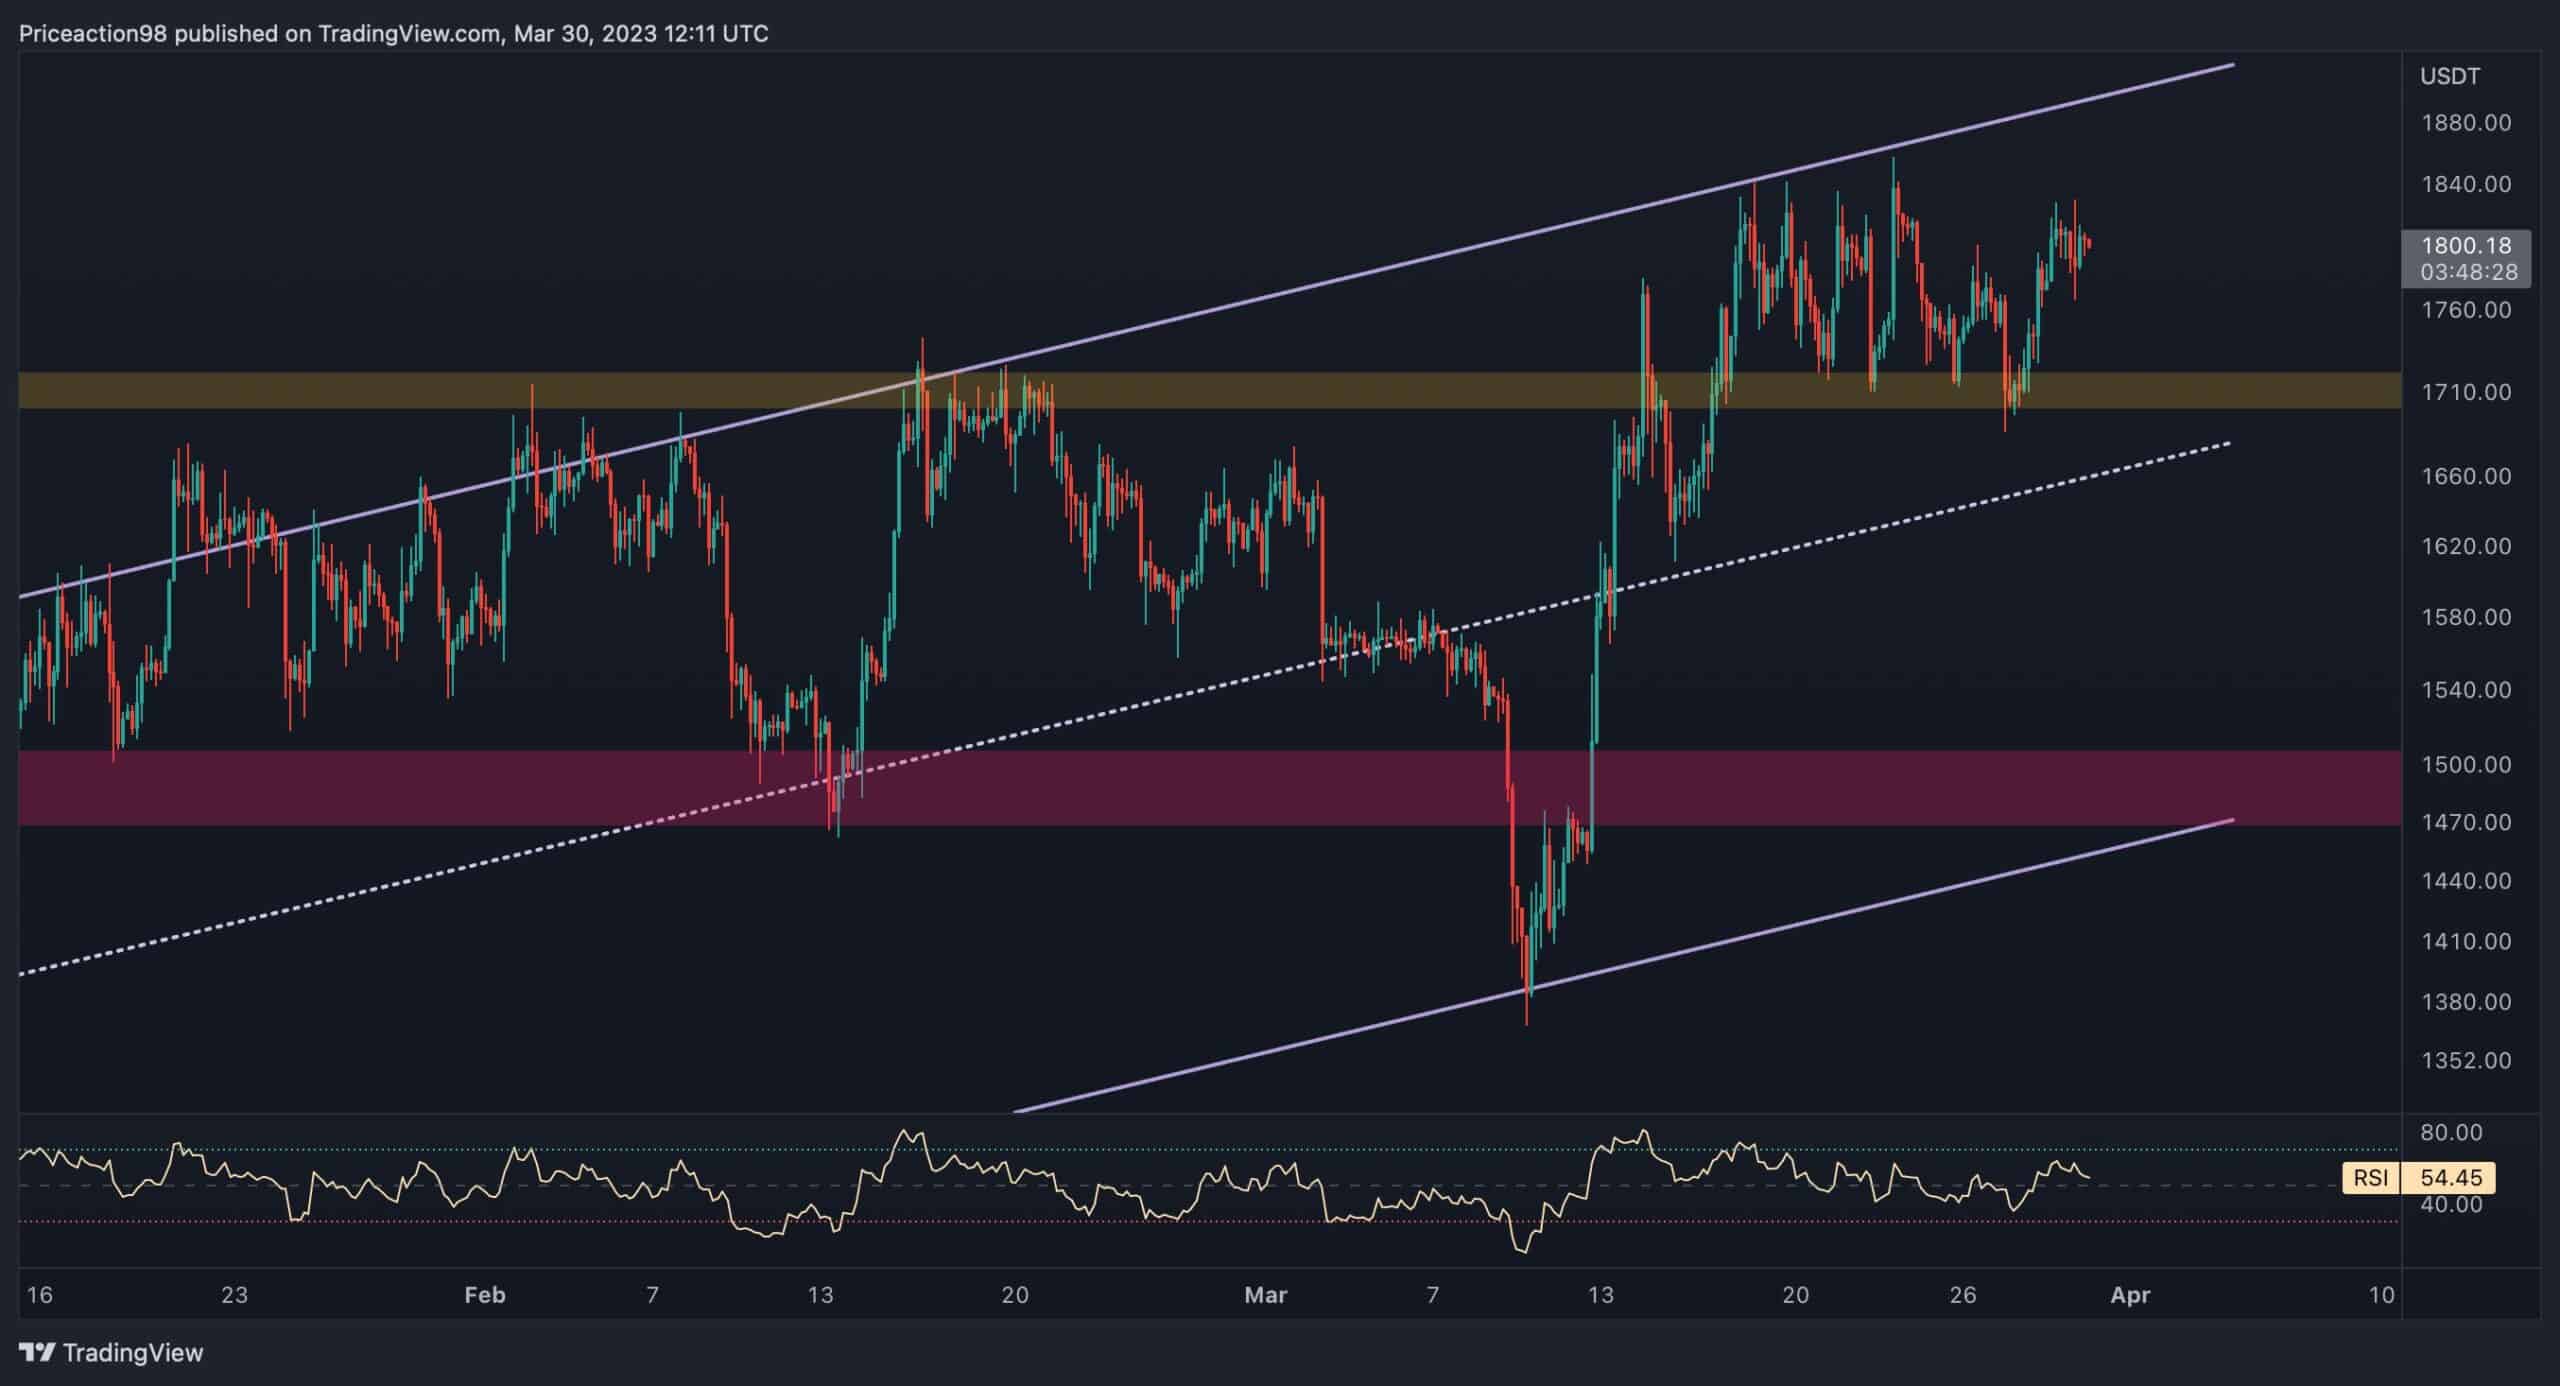
The future short-term direction of Ethereum’s price remains uncertain, with recent action offering no clear indications. However, there are two crucial levels of support and resistance that Ethereum is facing: the $1.7K level as support and the channel’s upper trendline at $1.9K as resistance.
A break above the channel’s upper trendline would signal a bullish turn in the long-term outlook. Conversely, a sharp decline and a fall below the mid-boundary level could indicate a bearish trend, with the next level of support being the $1.5K mark.

On-chain Analysis
By Shayan
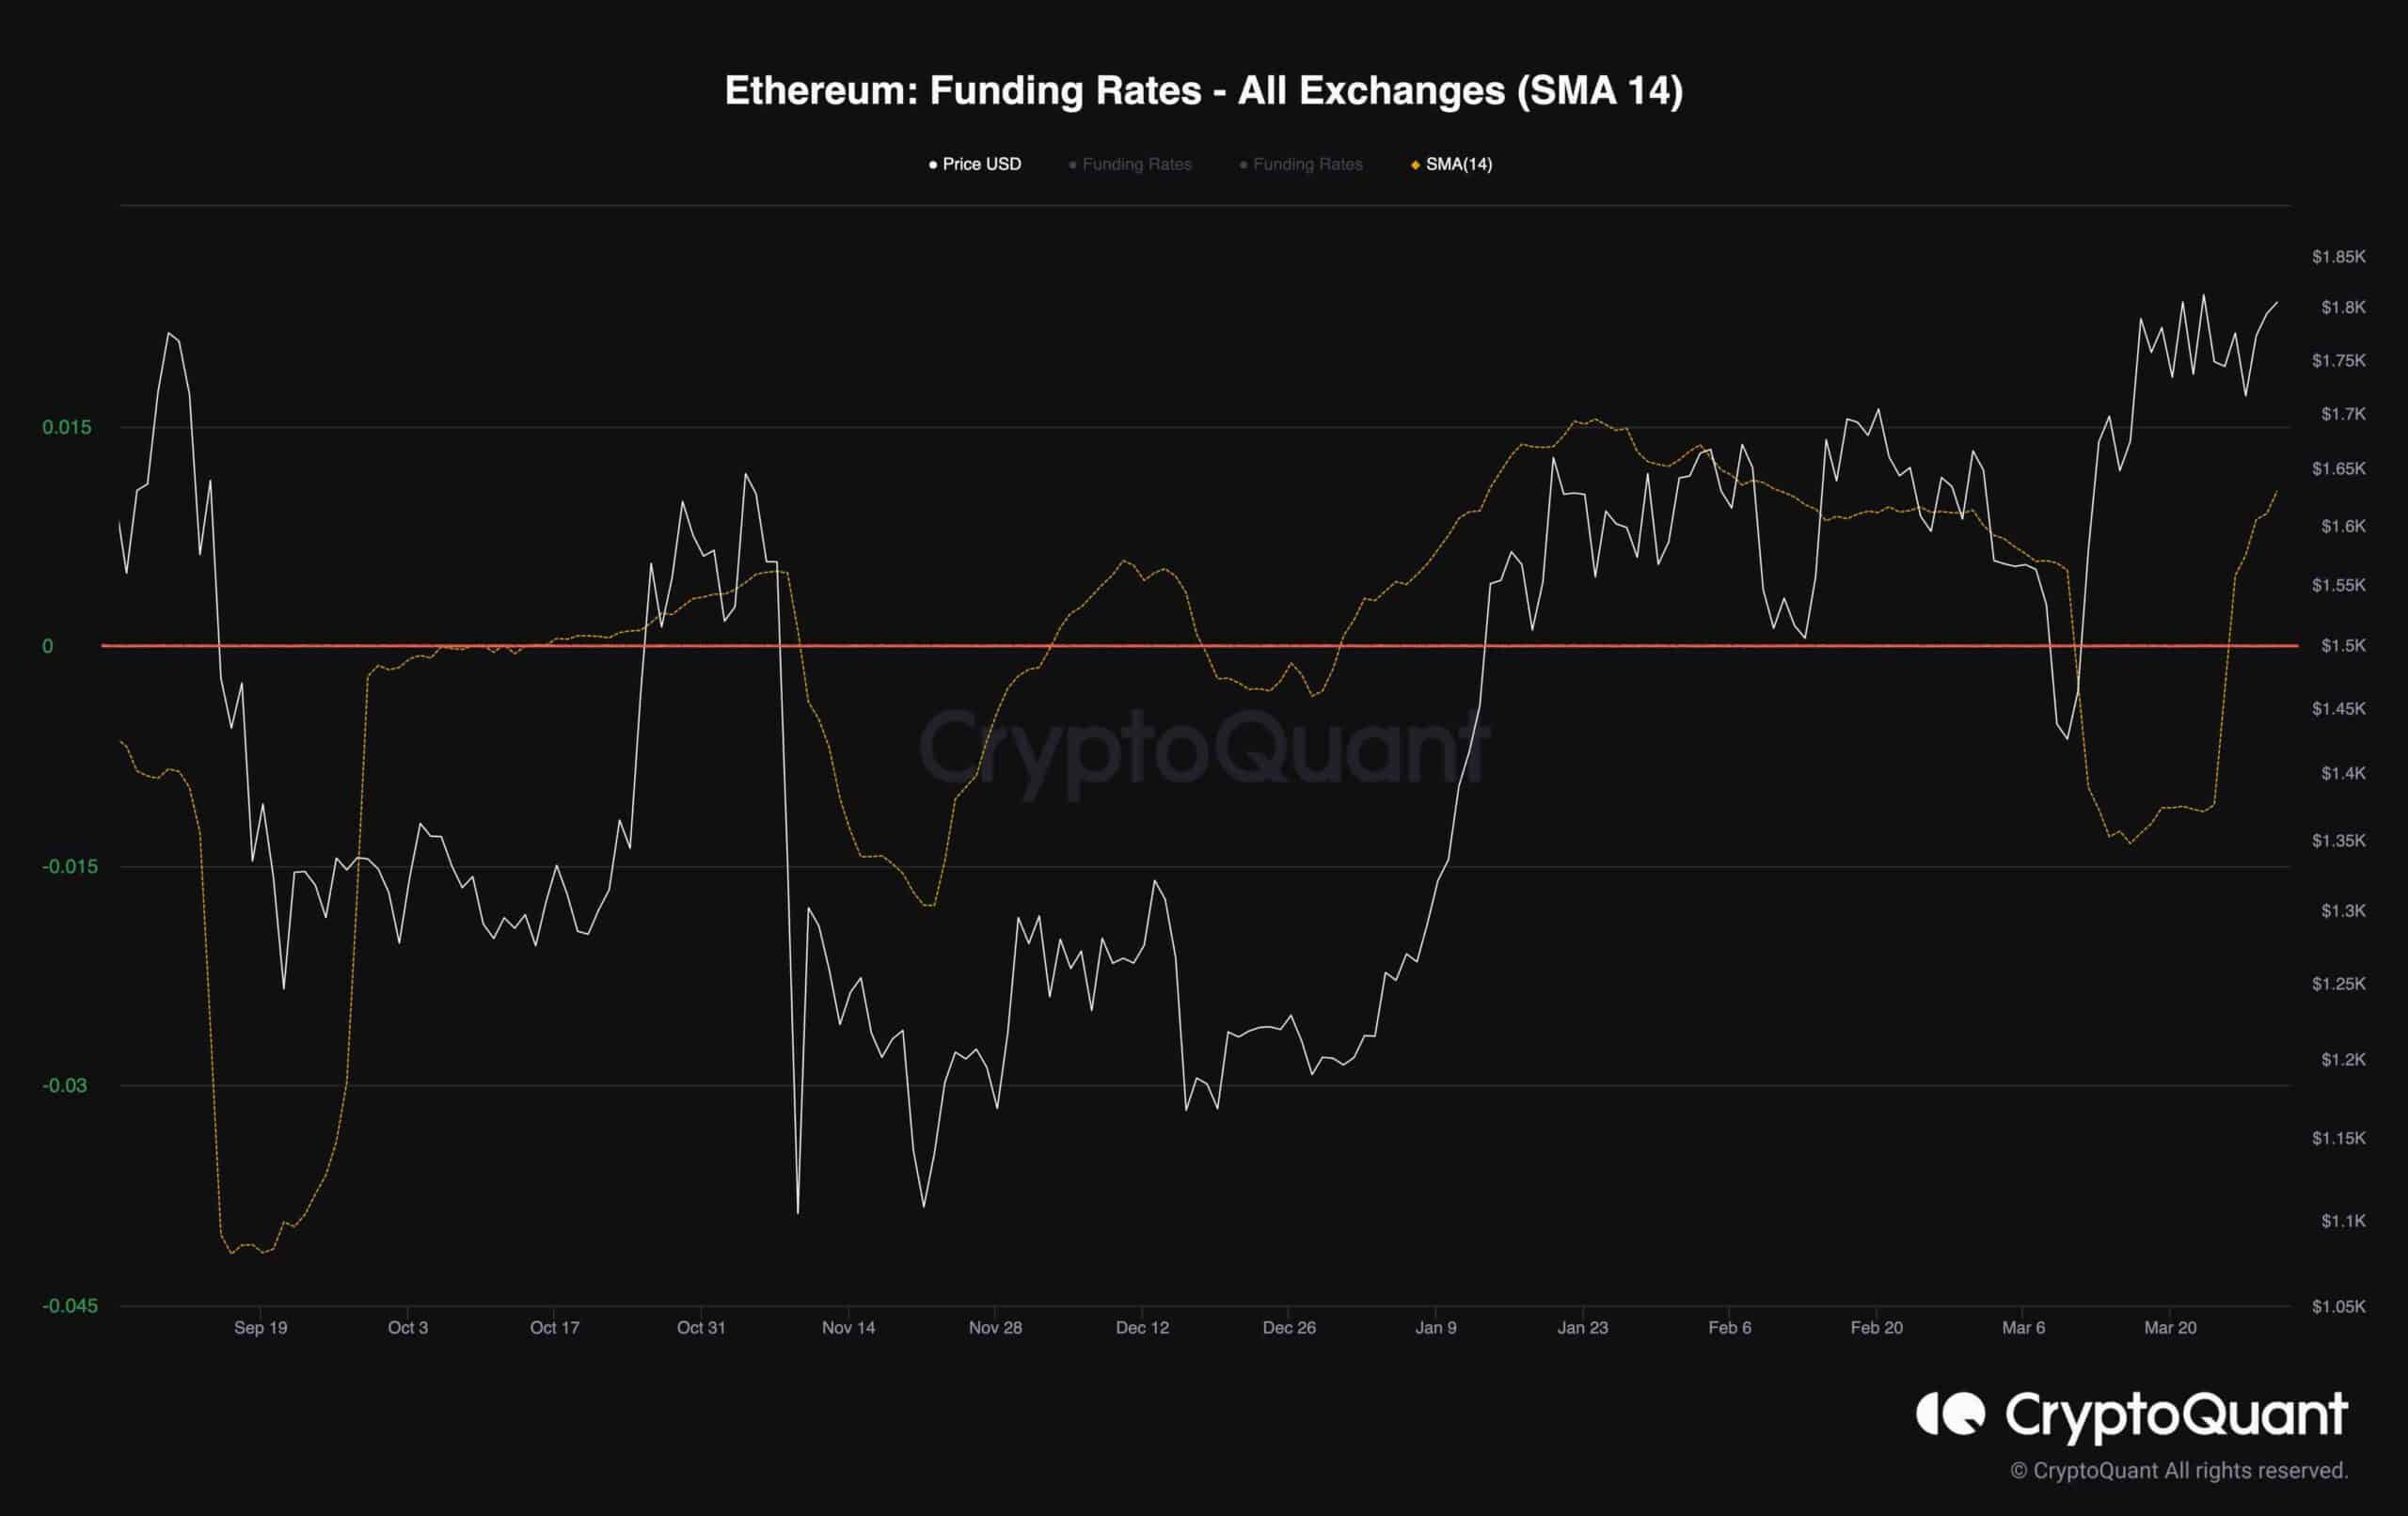
This graph demonstrates the 14-day moving average of the Funding Rates metric alongside Ethereum’s price. Over the past few months, the latter has shown a bullish trend, and the overall market sentiment has turned positive. This shift in sentiment is reflected in the funding rates metric.
However, during a recent shakeout, the funding rate metric also plummeted and dropped below 0 for a short period of time.
Yet, after another bullish price rally, the metric has also reclaimed 0 and turned green, indicating bullish sentiment over the market. Nevertheless, Ethereum’s general bias is bullish for the mid-term, and the metric should be monitored closely to prevent losses due to sudden price drops.

The post ETH Struggles at $1.8K But is a Pullback Incoming? (Ethereum Price Analysis) appeared first on CryptoPotato.


