ETH Stopped at $2.4K as Bears Push for a Correction (Ethereum Price Analysis)
Ethereum’s price is encountering significant resistance around the pivotal $2.4K region, highlighting an ongoing struggle between buyers and sellers.
Despite efforts, the price has been unable to surpass its previous swing high of $2403, leading to a slight pullback and the potential formation of a double-top pattern.
Technical Analysis
By Shayan
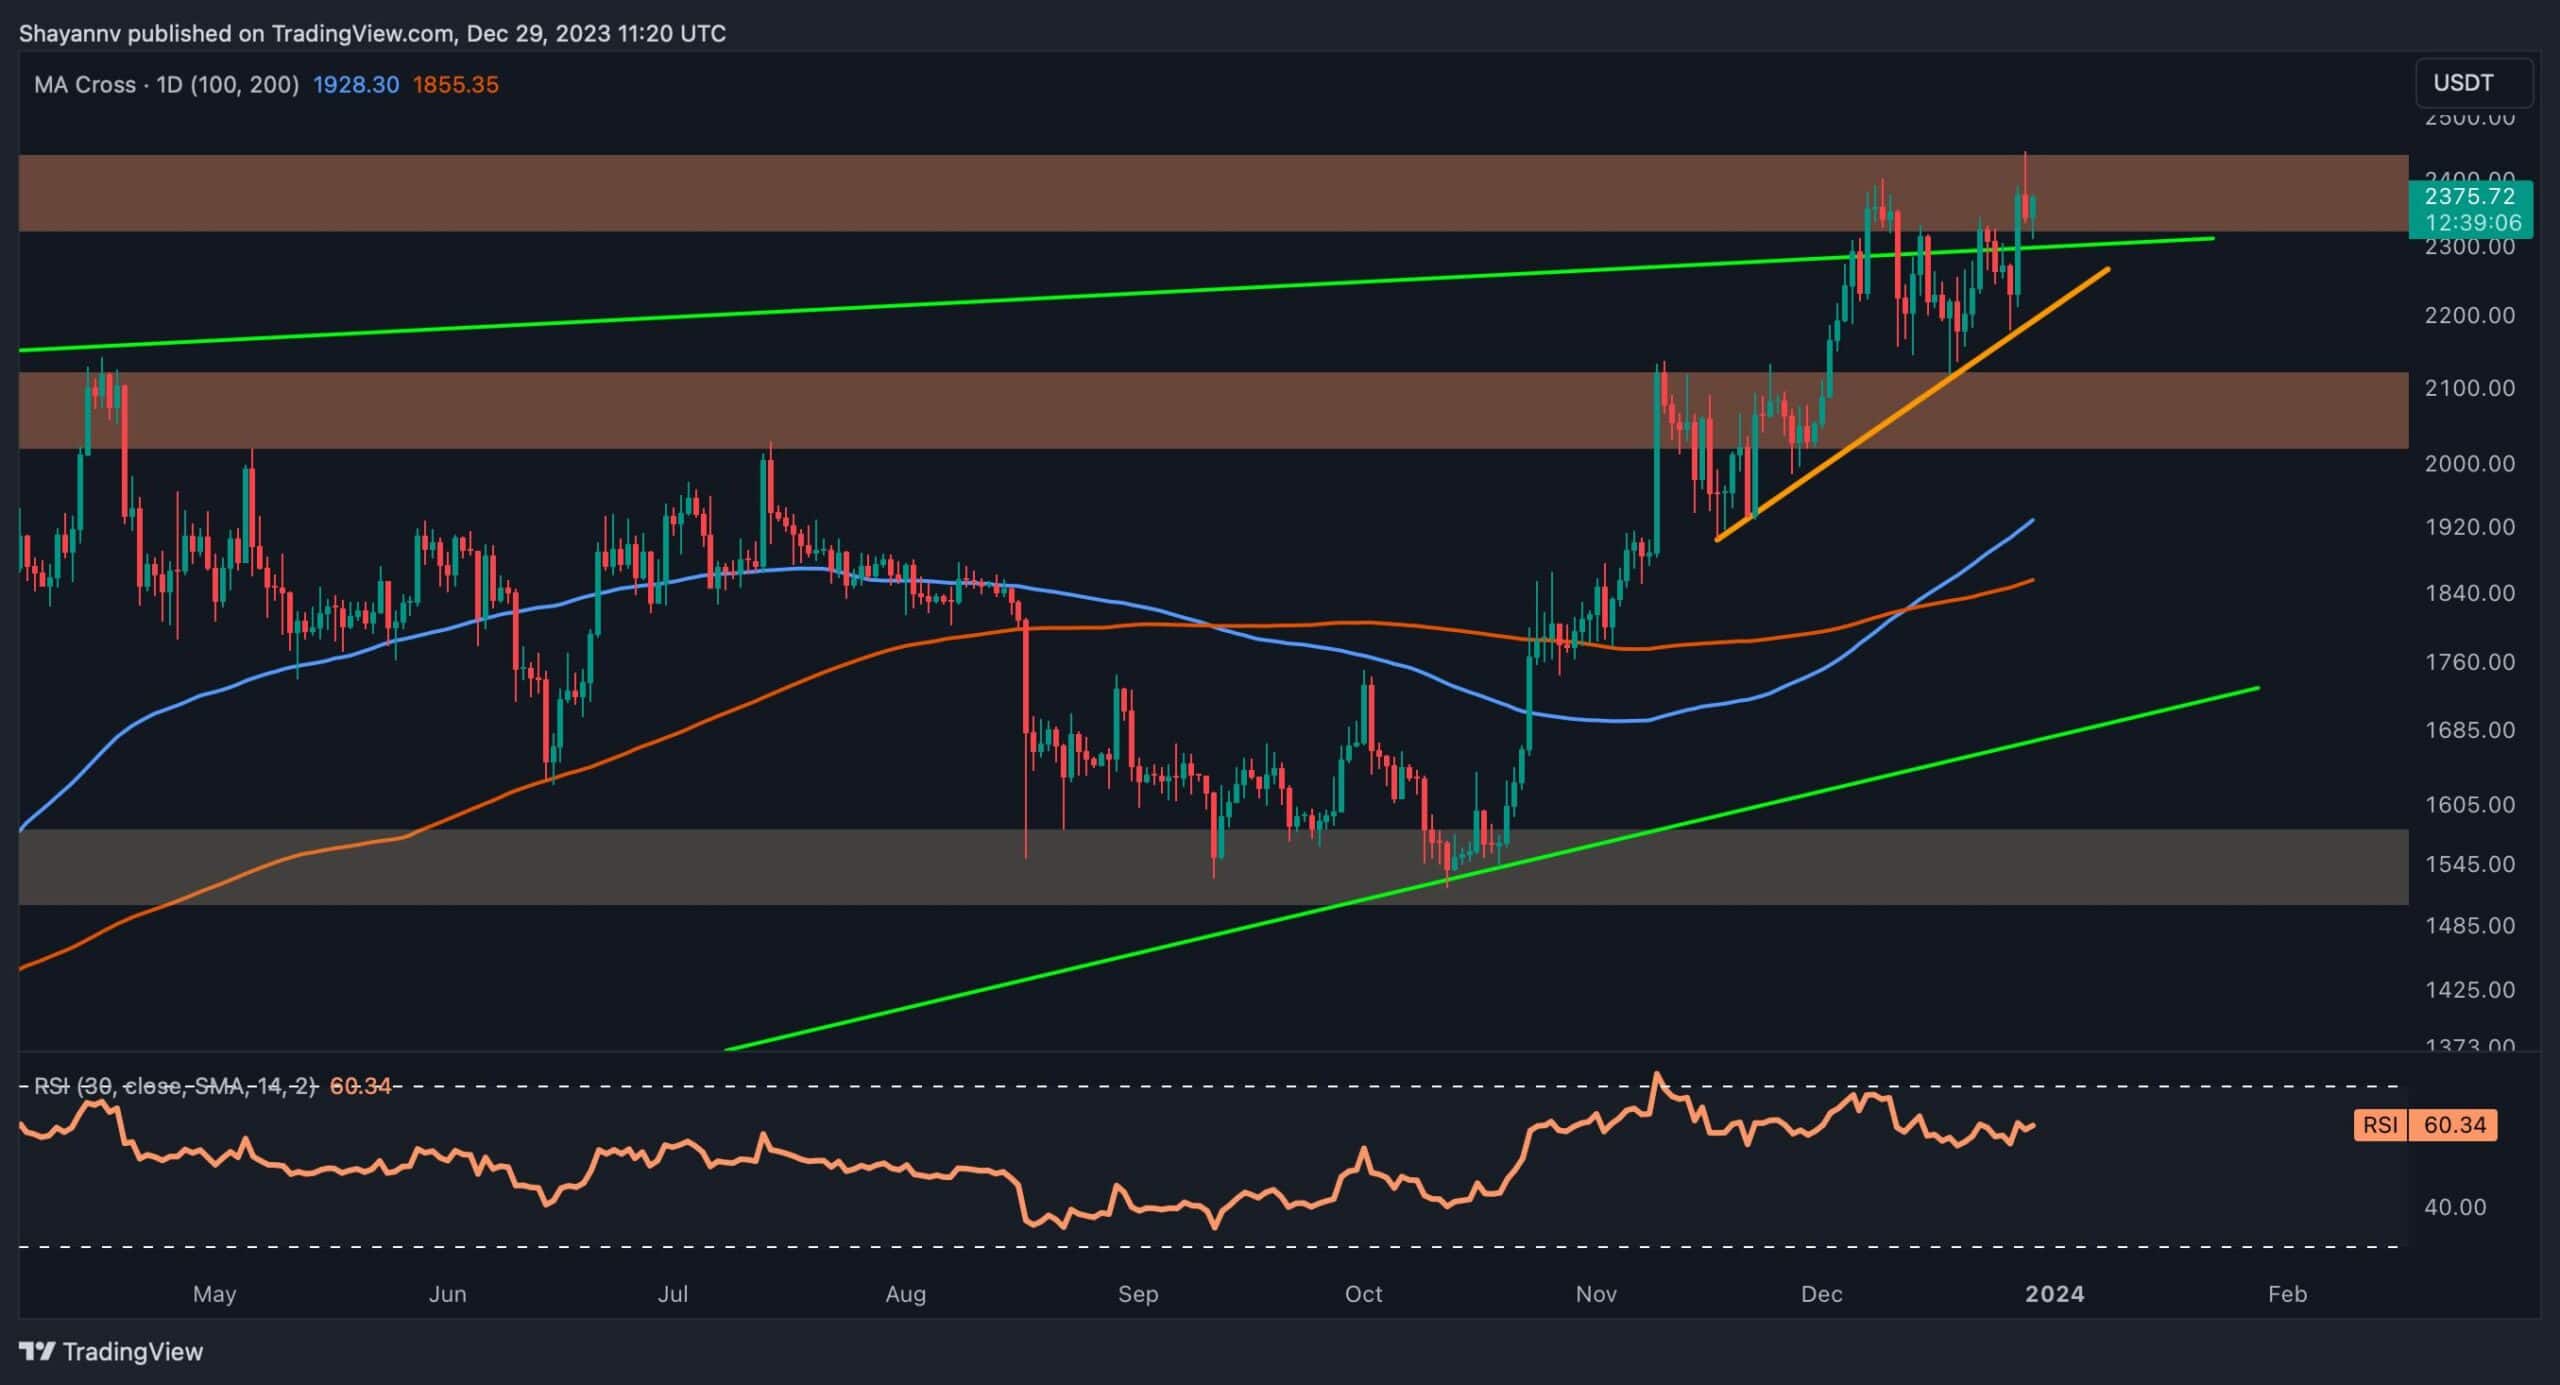
The Daily Chart
After a period of sideways consolidation near the crucial $2.3K mark, the price surged with the aim of reclaiming its previous daily swing high at $2403. This upward movement is underscored by the occurrence of a golden cross on the daily chart, indicating an overall bullish sentiment for Ethereum’s price action.
However, the price faced resistance upon reaching a critical zone formed by the upper boundary of a multi-month wedge, coinciding with the previous daily swing at $2403, thereby forming a potential double-top pattern.
Despite these challenges, the emergence of a potential head and shoulders pattern, a widely recognized bearish reversal formation, is notable. If the price breaks below the neckline of both the head and shoulders pattern and the double-top pattern, it could signal a short-term downward movement. This retracement might lead the price back to the substantial support range at $2K.
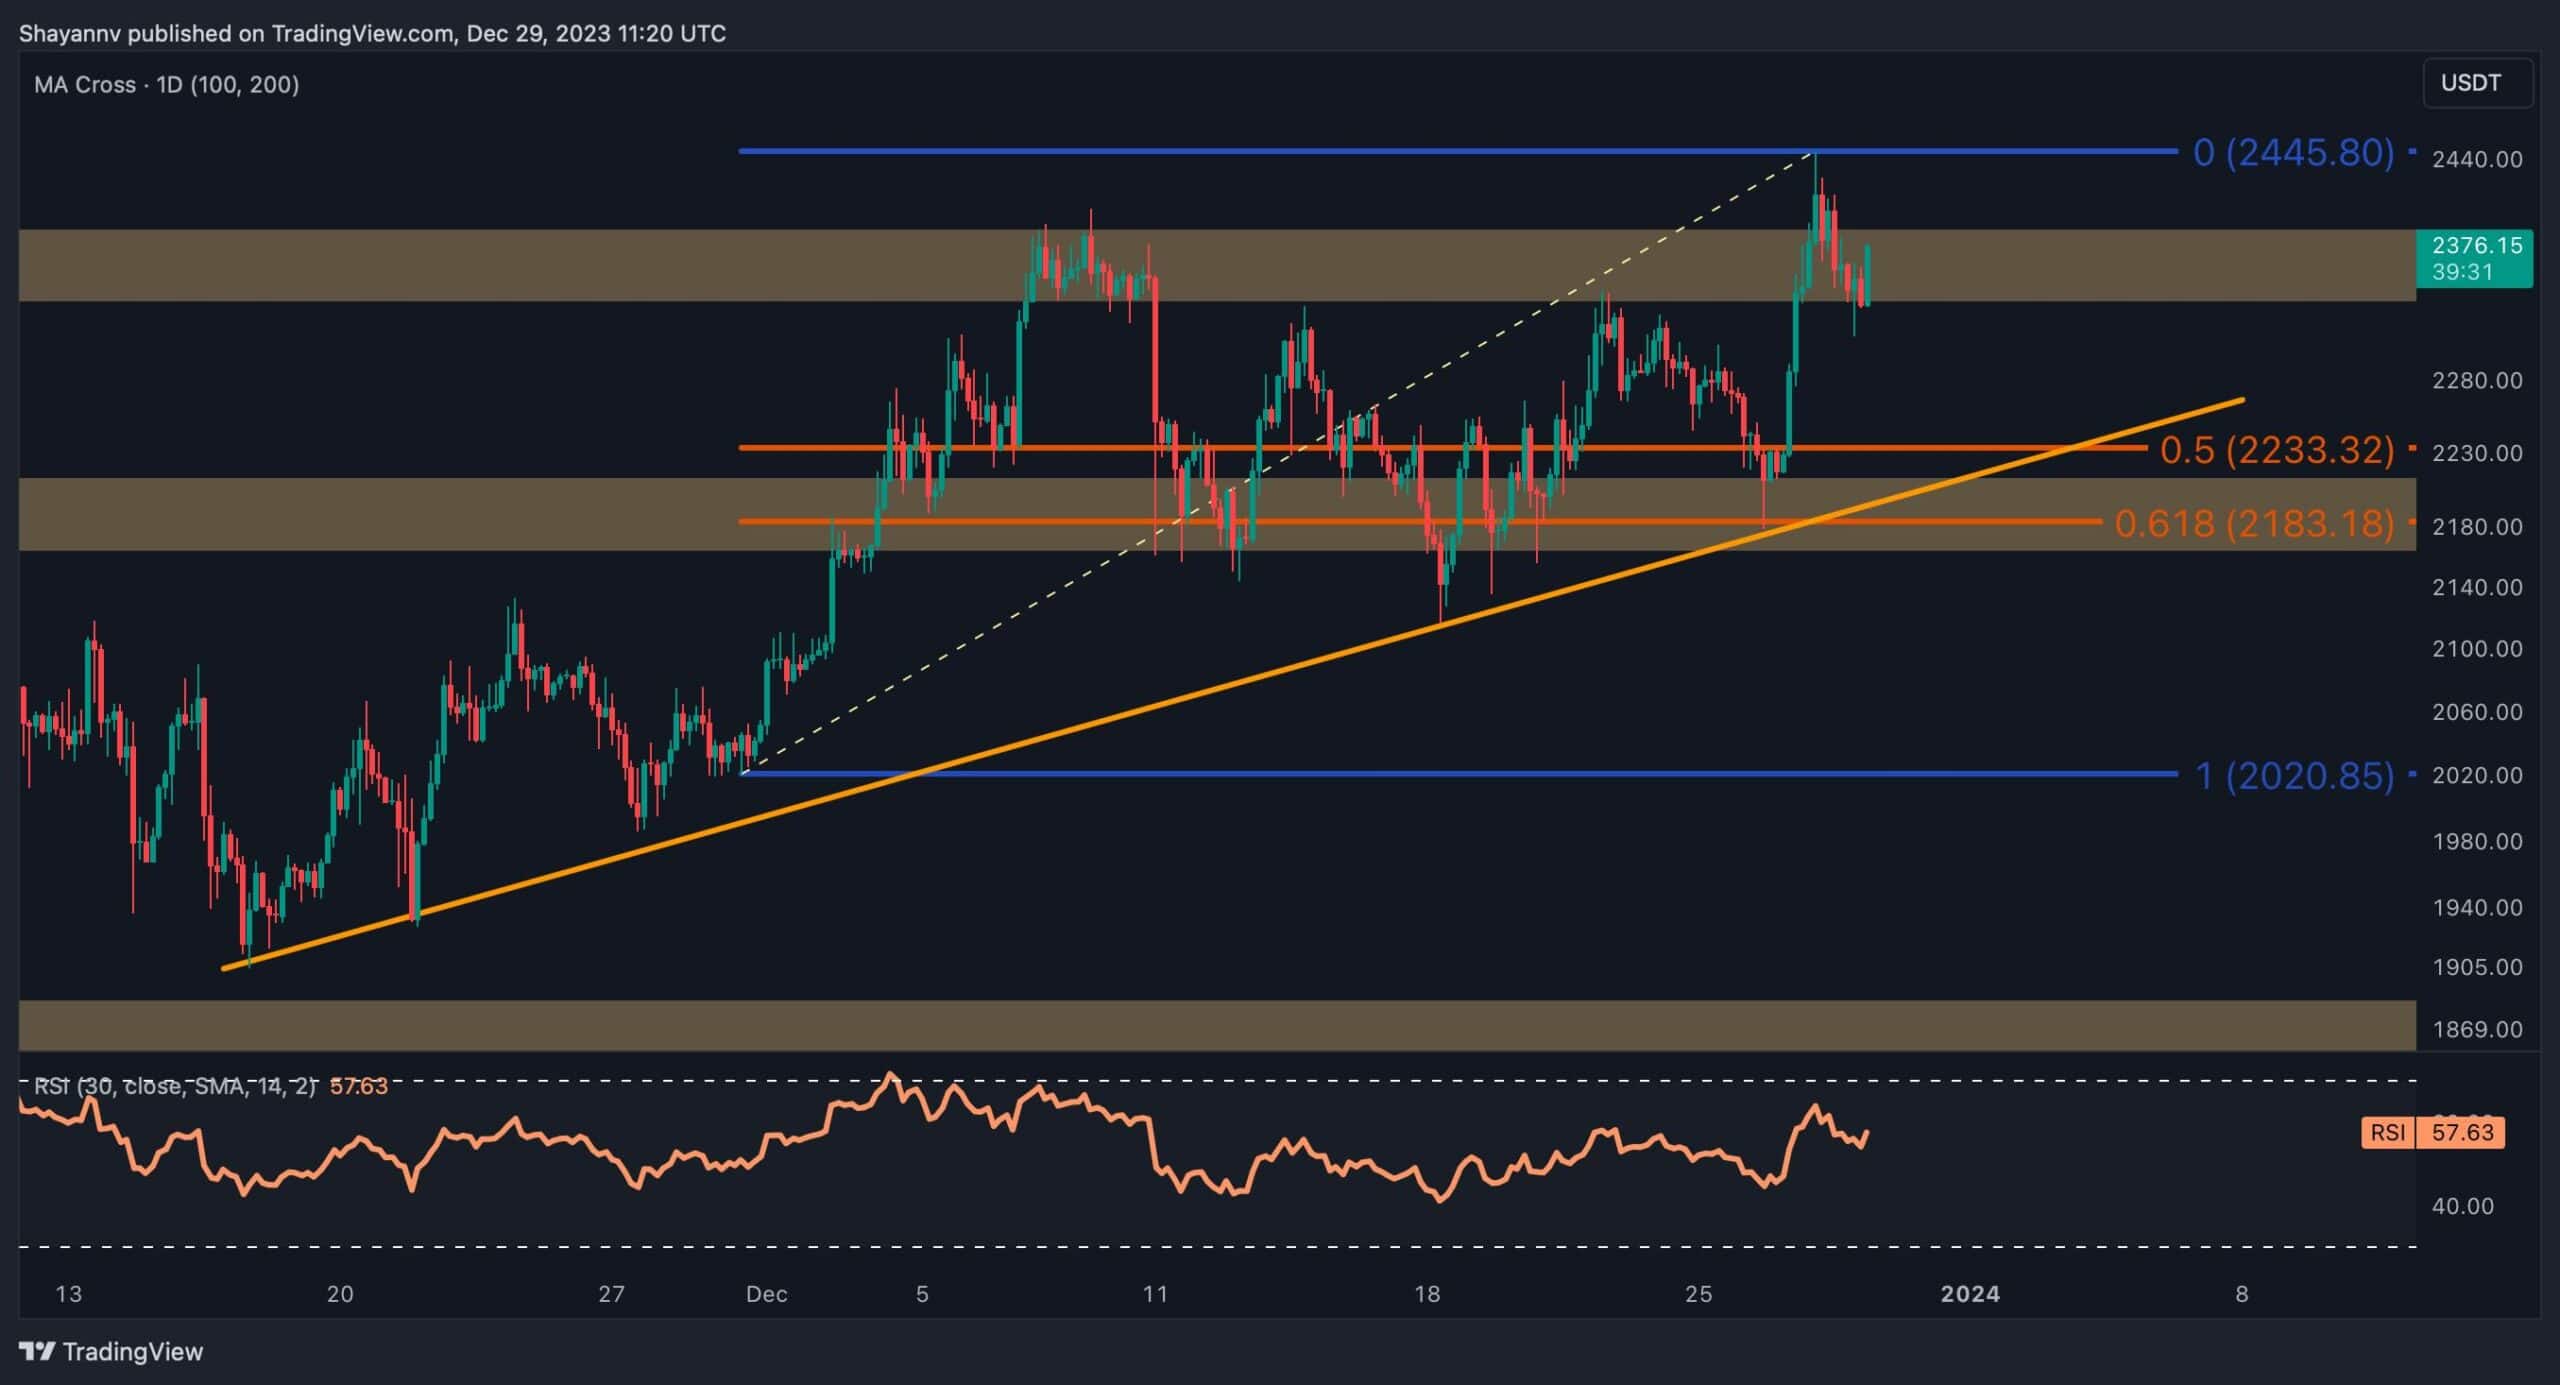
The 4-Hour Chart
A more detailed analysis of the 4-hour chart reveals increased demand within the critical range between the 0.5 ($2,211) and 0.618 ($2,166) levels of the Fibonacci retracement indicator. This demand led to an impulsive price spike attempting to breach the $2.4K daily swing high.
However, Ethereum faced a slight rejection, resulting in a retracement toward the static support level at $2.3K. Despite this retracement, Ethereum’s price appears to be confined within a crucial range, encompassing the significant $2.4K resistance region and the substantial static support range characterized by the 0.5 ($2,211) and 0.618 ($2,166) Fibonacci retracement levels, along with the dynamic support provided by the multi-week ascending trendline.
A breakout in either direction from this range could signal the initiation of a new impulsive trend.
On-chain Analysis
By Shayan
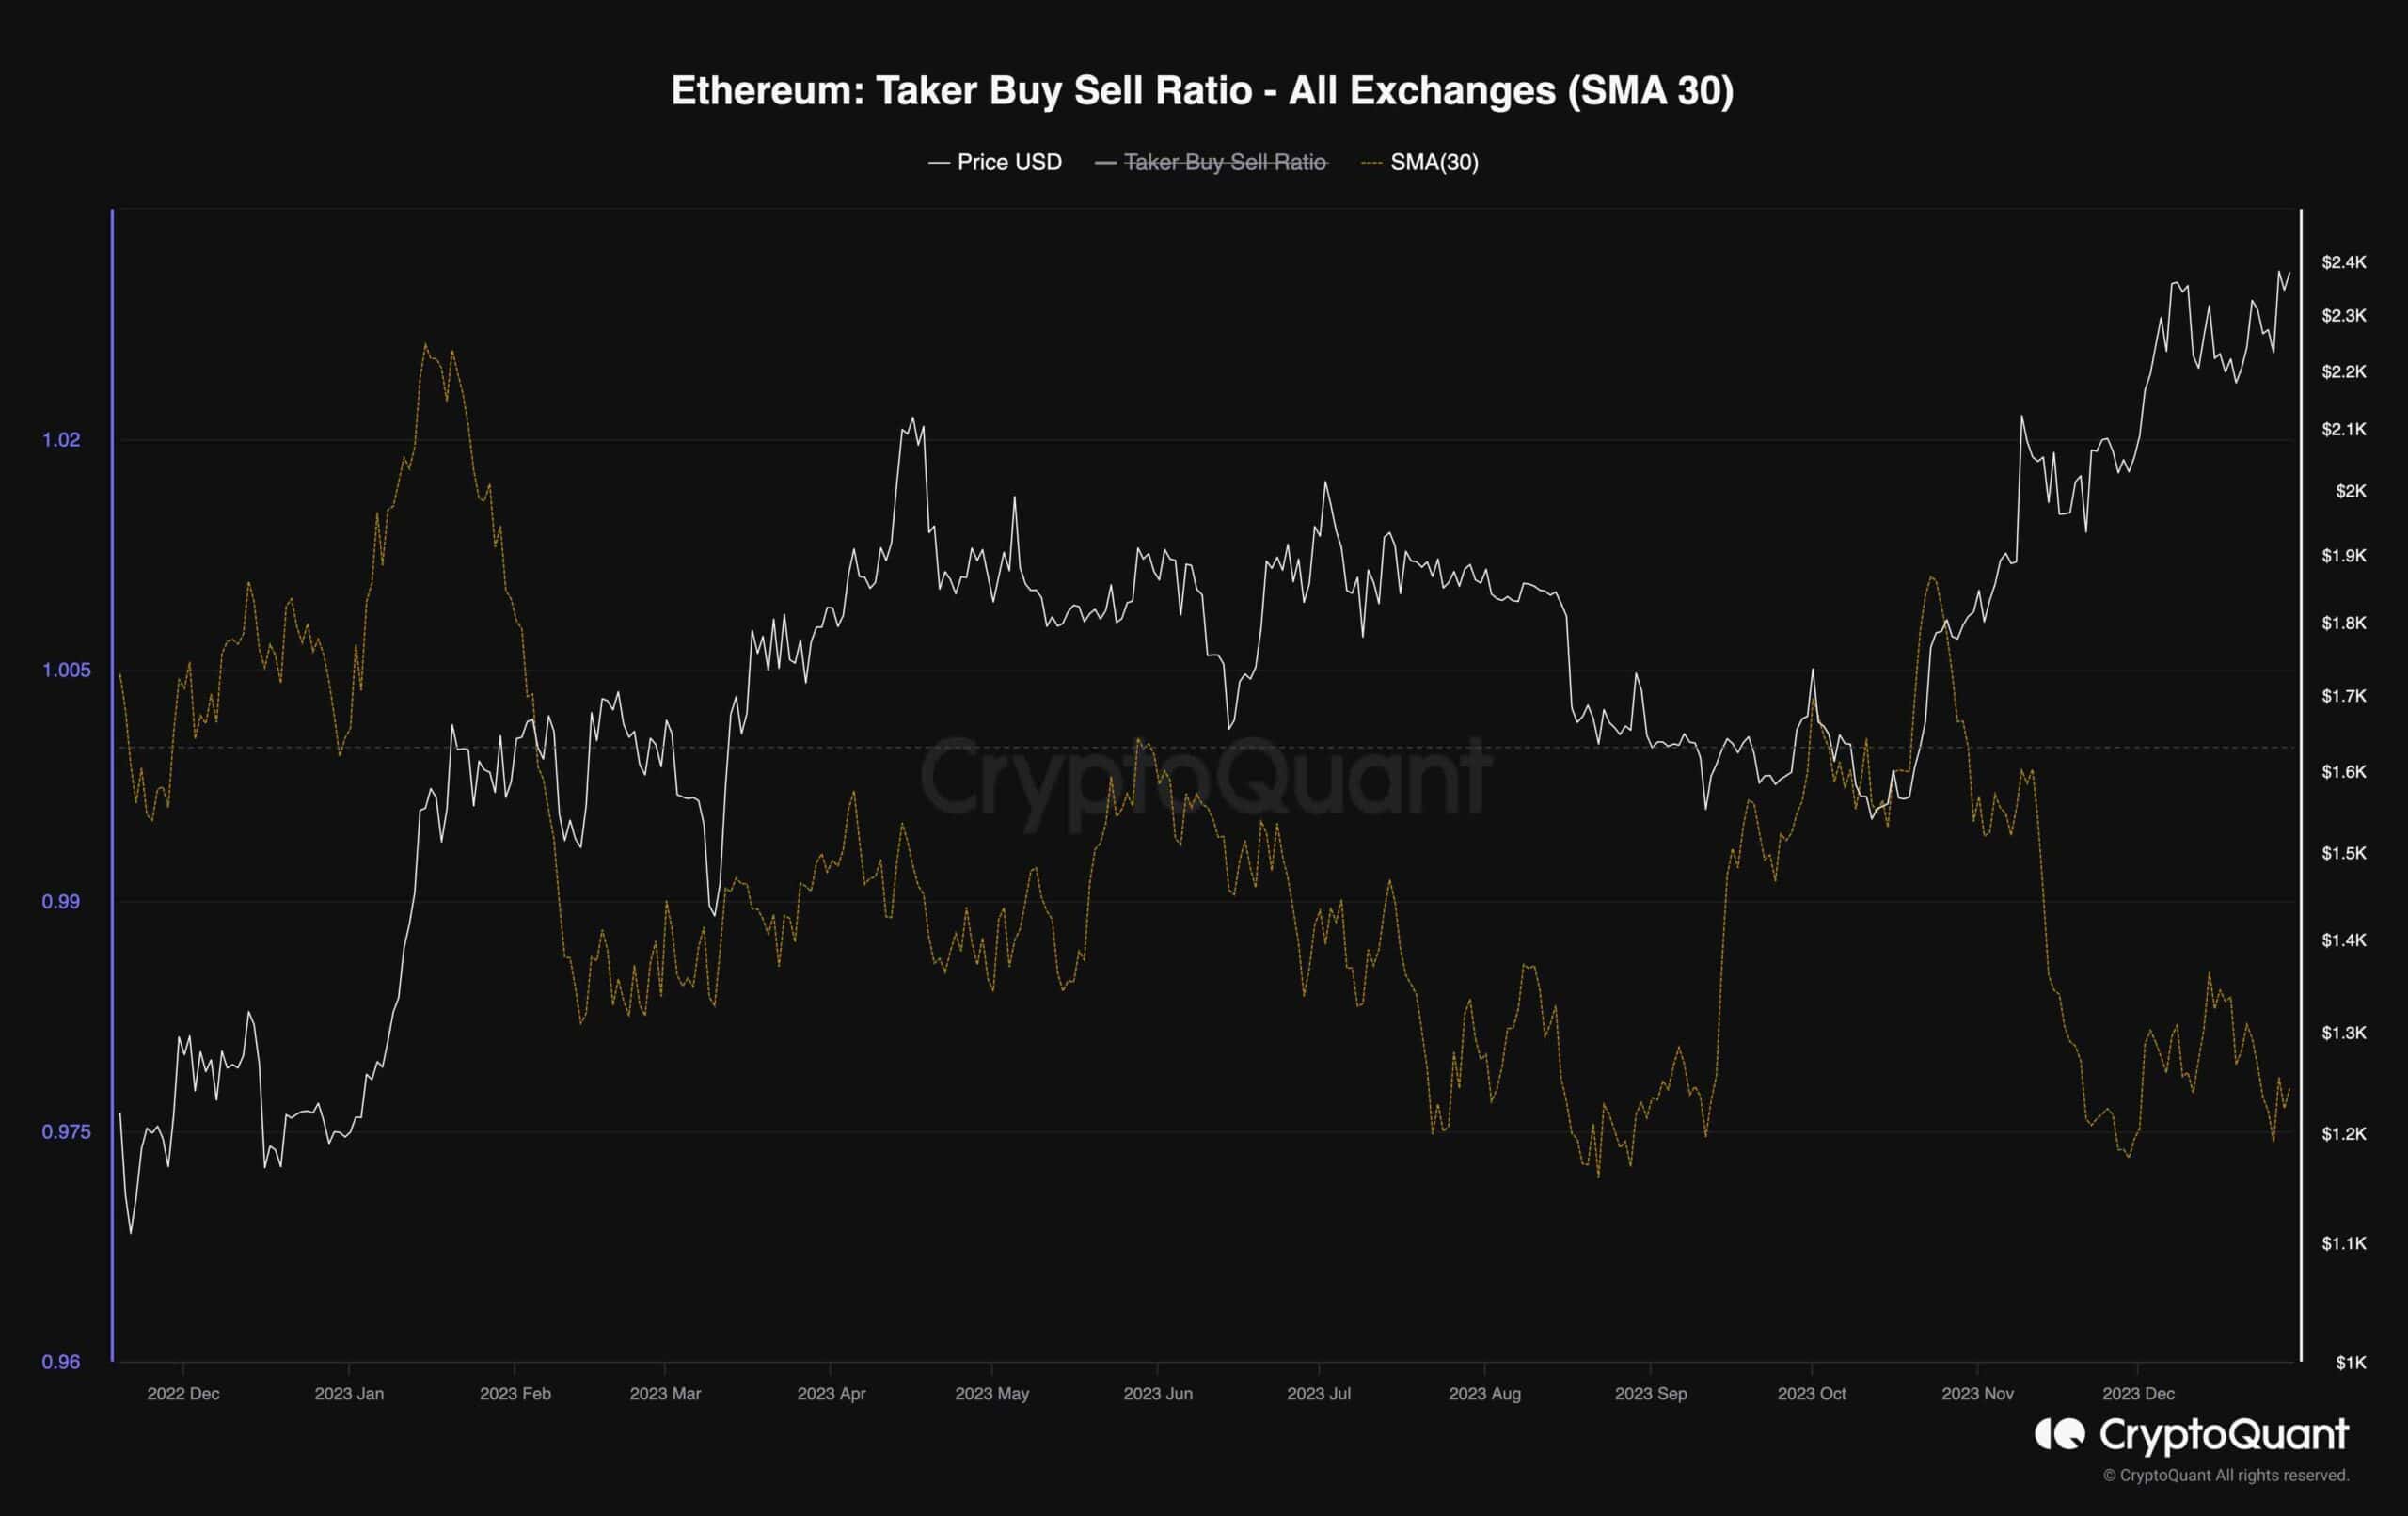
Within the domain of on-chain data analysis, exploring the sentiment reflected in the futures market provides valuable insights into Ethereum’s overarching perspective.
The provided chart portrays the 30-day standard moving average of the Ethereum taker buy-sell ratio. This metric indicates whether buyers or sellers are executing more aggressively on aggregate (taker orders). Values below 1 are perceived as bearish, while values above 1 are indicative of bullish sentiment.
Upon examination of the chart, a notable trend emerges: the taker buy-sell ratio has consistently remained below 1 over the past six months.
Despite the recent uptrend in price, the metric has entered a consolidation phase, signaling an overall bearish sentiment among futures traders. Should the taker buy-sell ratio suddenly surge above 1 again, it would suggest a shift to a full-fledged bull market, potentially propelling the price to new yearly highs.
The post ETH Stopped at $2.4K as Bears Push for a Correction (Ethereum Price Analysis) appeared first on CryptoPotato.