ETH Price Analysis: This is the Next Support for Ethereum if $1,000 Fails
Ethereum once again failed to initiate a serious rally towards recovery and is found plunging towards the coveted $1,000 mark/
Technical Analysis
By Grizzly
The Daily Chart
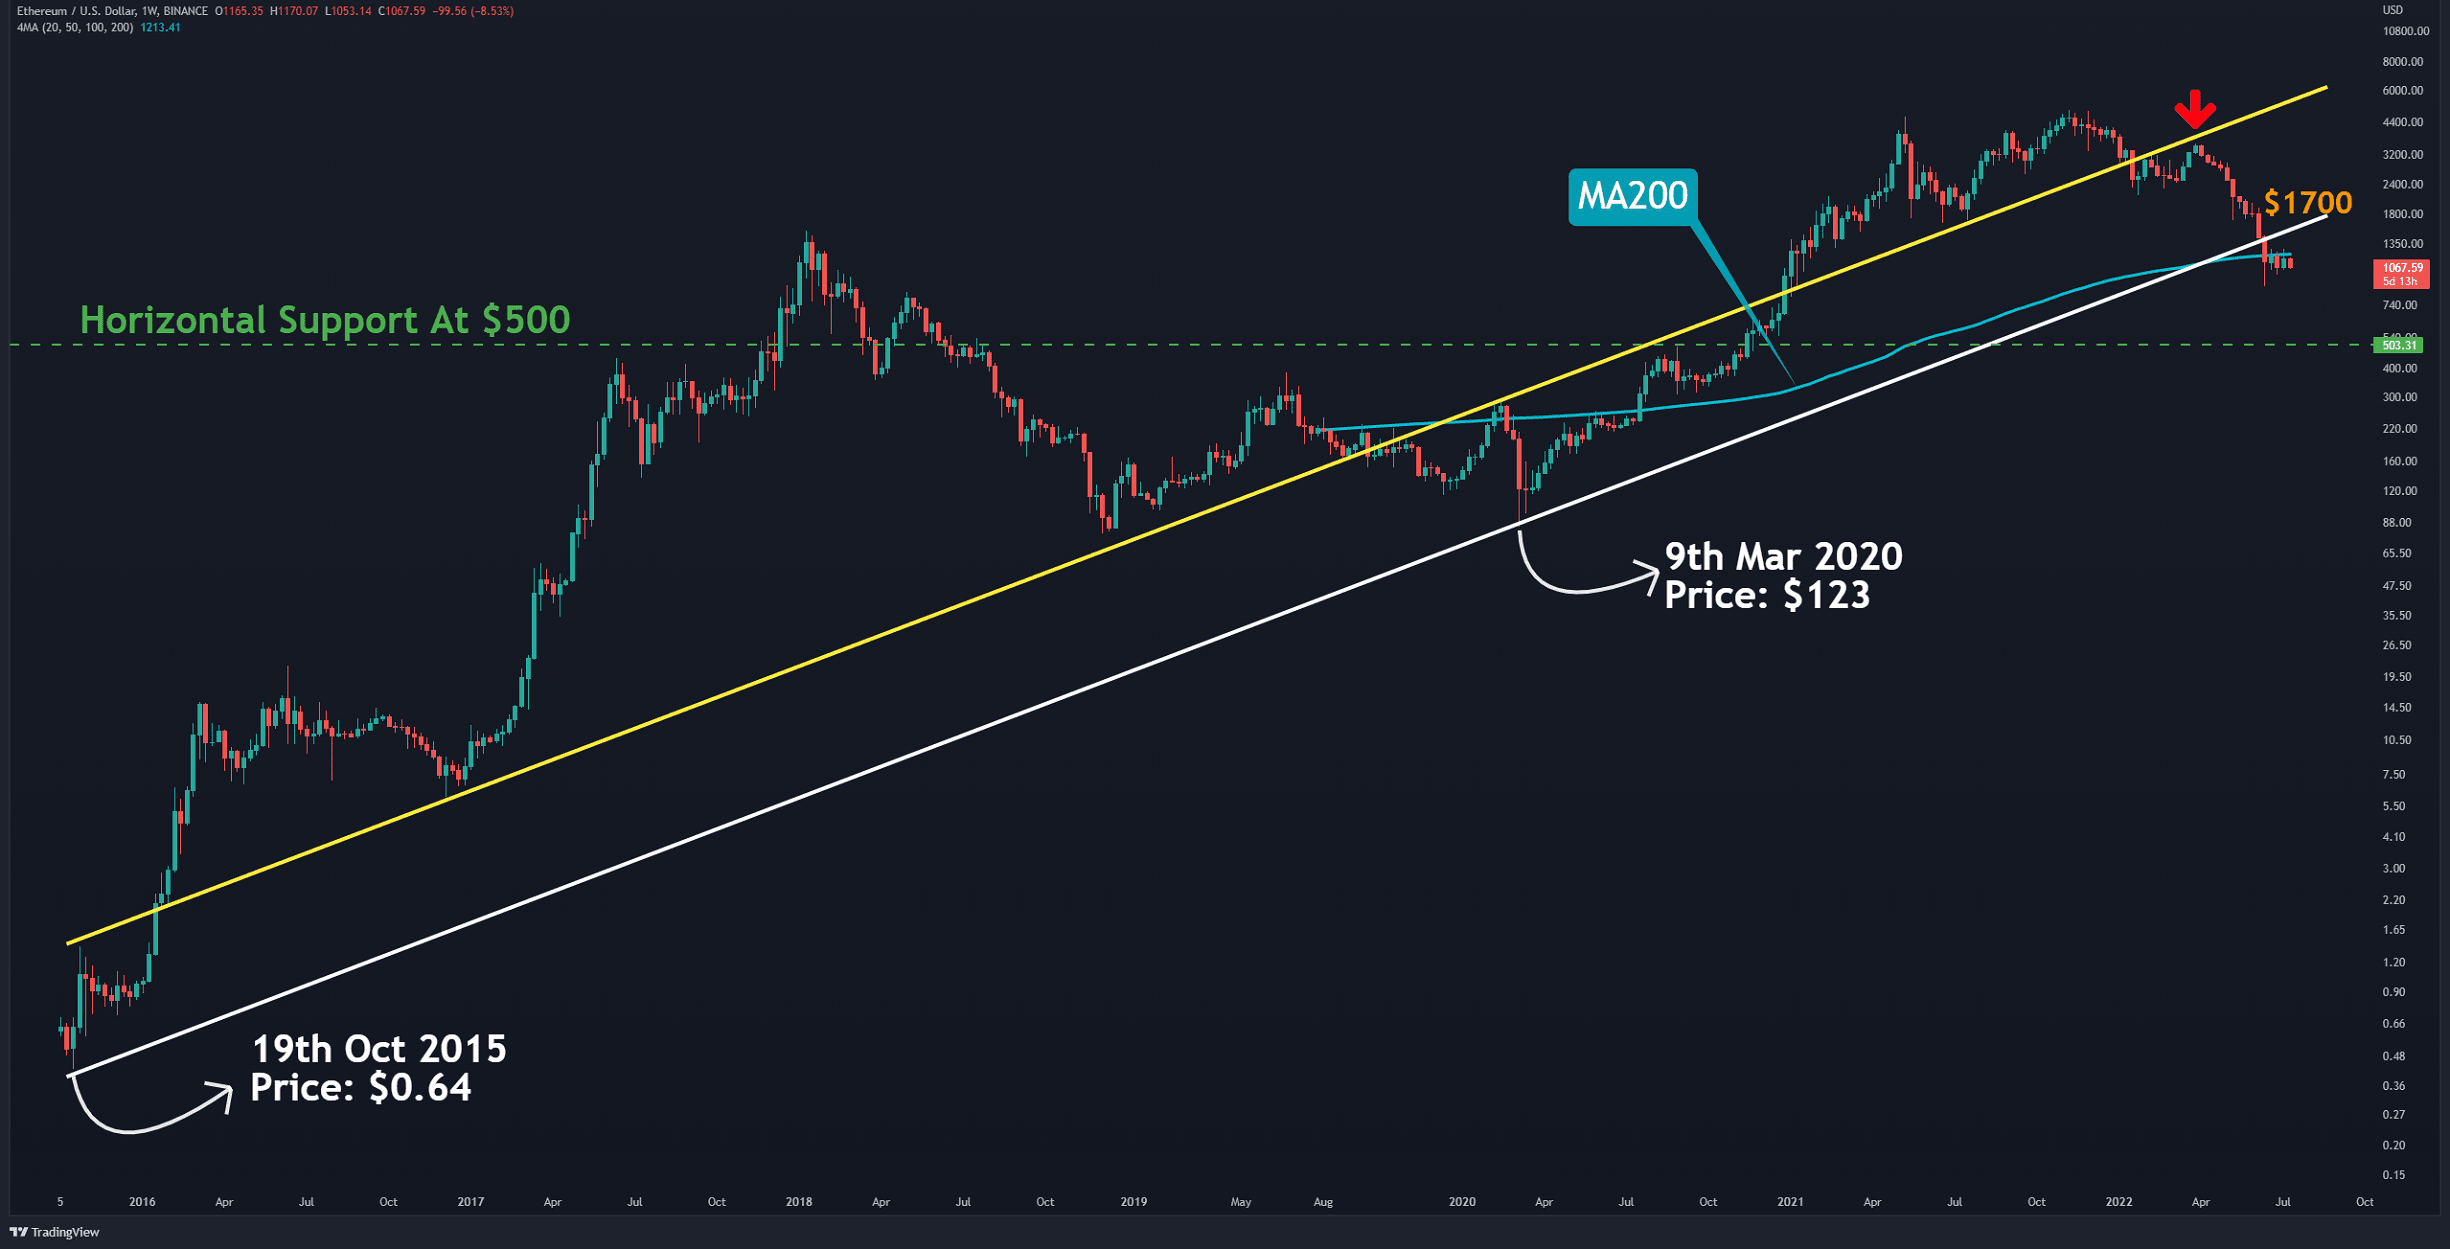
On the weekly timeframe, there are two main ascending lines since Ethereum first started trading on Binance in 2015. The yellow line acts as both support and resistance level, and the white line acted as support before the price drops below $1,500. The 200-week moving average line (in light blue) is also indicated to underline the significance of the current price with respect to historical market valuation.
If a bullish scenario plays out, the bulls would break above the MA200, which lies at $1200 and follow up with a recovery above the resistance zone at $1300-$1500 before finally consolidating above $1700 and breaking the white trendline. Nevertheless, considering the uncertainty in the macro landscape due to the possibility of a recession and the lack of liquidity, it seems like a difficult mission.
On the other hand, if the bears can push the price below the support zone at $880-$1000, then reaching the horizontal support at $500 (in green) will not be out of the questions.
Key Support Levels: $1000 & $880
Key Resistance Levels: $1280 & $1540 & $1700

Daily Moving Averages:
MA20: $1148
MA50: $1401
MA100: $2053
MA200: $2534
The 4-Hour Chart
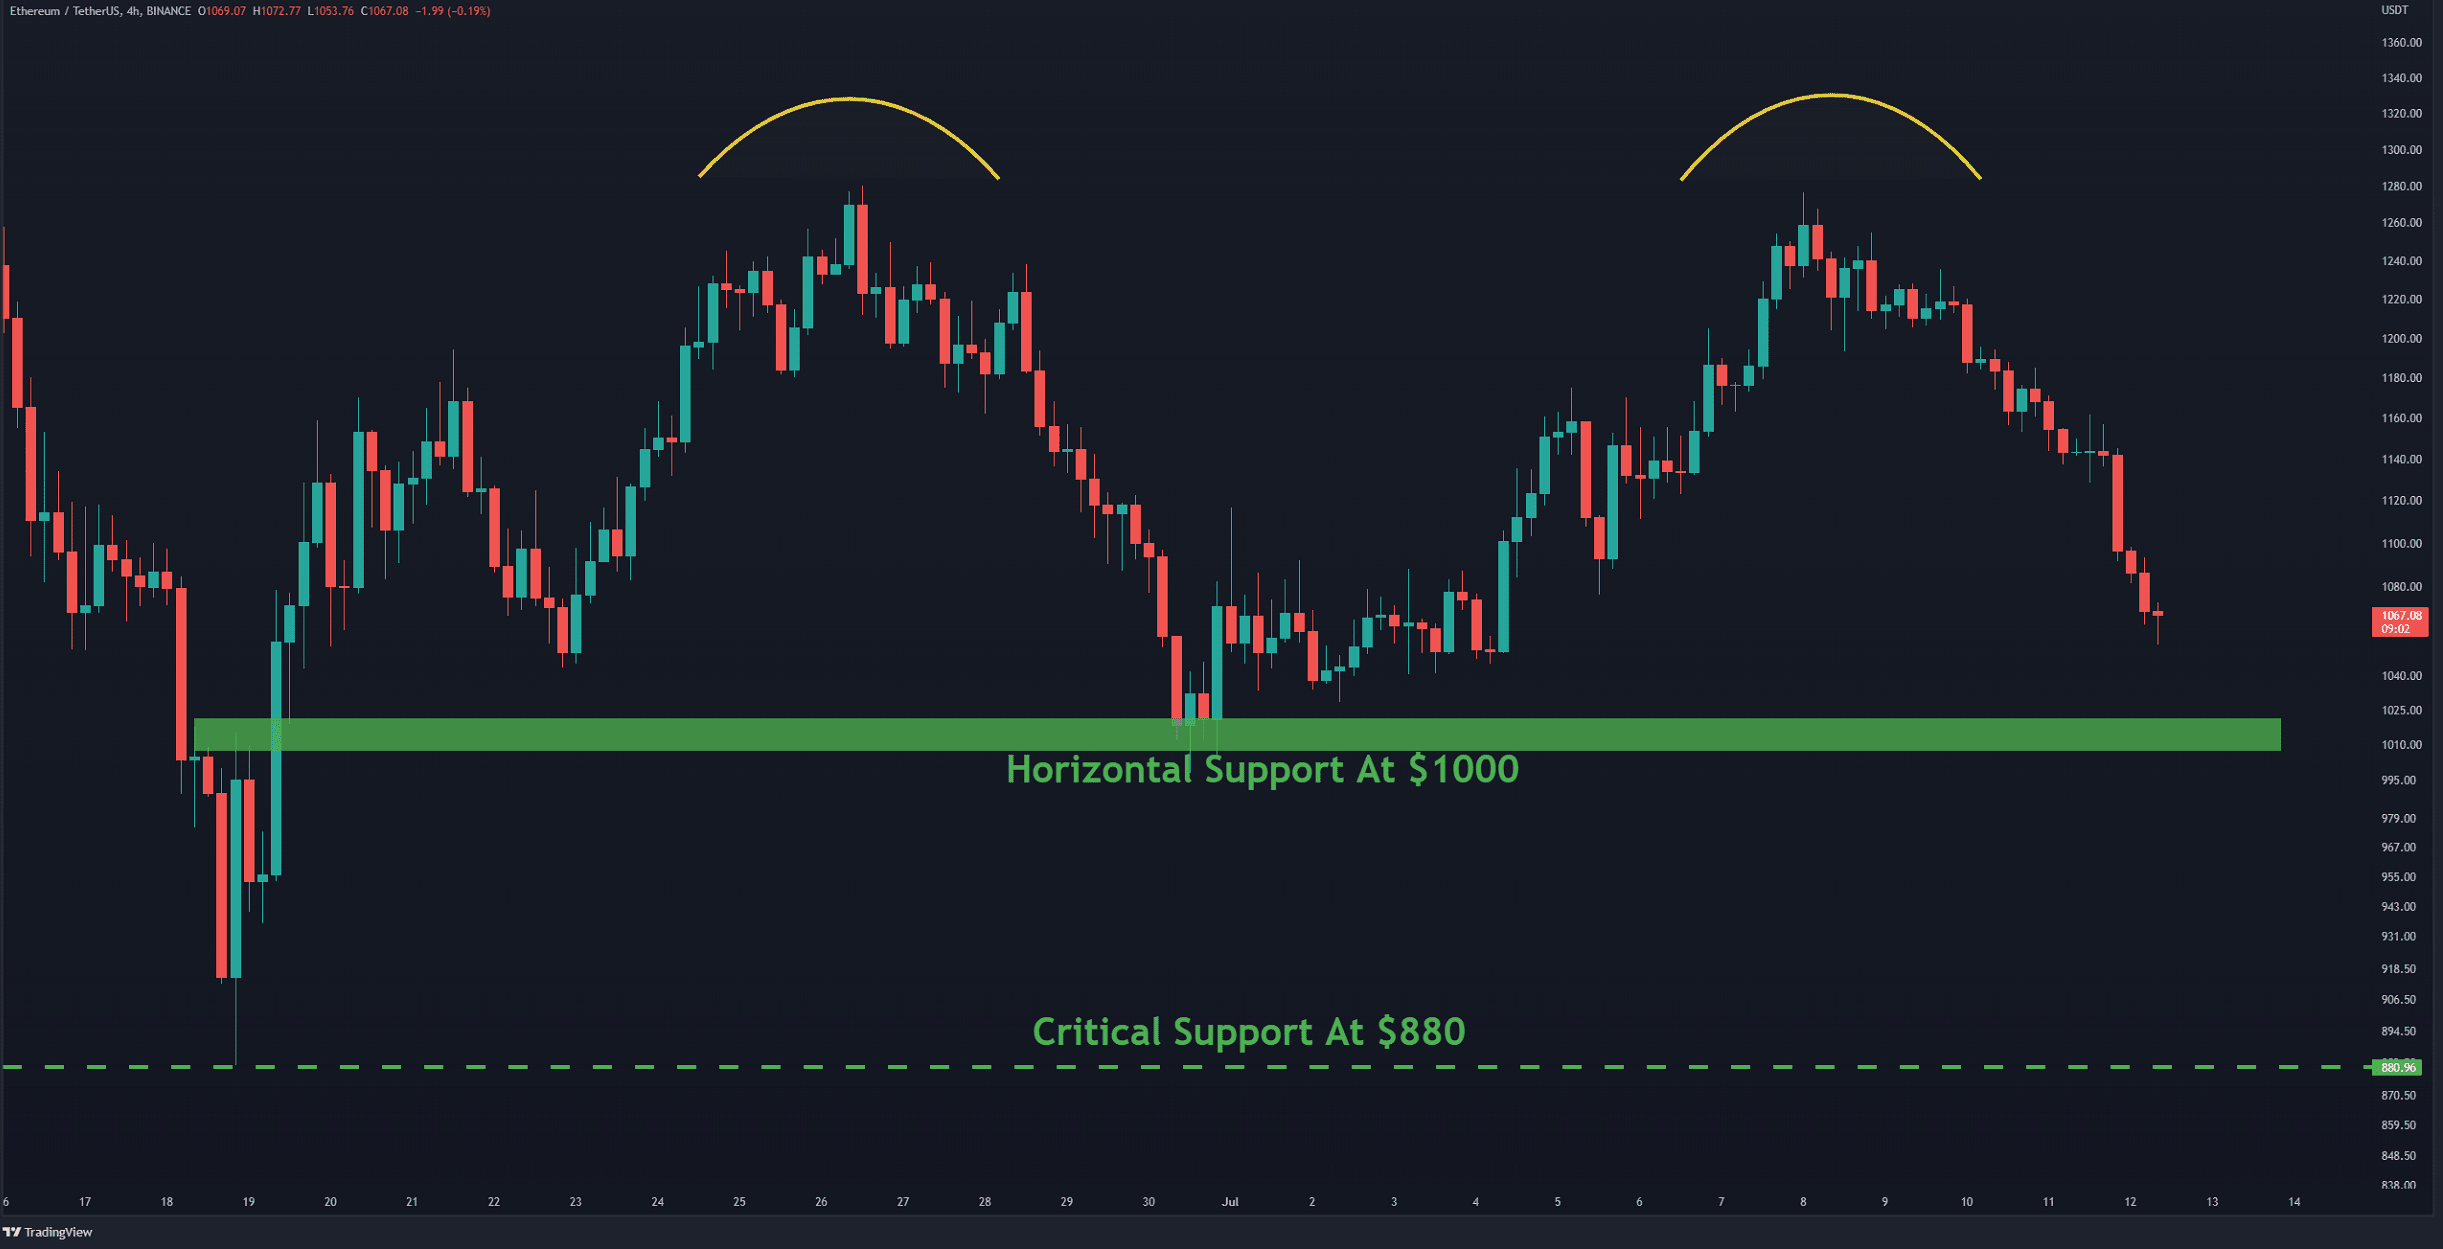
On the 4-hour timeframe, buyers failed to push the price above the last high at $1,280. This led ETH to form a double-top pattern. This is technically a bearish structure. However, first, the neckline must be broken to confirm the bearish price action. The cryptocurrency could bounce again if it touches the horizontal support at $1000. The area between $1,000 and $880 can potentially prevent further declines in the short term.

On-chain Analysis
Fund Holdings
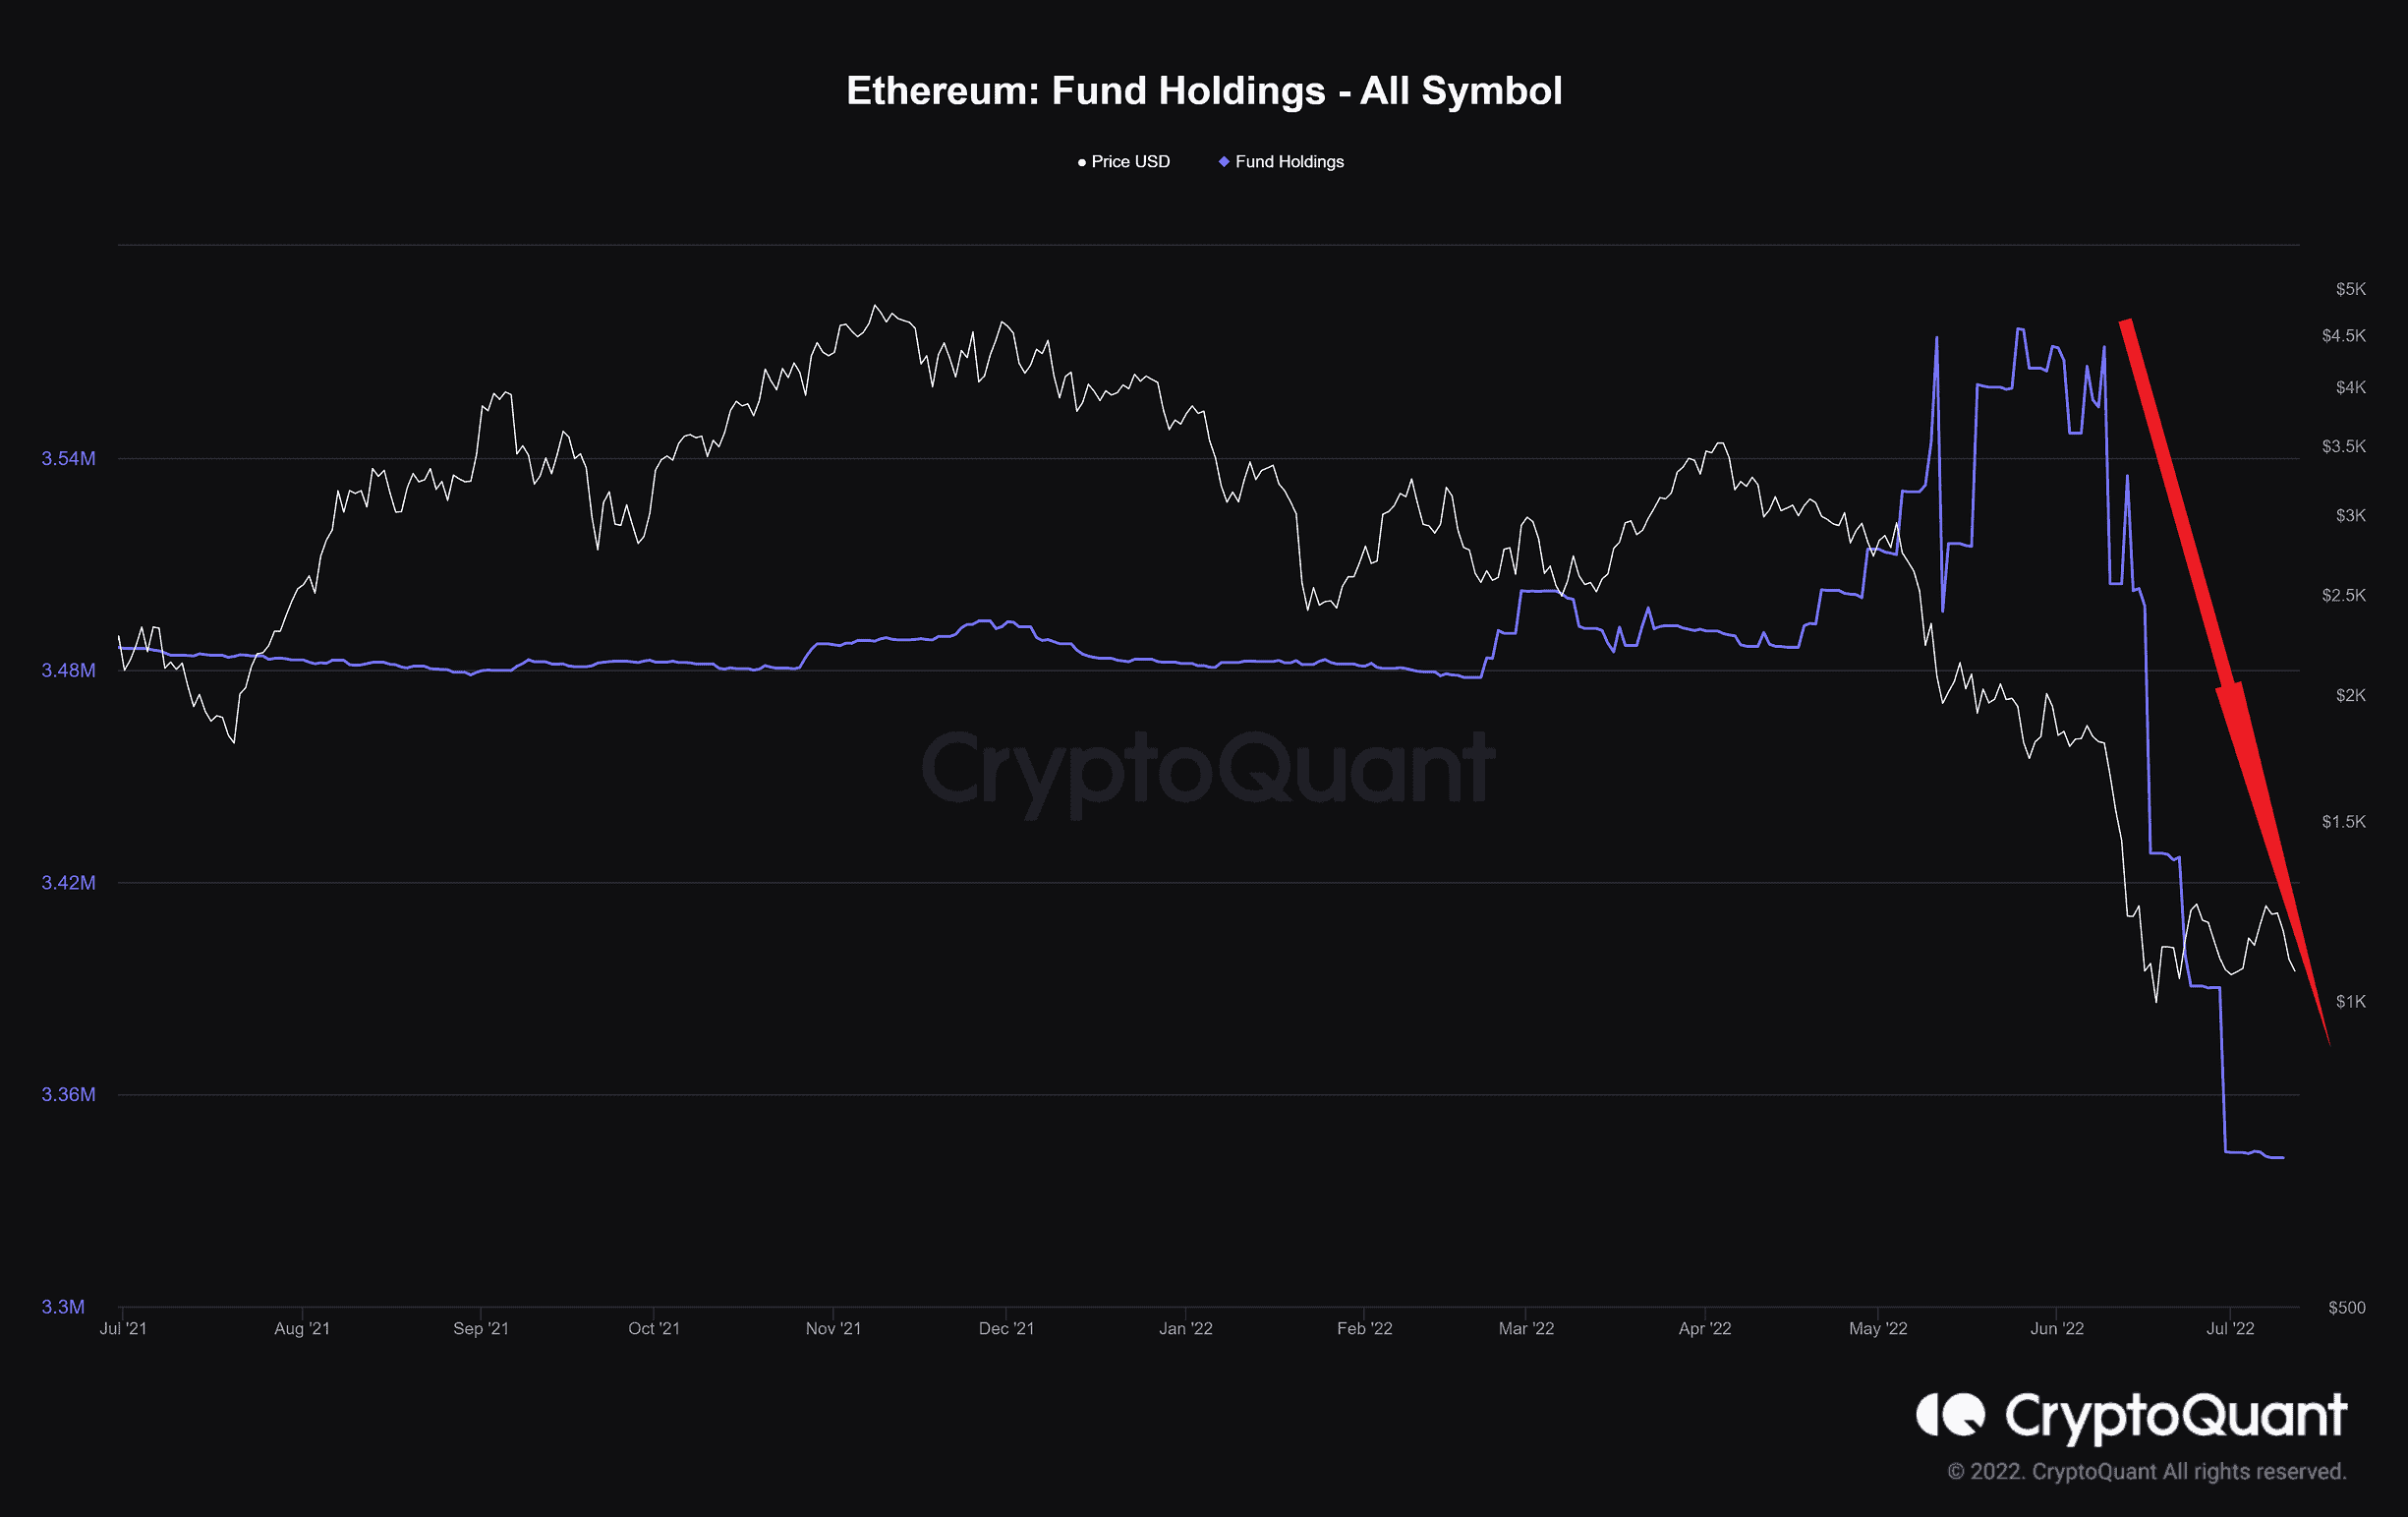
Definition: The total amount of coins held by digital assets holdings such as trusts, ETFs, and funds.
Digital assets holdings have cut their supply by around 230,000 ETH during the recent sell-off. They had kept their assets at a constant level since May 2021. It seems that investors have not yet found a positive trigger for the market and prefer to be on the sidelines. It should be noted that the amount of coins they held has decreased in the short term, but it is still at high levels compared to previous years.


