ETH Price Analysis: Downward Pressure Intesifies as Ethereum Crashes 10% in Two Days
Ethereum has experienced a 10% correction in the last two days, but the bulls failed to sustain the price above $2K. The US stock market ended the previous two days with red candles. According to many analysts, this uptrend was merely a dead cat bounce.
Technical Analysis
By Grizzly
The Daily Chart
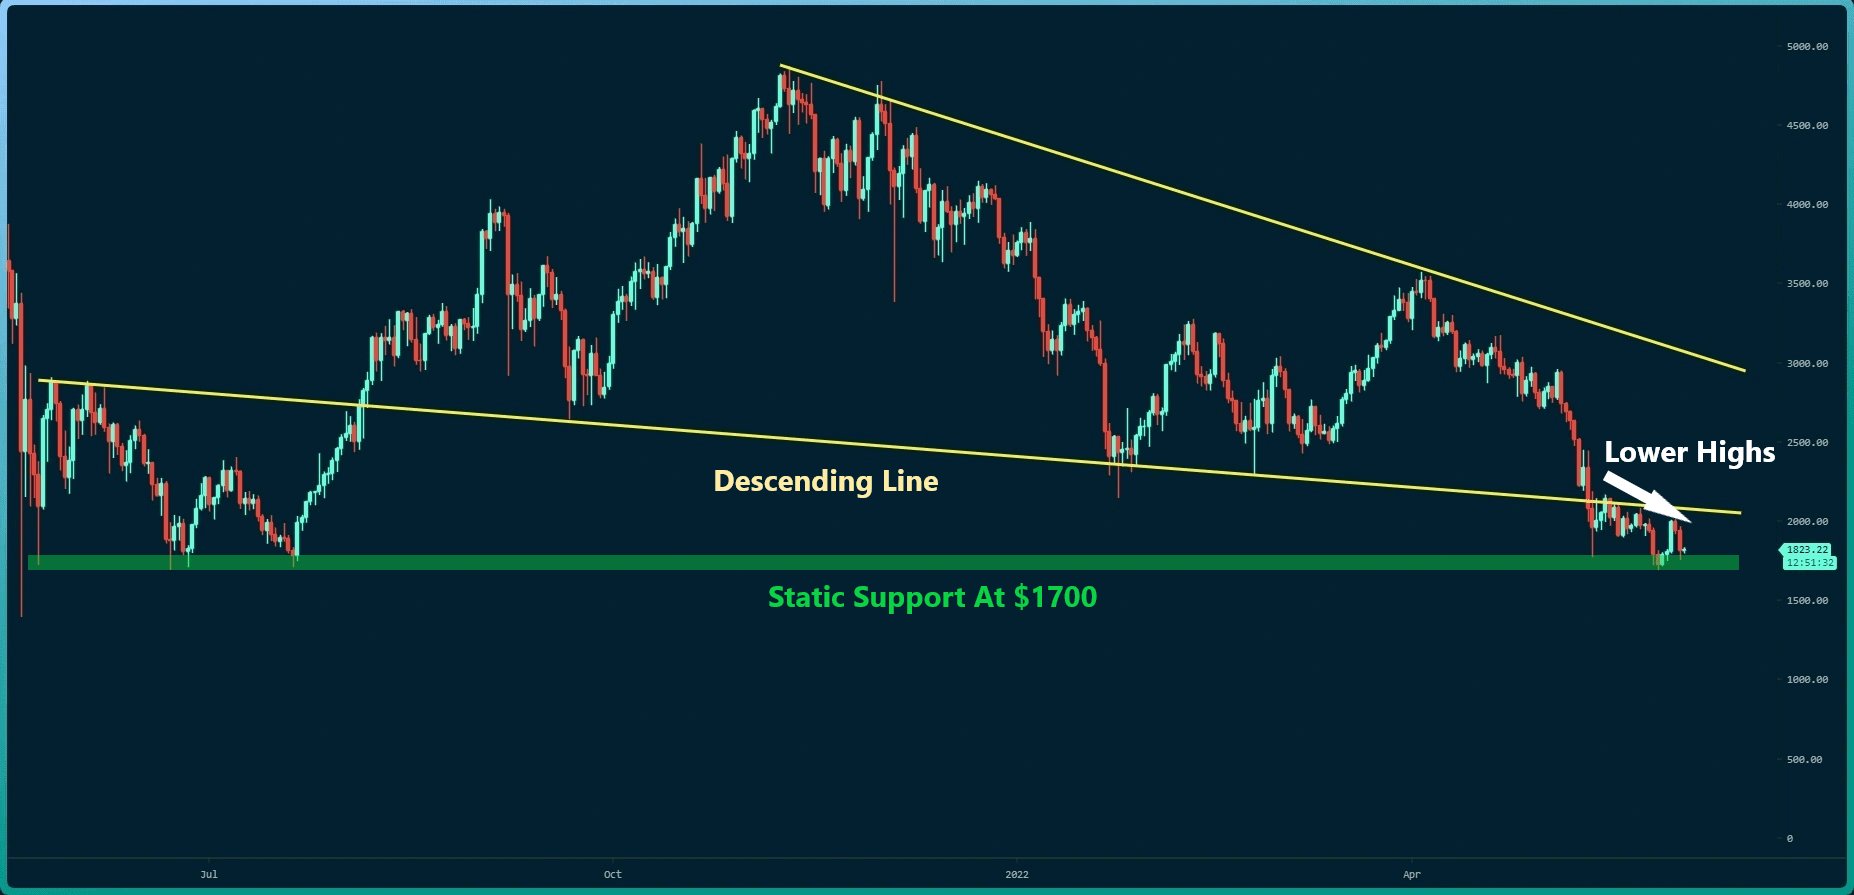
Ethereum has been trading below the descending line (in yellow) on a daily basis. So far, the buyers have not been able to push it above this line and form a higher high despite the multiple attempts.
The formation of lower highs and lows signals the prominence of the bearish structure. If buyers attract enough capital influx to reverse the downtrend, they must return above the resistance level of $2000-$2200, first. This will be the first step necessary to reduce the bearish momentum and potentially propel a new trend.
On the other hand, the bulls need to defend $1,700 as crucial support. If they fail, the bears are likely to escalate the downward pressure and explore lower levels.
Key Support Levels: $1700 & $1500
Key Resistance Levels: $2000 & $2200

Moving Averages:
MA20: $1959
MA50: $2486
MA100: $2713
MA200: $3140
The ETH/BTC Chart
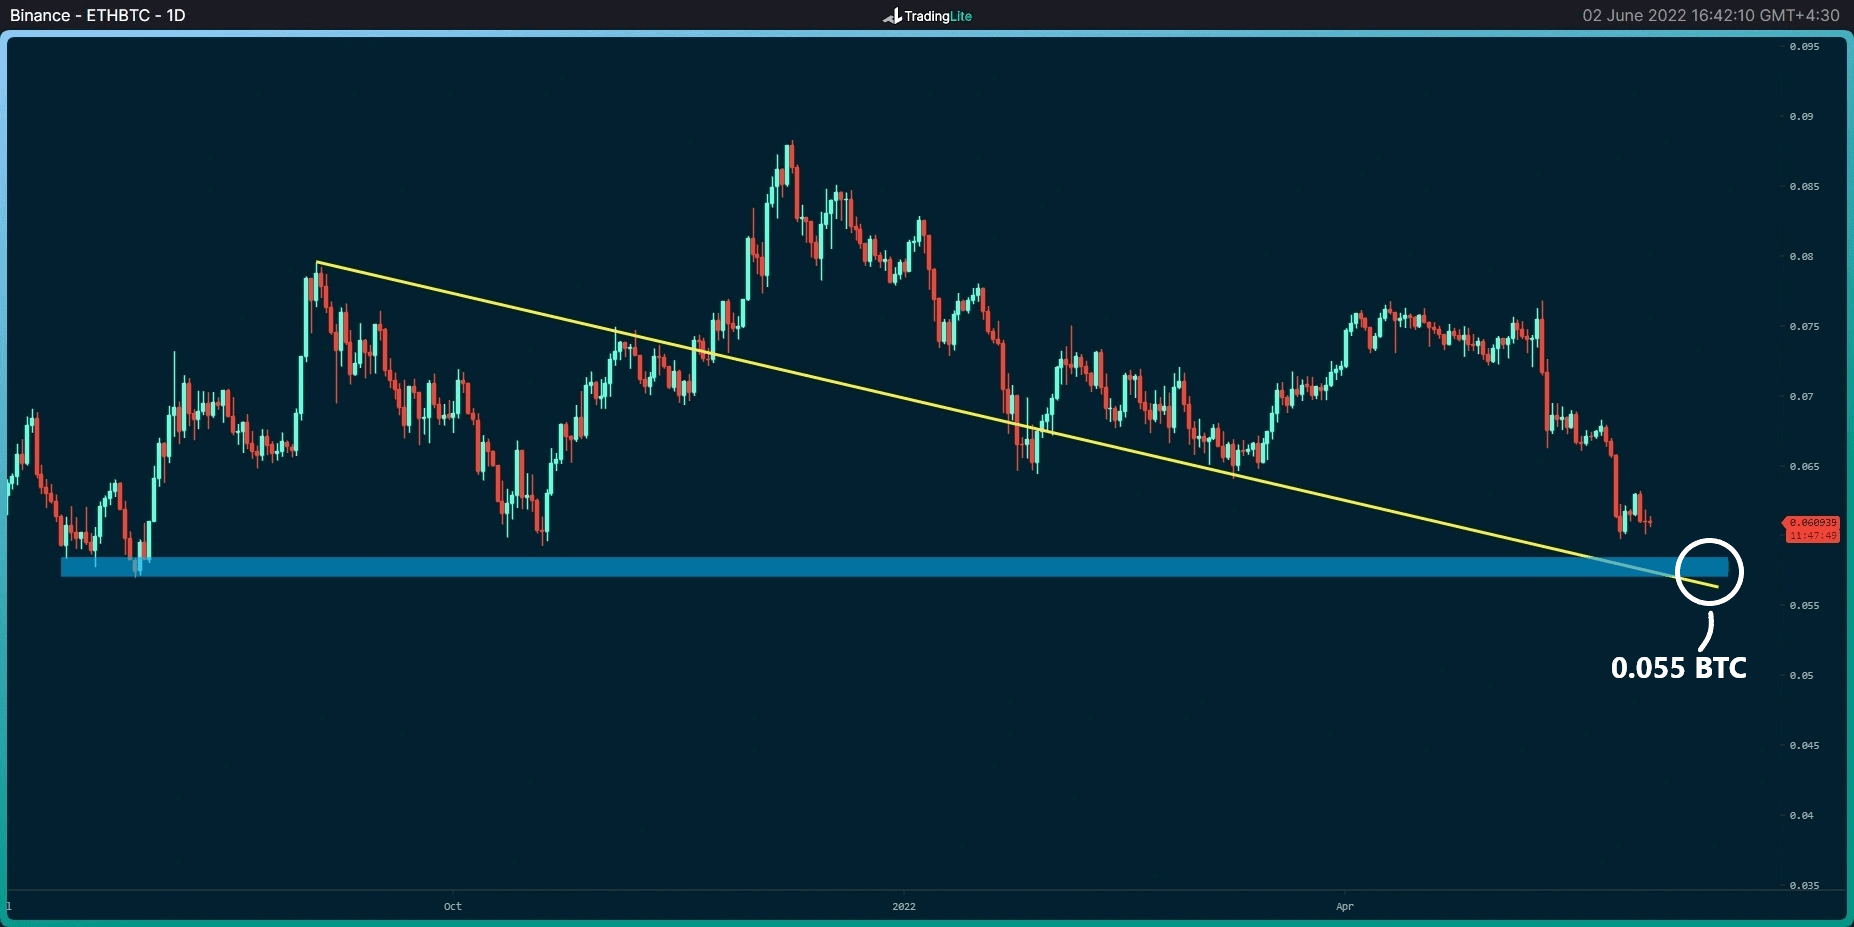
Overall, the BTC chart reveals a bearish structure confirming the downward momentum. Based on ETH’s inability to return above the lost support levels in the USD chart, the price seems more likely to fall to the support at 0.055 BTC (white circle).
The point to consider a potential reversal is 0.065 BTC.
Key Support Levels: 0.060 BTC & 0.055 BTC
Key Resistance Levels: 0.065 BTC & 0.070 BTC

On-chain Analysis
Number of New Addresses (7d Moving Average)
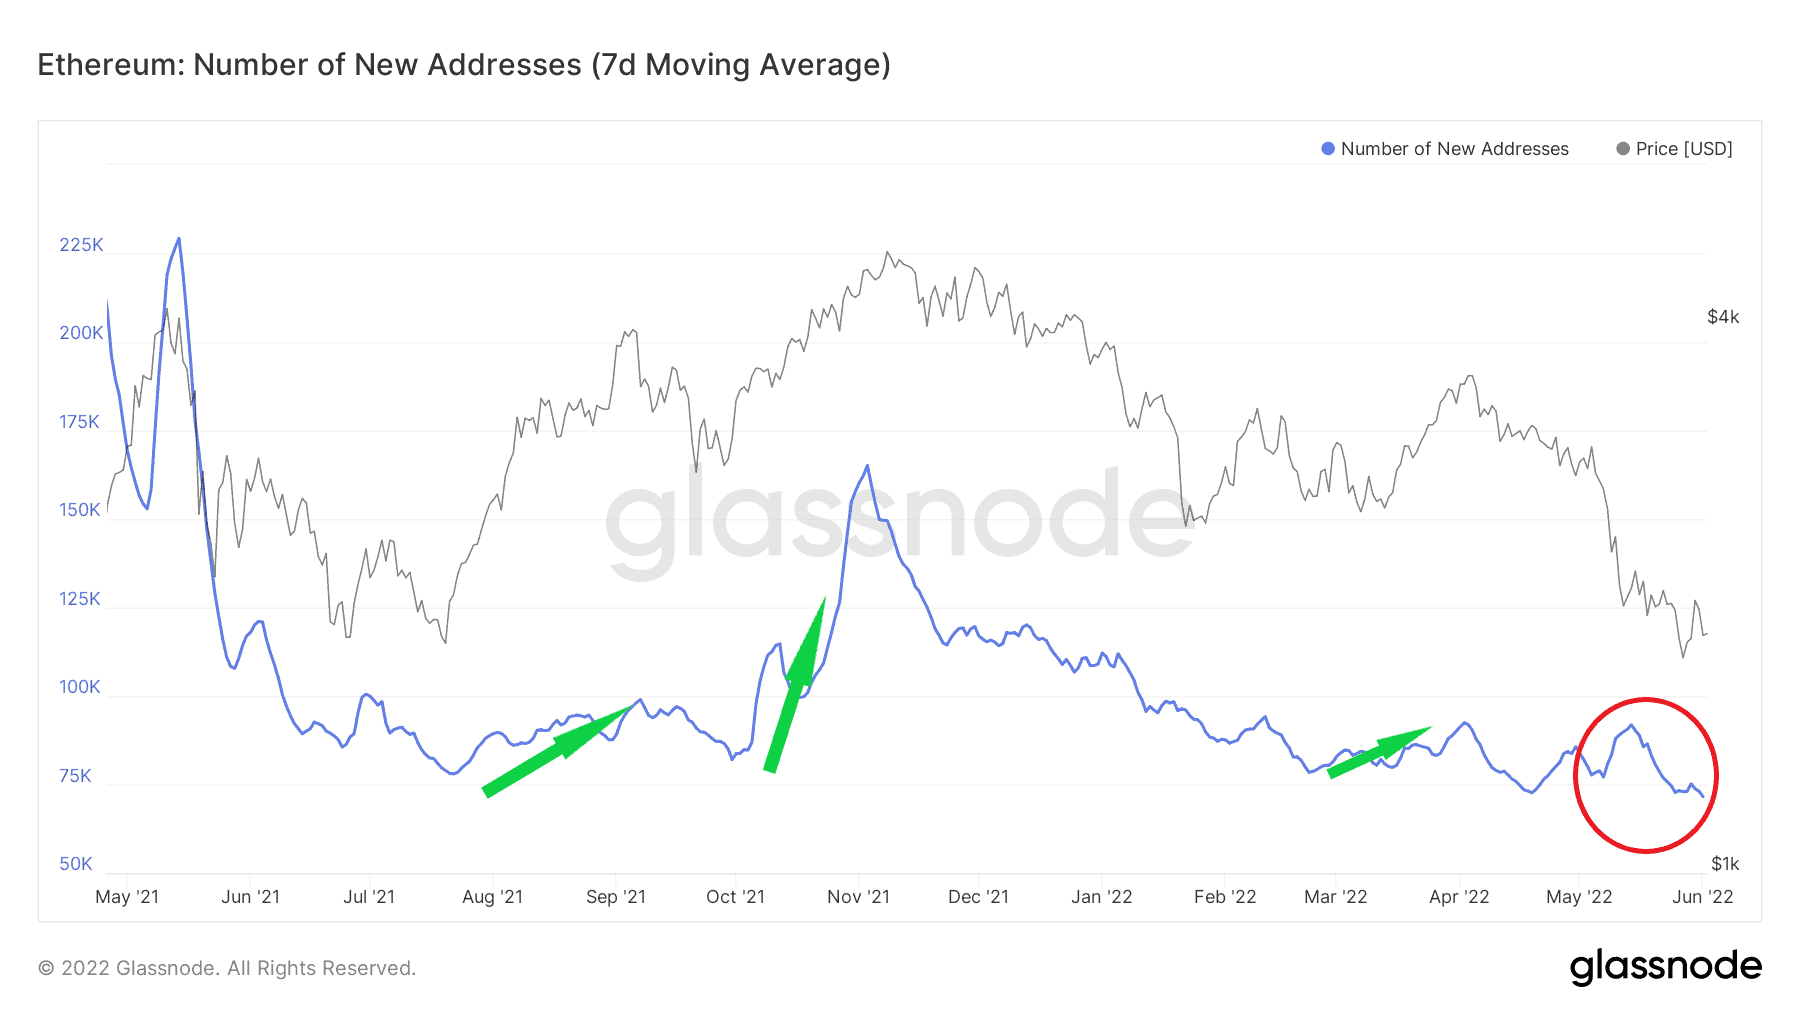
Generally, price uptrends are accompanied by an influx of new investors, which is reflected in this metric. The chart shows that the number of new addresses has increased significantly every time the market structure is bullish.
Despite the recent price surge in recent days, this metric has not indicated any notable new user adoption. According to this data, investors are still not convinced about a reversal in the short term.


