ETH Plunged to Pre-Grayscale Levels, At a Critical Point Now: Ethereum Price Analysis
The crypto markets suffered hard over the past 24 hours. From a technical analysis standpoint on higher timeframes, Ethereum’s price seems willing to drop further, as things still look bearish.
Technical Analysis
By Edris
The Daily Chart
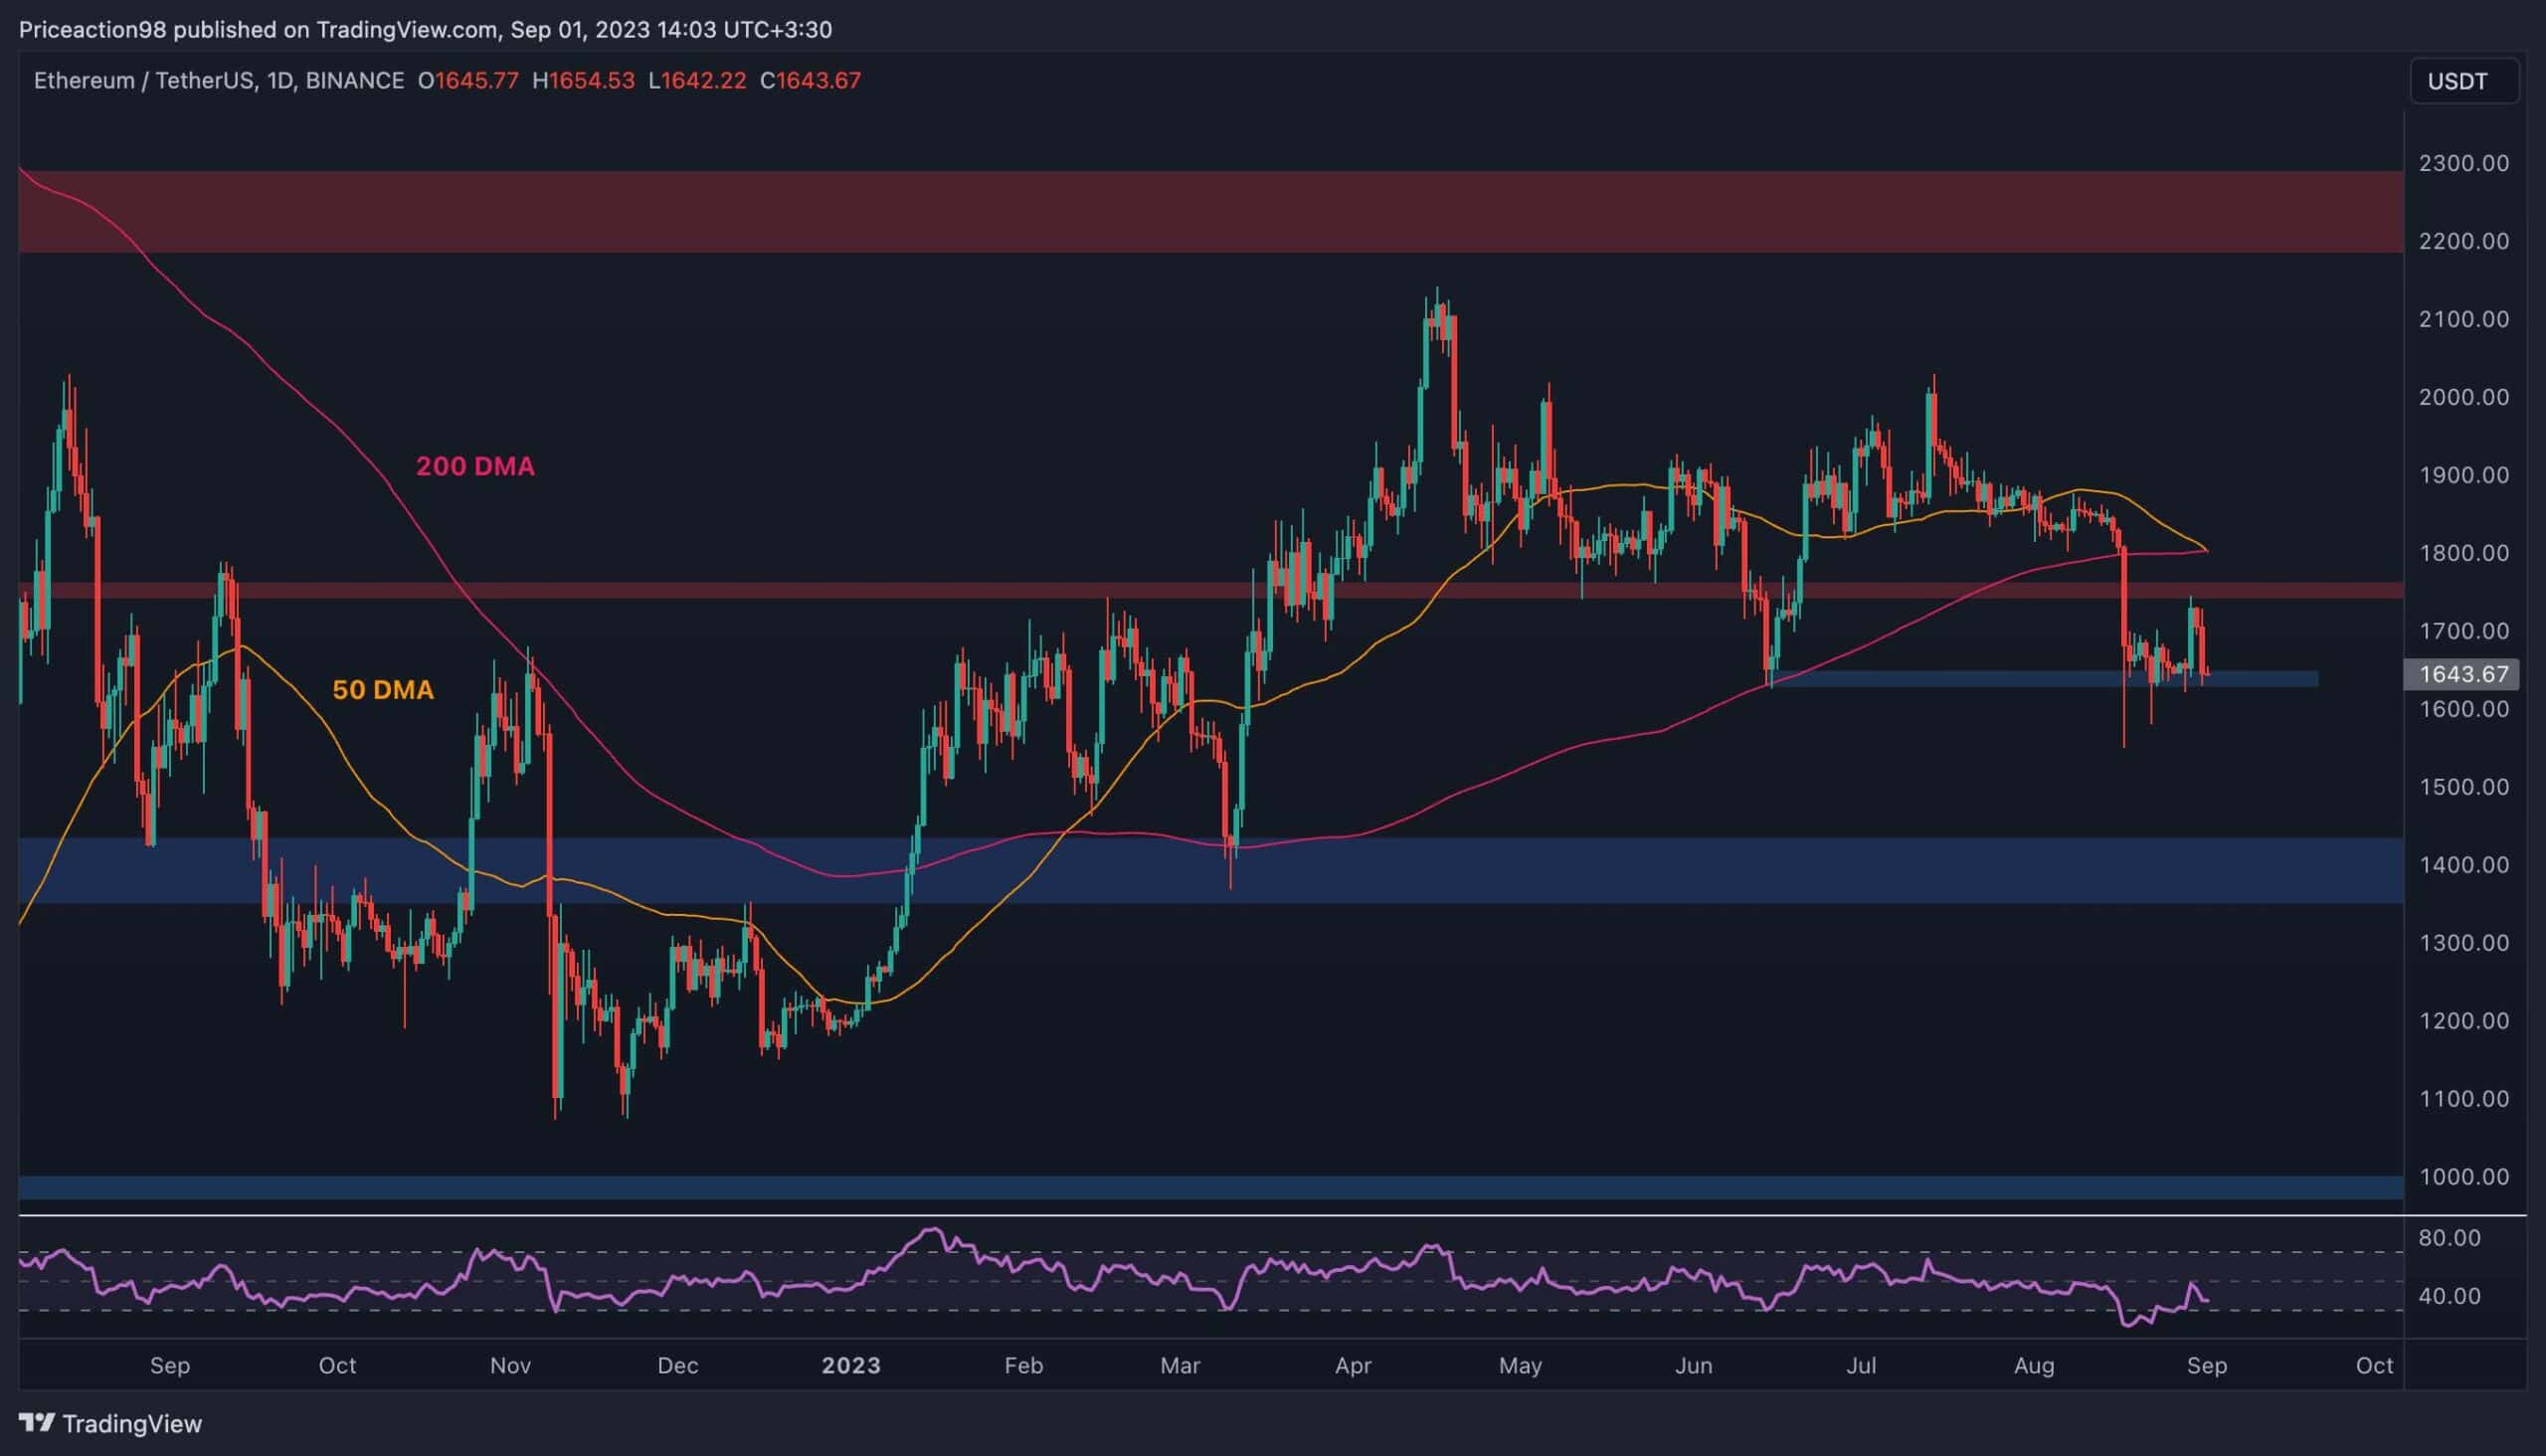
On the daily chart, the price was able to retest the critical $1,750 level but has failed to maintain above it, getting heavily rejected to the downside. If ETH breaks below the short-term $1,650 support level, it will lead to a deeper drop toward the $1,400 area.
Moreover, the 50-day and 200-day moving averages are about to go through a bearish crossover, with the 50-day crossing the 200-day to the downside (Death Cross). This is considered a very negative signal and could mark the beginning of another mid-term bearish phase.

The 4-Hour Chart
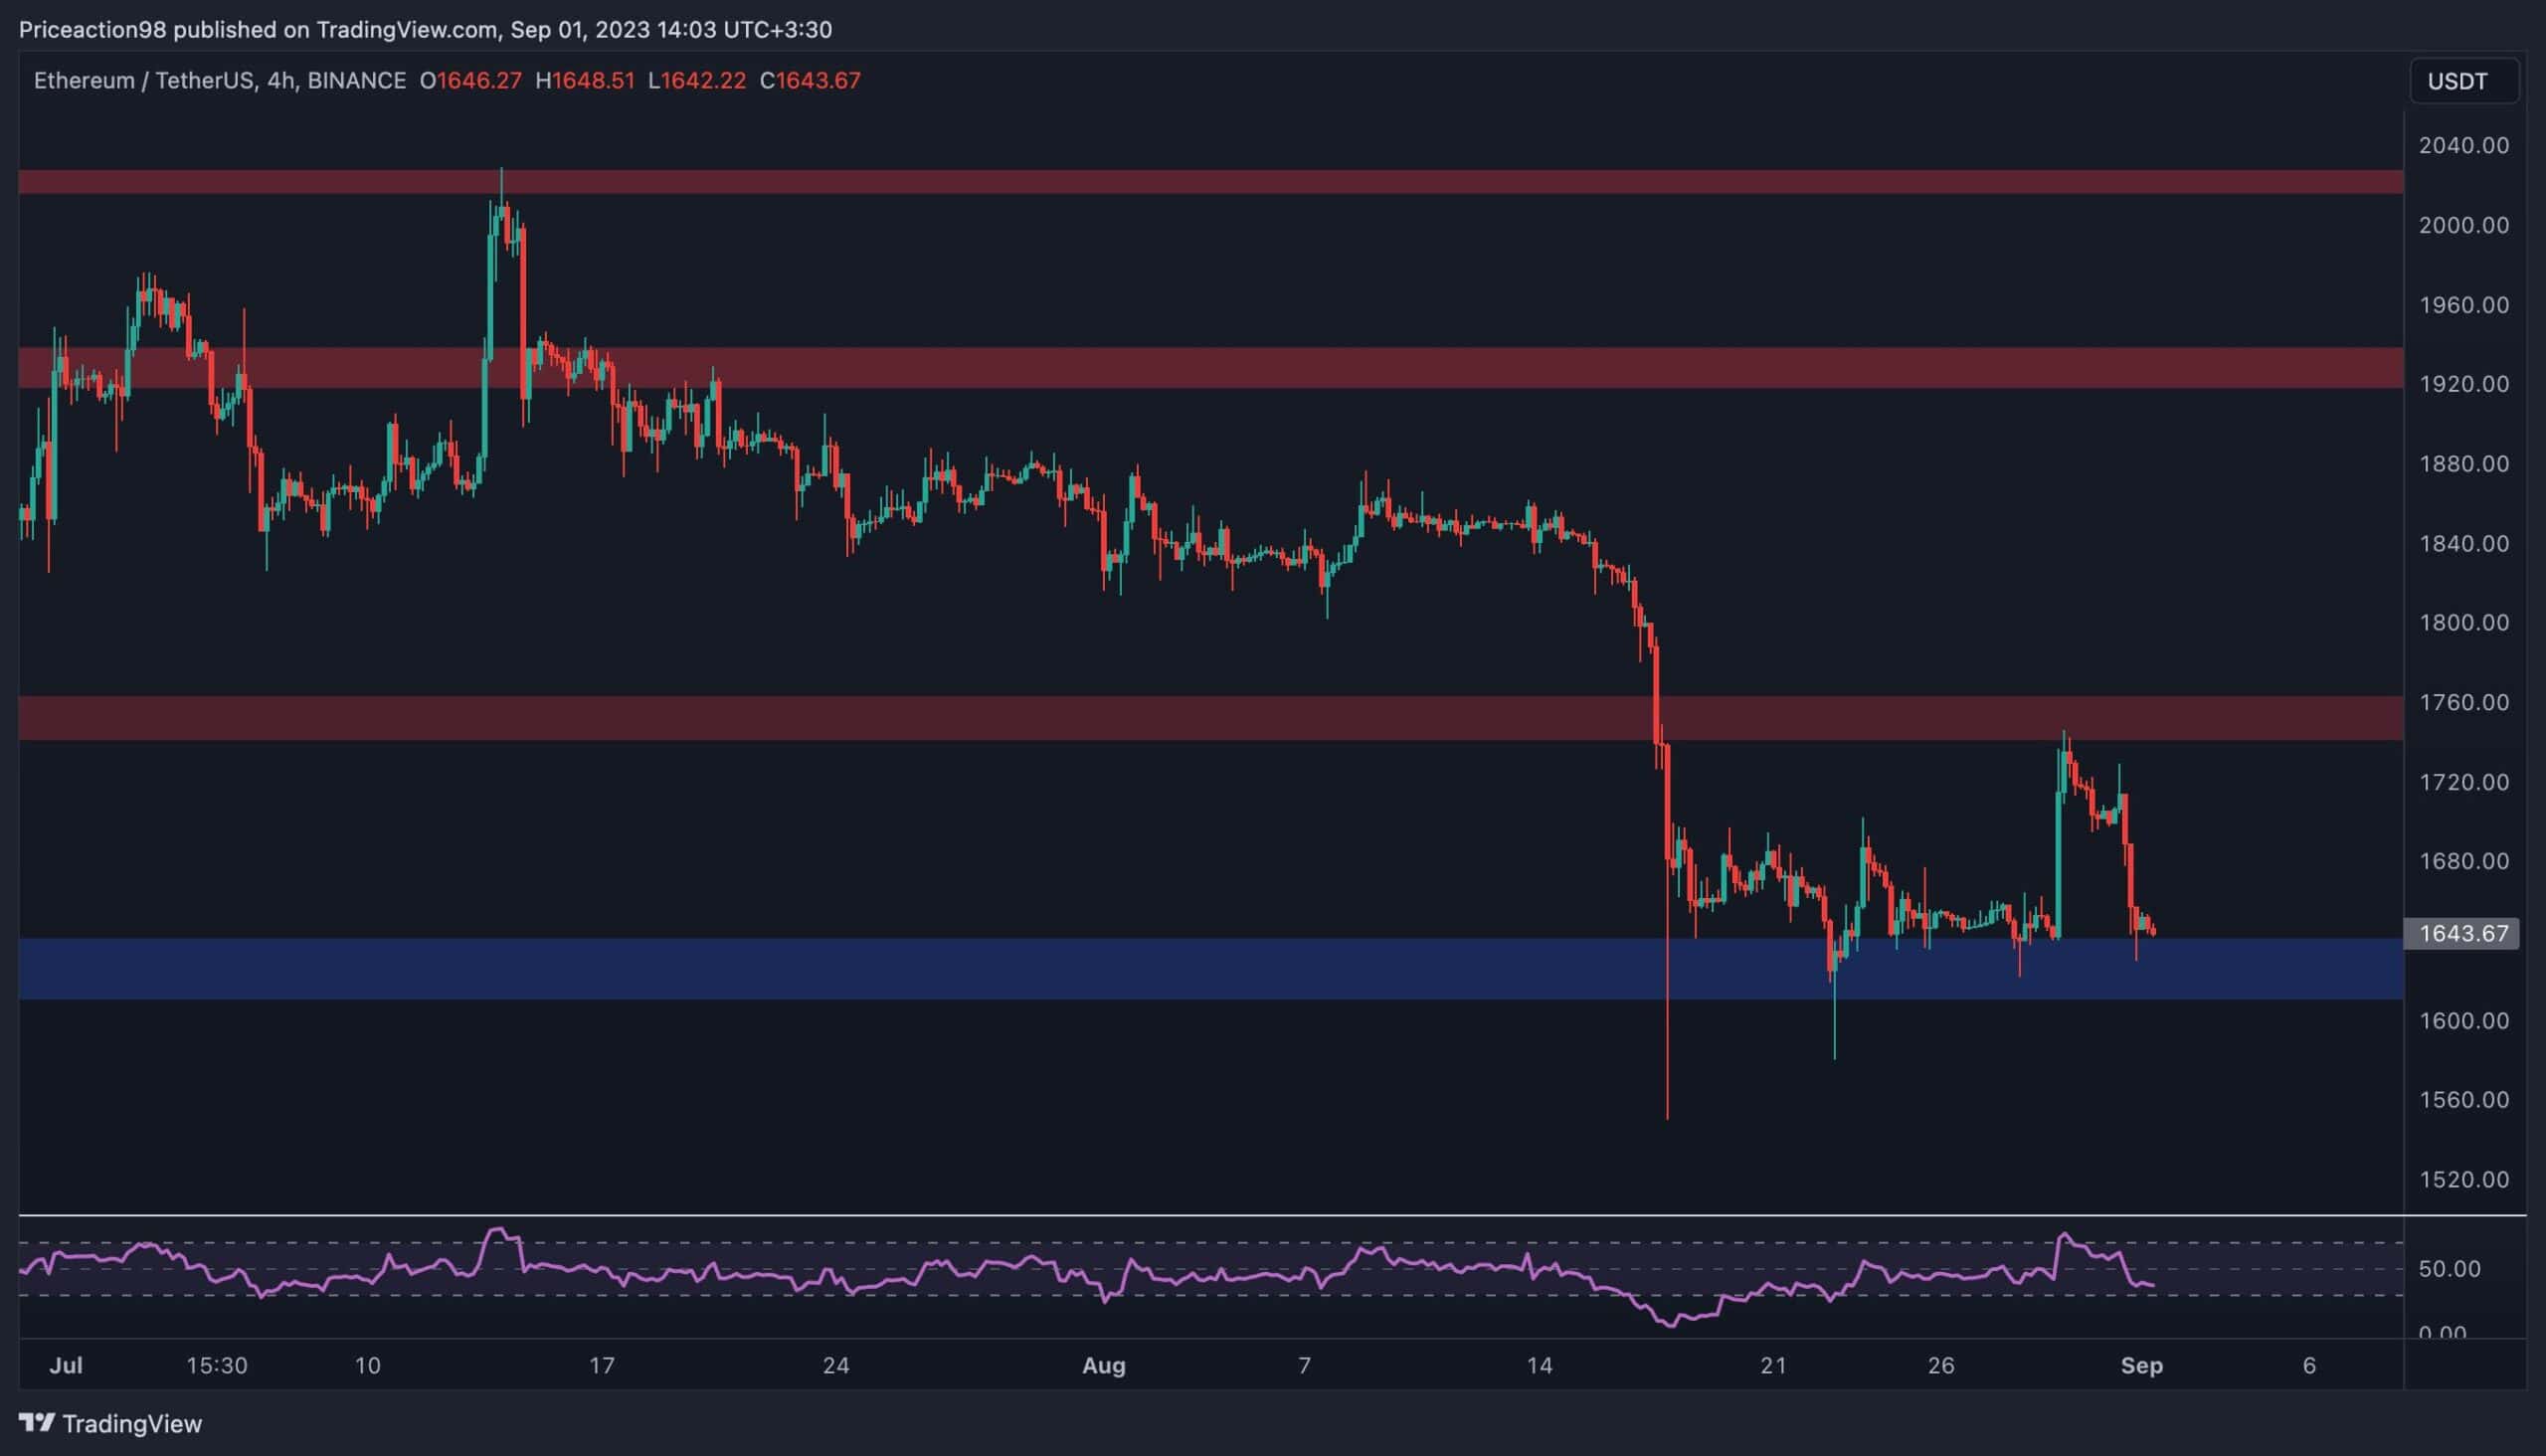
Looking at the 4-hour timeframe, it is evident that the $1,750 resistance zone has rejected the price to the downside, pushing it back toward the $1,650 support level. The market is yet to show any intention for a rebound from the mentioned support area, as it is trying to break through it.
The RSI indicator has also dropped below the 50% threshold, indicating that the bears are now in control. Therefore, if ETH fails to hold above the $1,650 level and reclaim the $1,750 area quickly, a further decline would be imminent.

On-Chain Analysis
By: Edris
Ethereum Taker Buy Sell Ratio
Following weeks of consolidation in a tight range, Ethereum’s price has recently experienced a significant drop. Analyzing the futures market metrics would be beneficial in determining where the price is likely to go next.
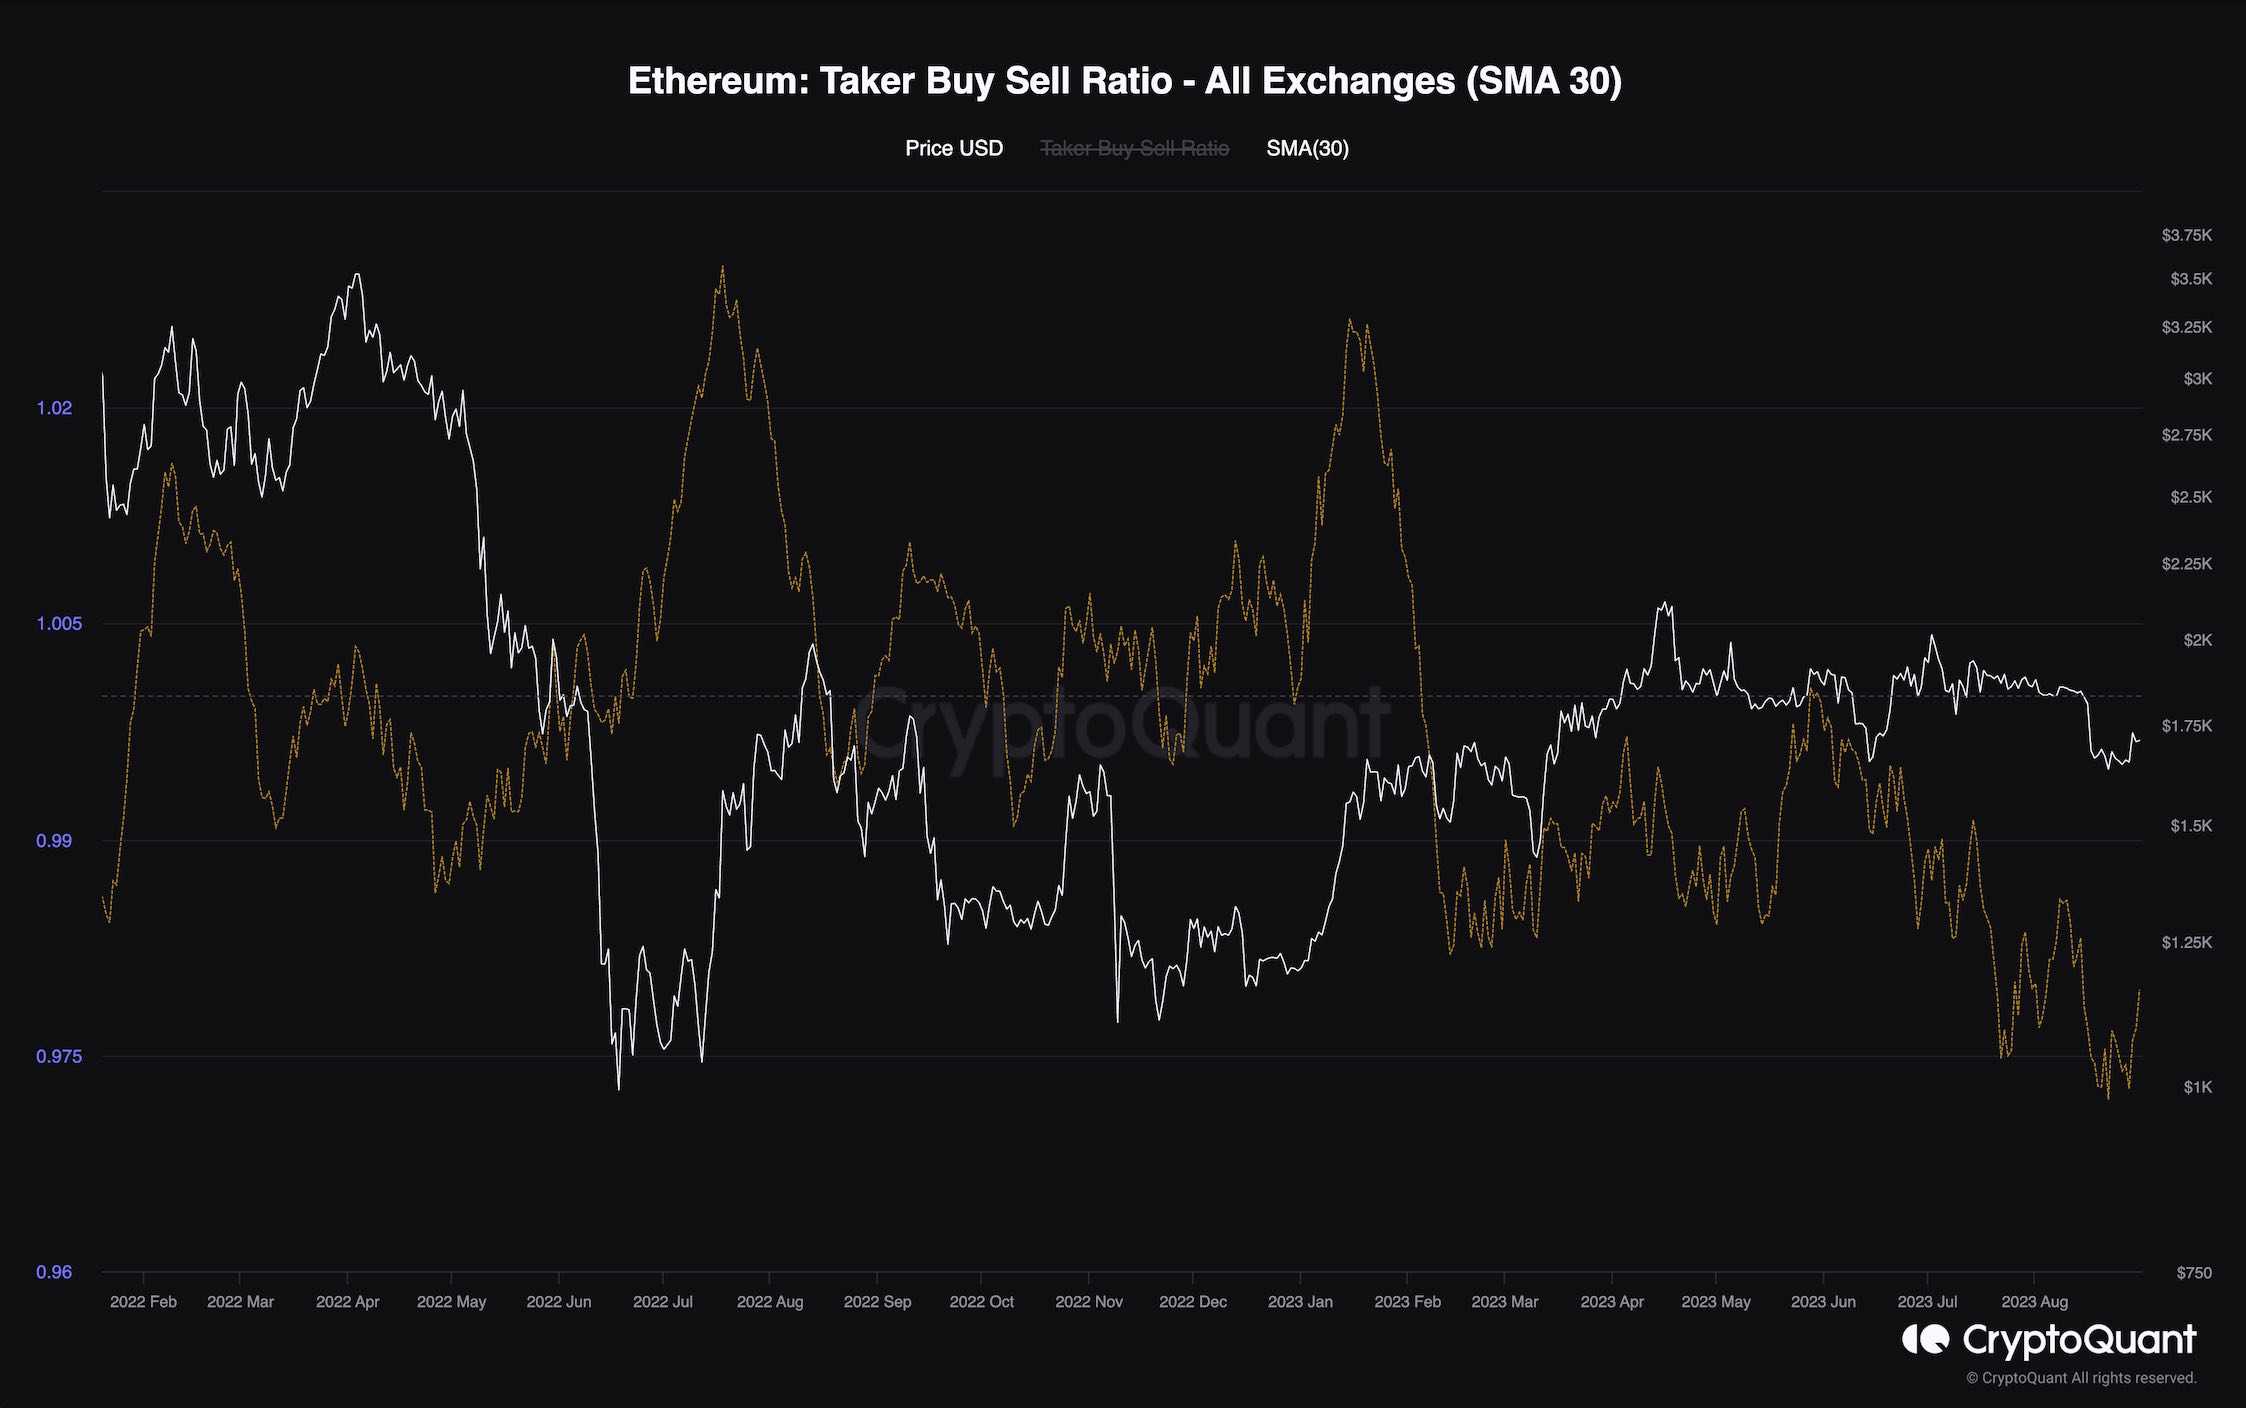
This chart shows the 30-day standard moving average of the taker buy-sell ratio metric. The metric indicates whether buyers or sellers are executing their orders more aggressively. Values above one are considered bullish, while values at one are associated with a bearish sentiment.
As the chart demonstrates, the taker buy-sell ratio has decreased over the past few months, constantly dropping deeper below one. As long as this trend persists, bearish price action is more likely. For the price to start a new impulsive uptrend, futures traders should buy more aggressively (using market orders), as indicated by the metric rising above one.

The post ETH Plunged to Pre-Grayscale Levels, At a Critical Point Now: Ethereum Price Analysis appeared first on CryptoPotato.


