ETH Plummets 5% Daily, Will $1.8K Hold or is a Deeper Correction Inbound? (Ethereum Price Analysis)
After a phase of consolidation and correction, Ethereum’s price has recently arrived at the crucial support level of the 50-day moving average. However, it is currently going through a tight price range between the 50-day MA and the significant resistance level of $2K.
Technical Analysis
By Shayan
The Daily Chart
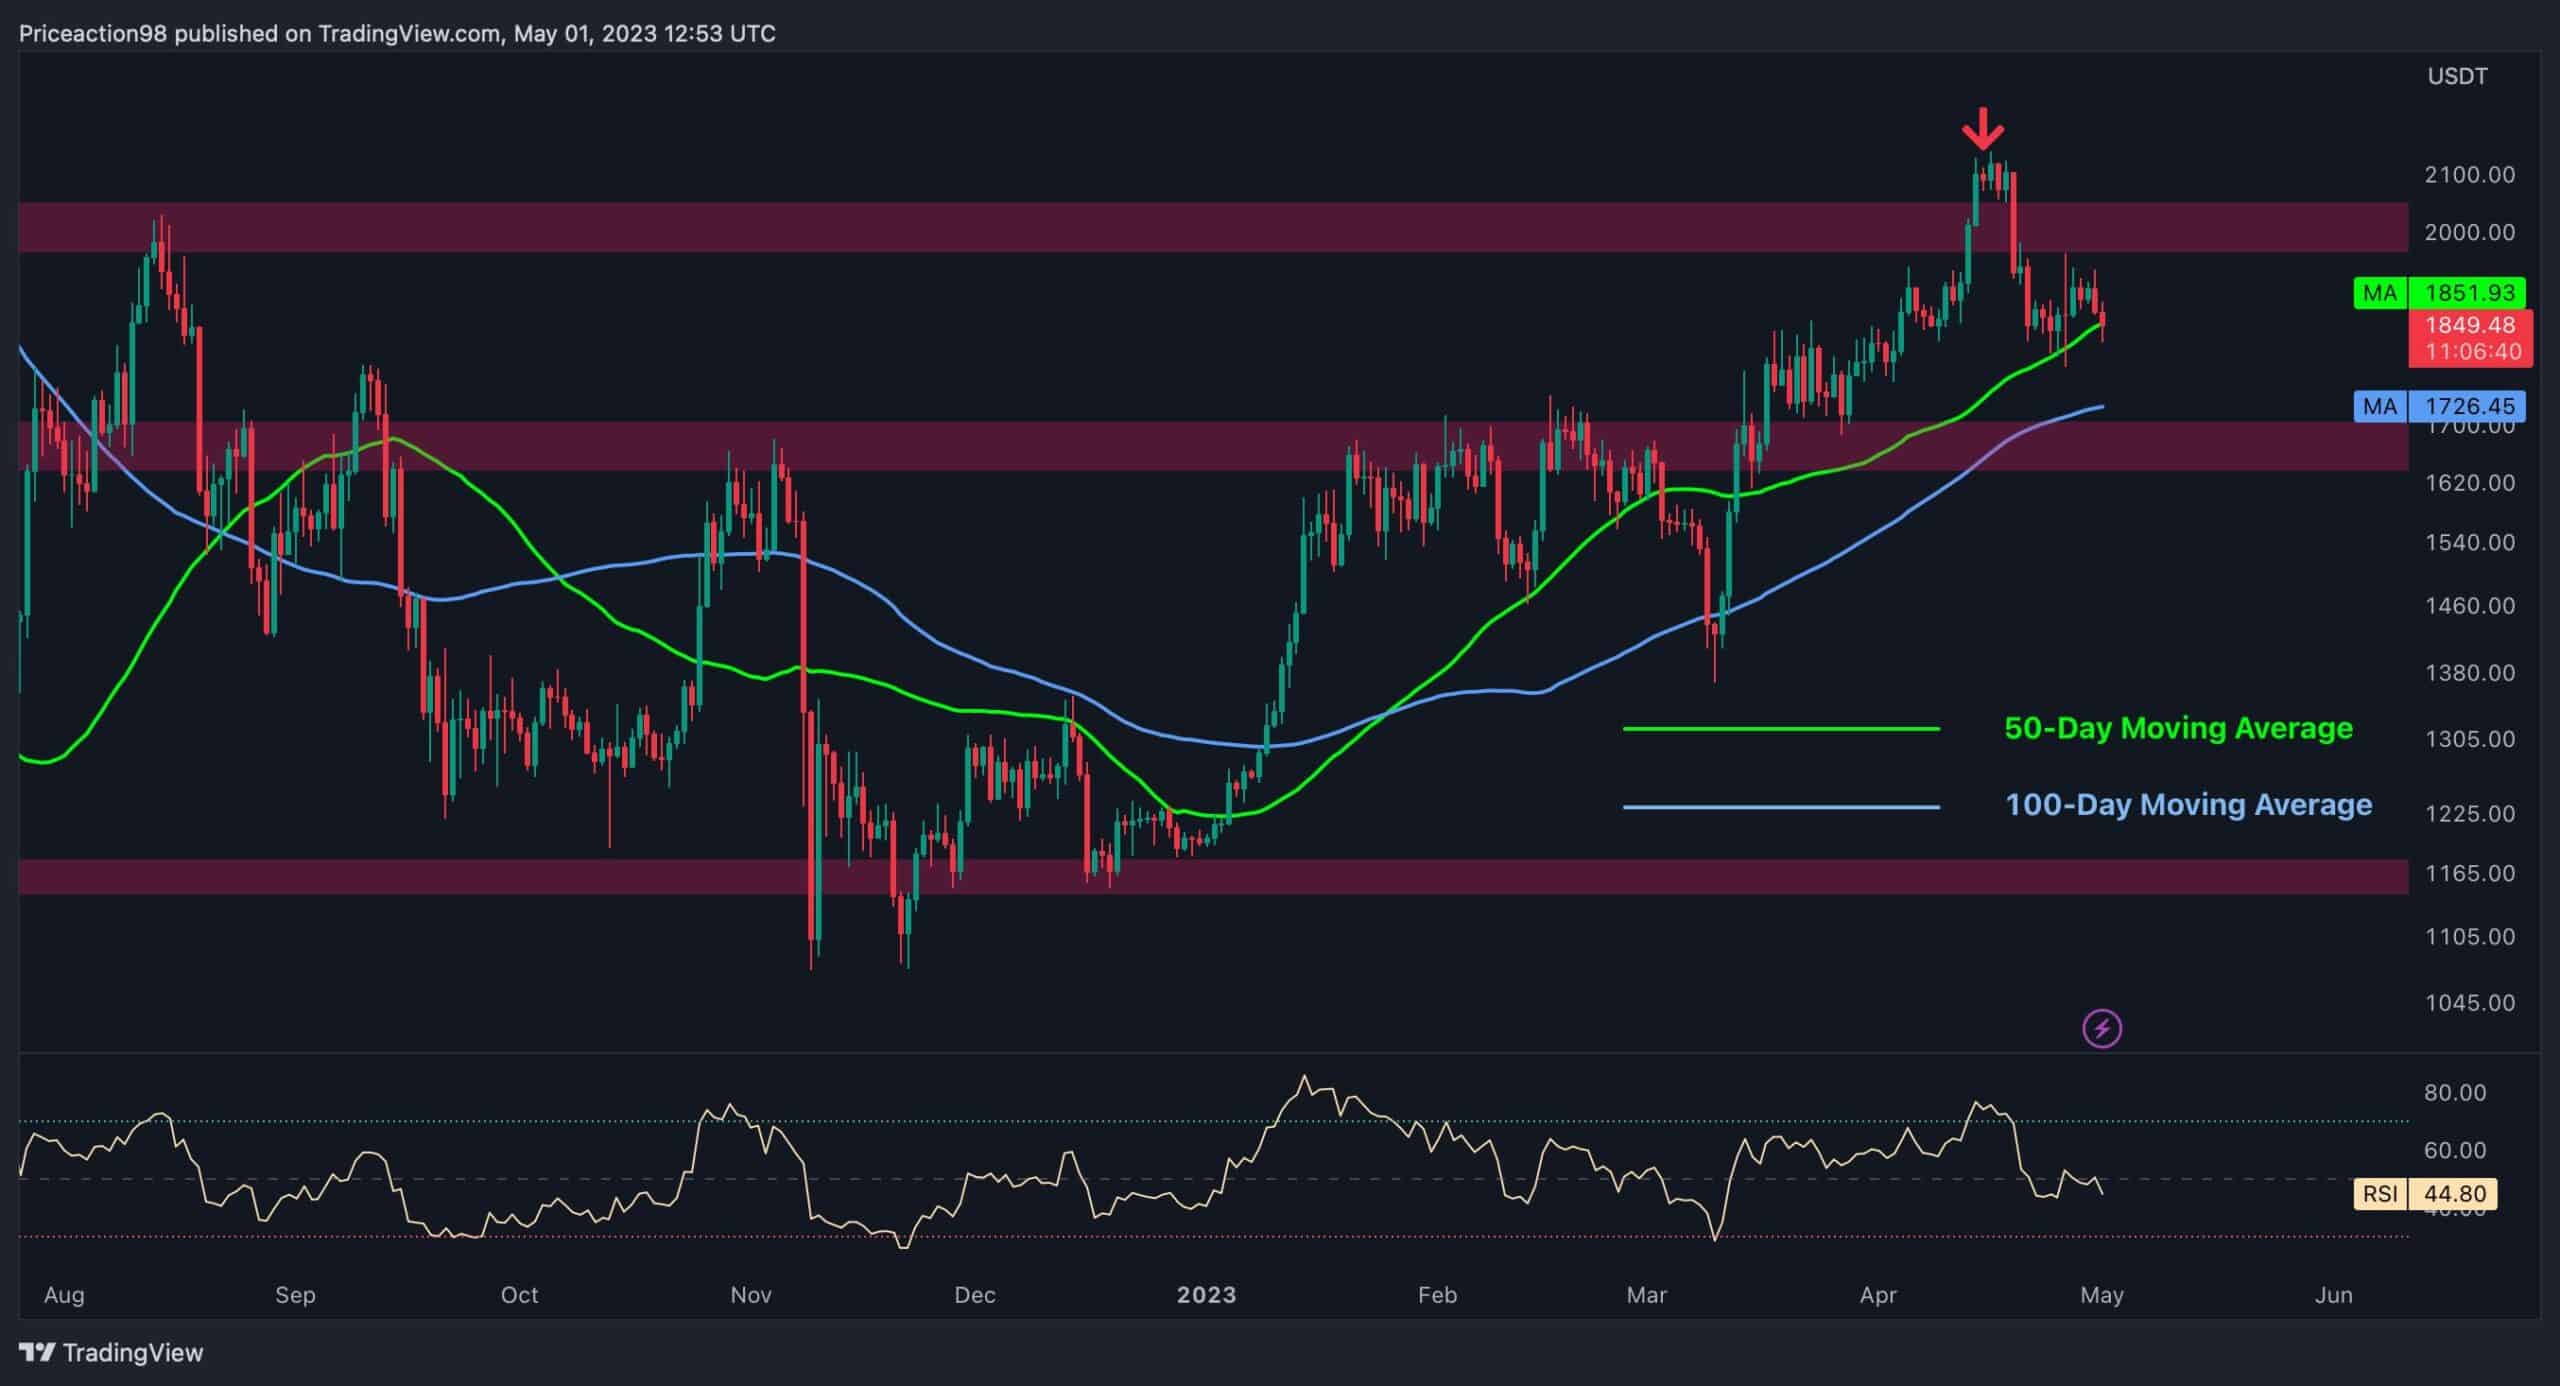
Analyzing the daily chart, the price previously formed a higher-high pattern before experiencing a significant decline. The 50-day moving average acted as a support level at $1.8K, leading to substantial volatility in lower timeframes and a significant shadow in the daily chart.
At present, ETH is confined within a narrow dynamic range between the 50-day moving average, which is currently at $1847, and the significant resistance region of $2K.
If the price manages to surpass the resistance of $2K and its prior swing at $2.1K, it could potentially trigger an extended rally. Conversely, if it falls below the 50-day MA, the 100-day moving average at $1.7K will become the primary support level.

The 4-Hour Chart
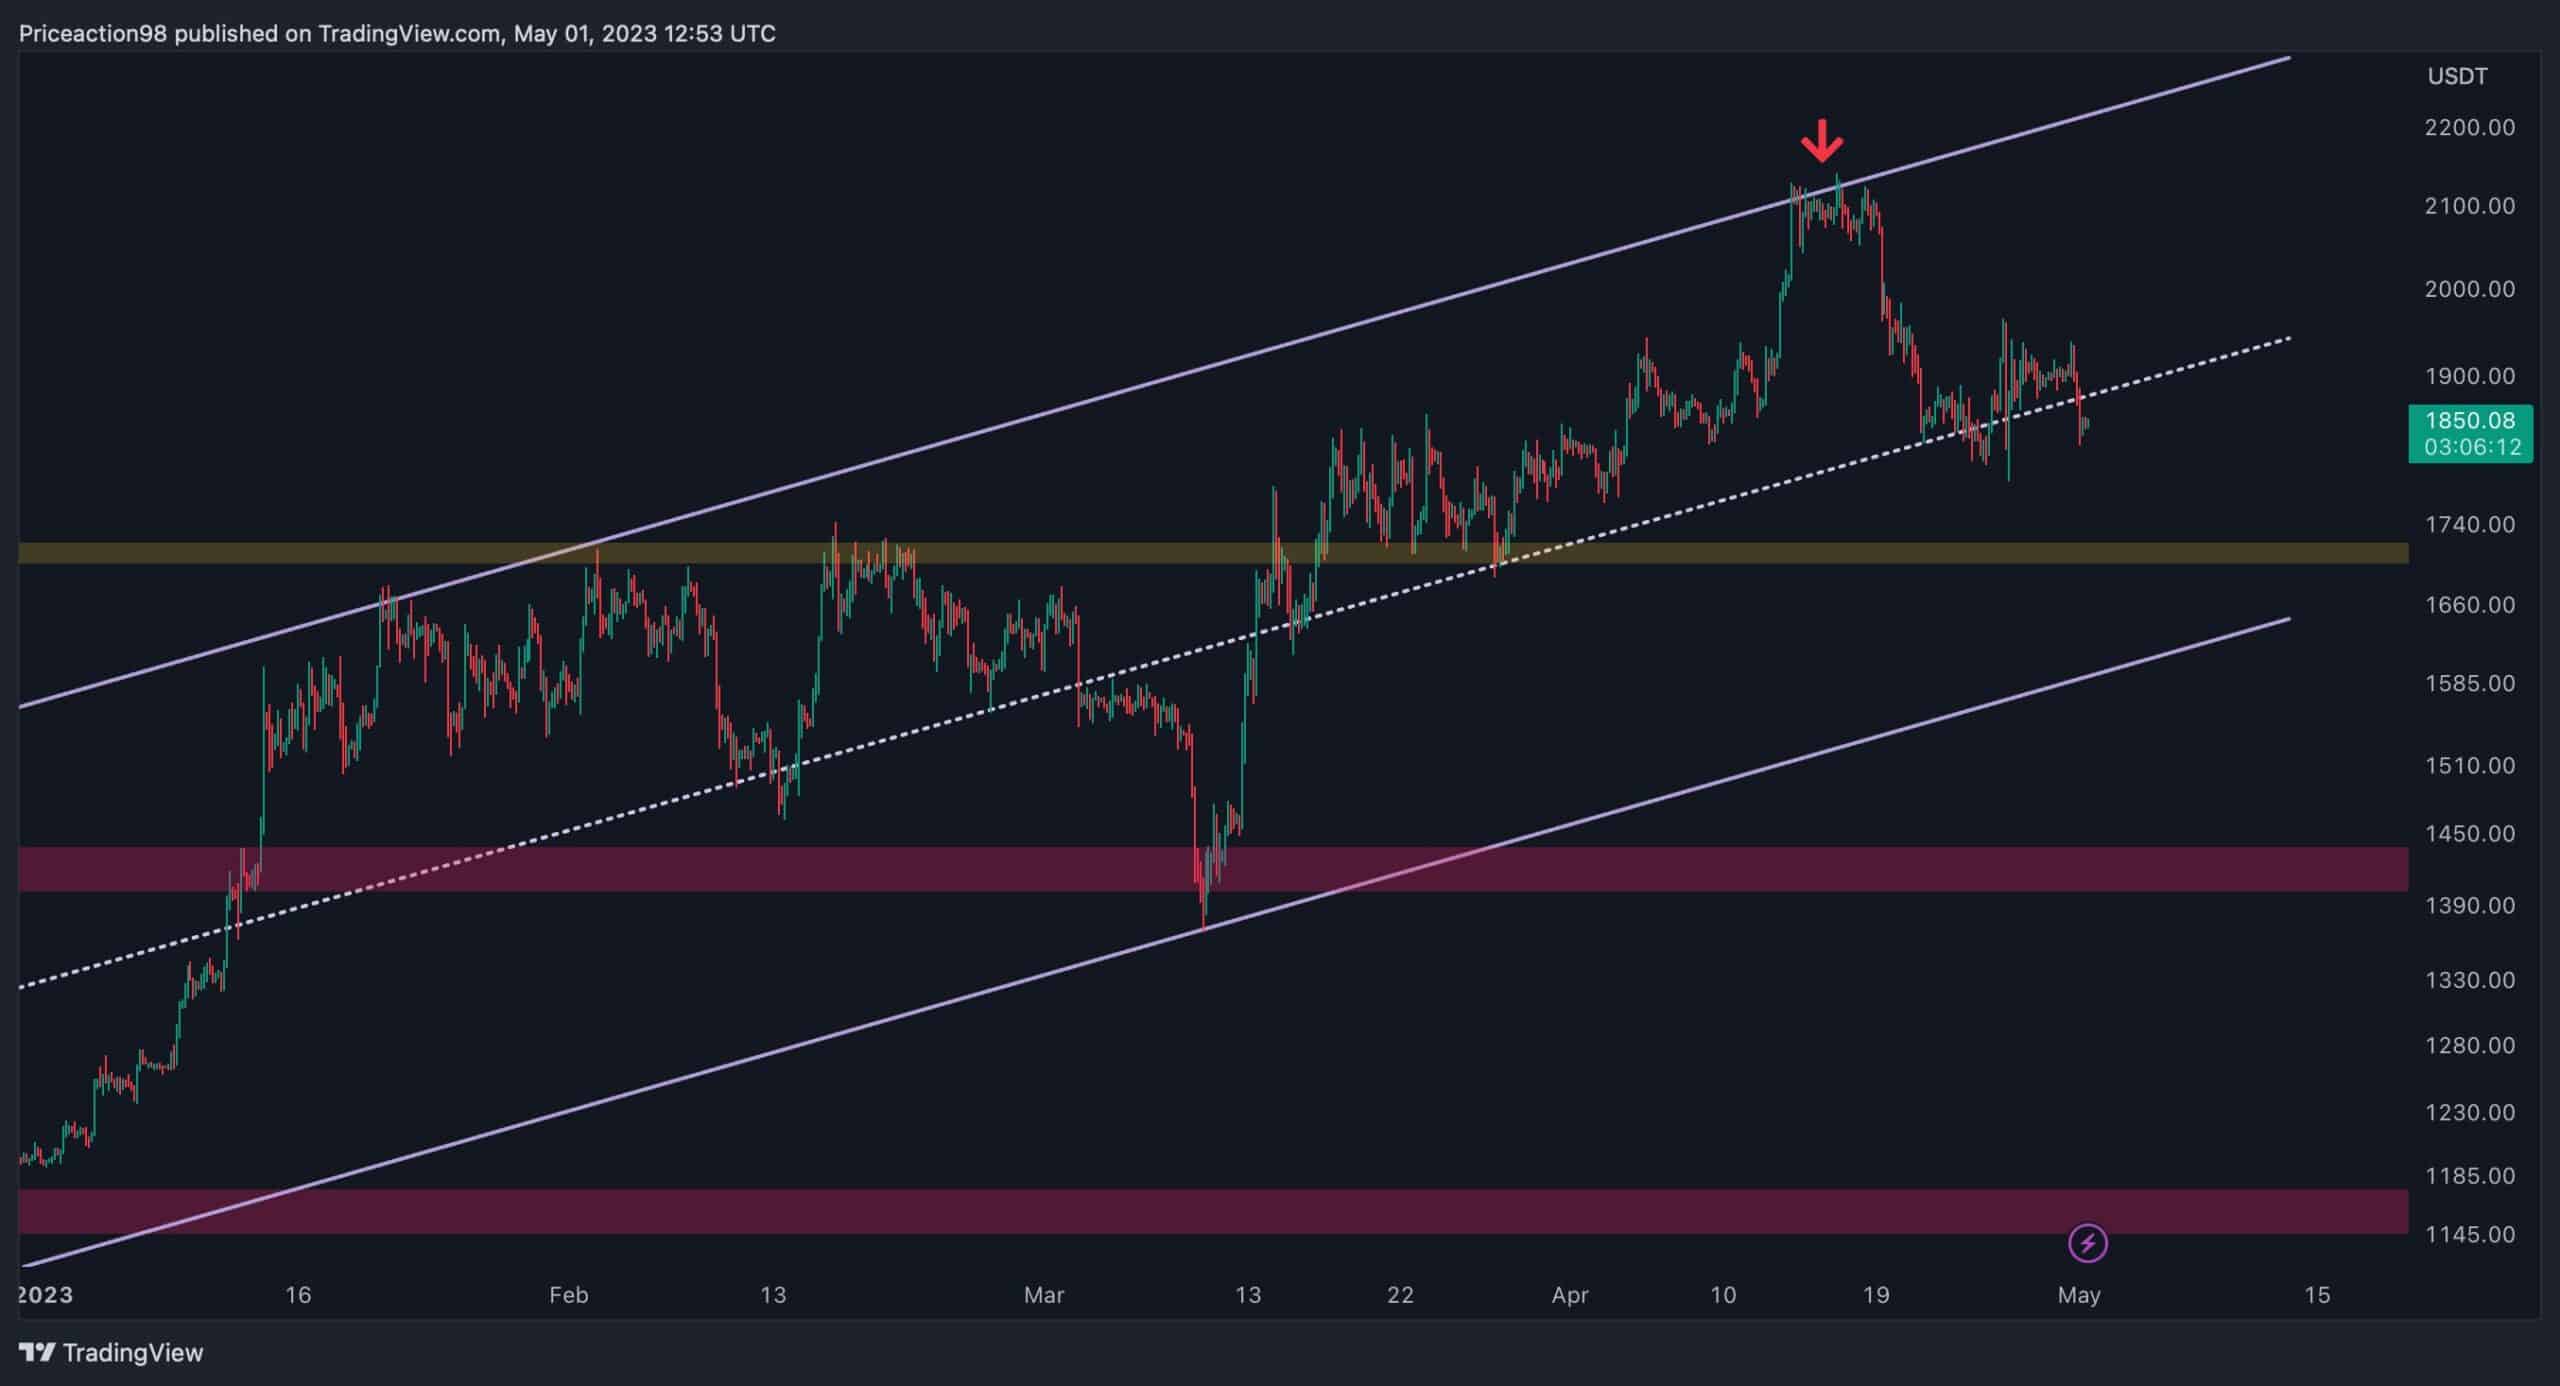
Analyzing the 4-hour chart, the price was rejected by the ascending channel’s upper threshold, leading to a downward trend toward the channel’s mid-trendline. Despite experiencing enormous volatility after reaching the trendline, the buying pressure in this critical region remains evident.
If the price falls below this essential level, the next stop for Ethereum would be at $1.7K. However, if ETH finds support in this region, the bulls may potentially attempt another run toward the $2.1K mark.

On-chain Analysis
By: Edris
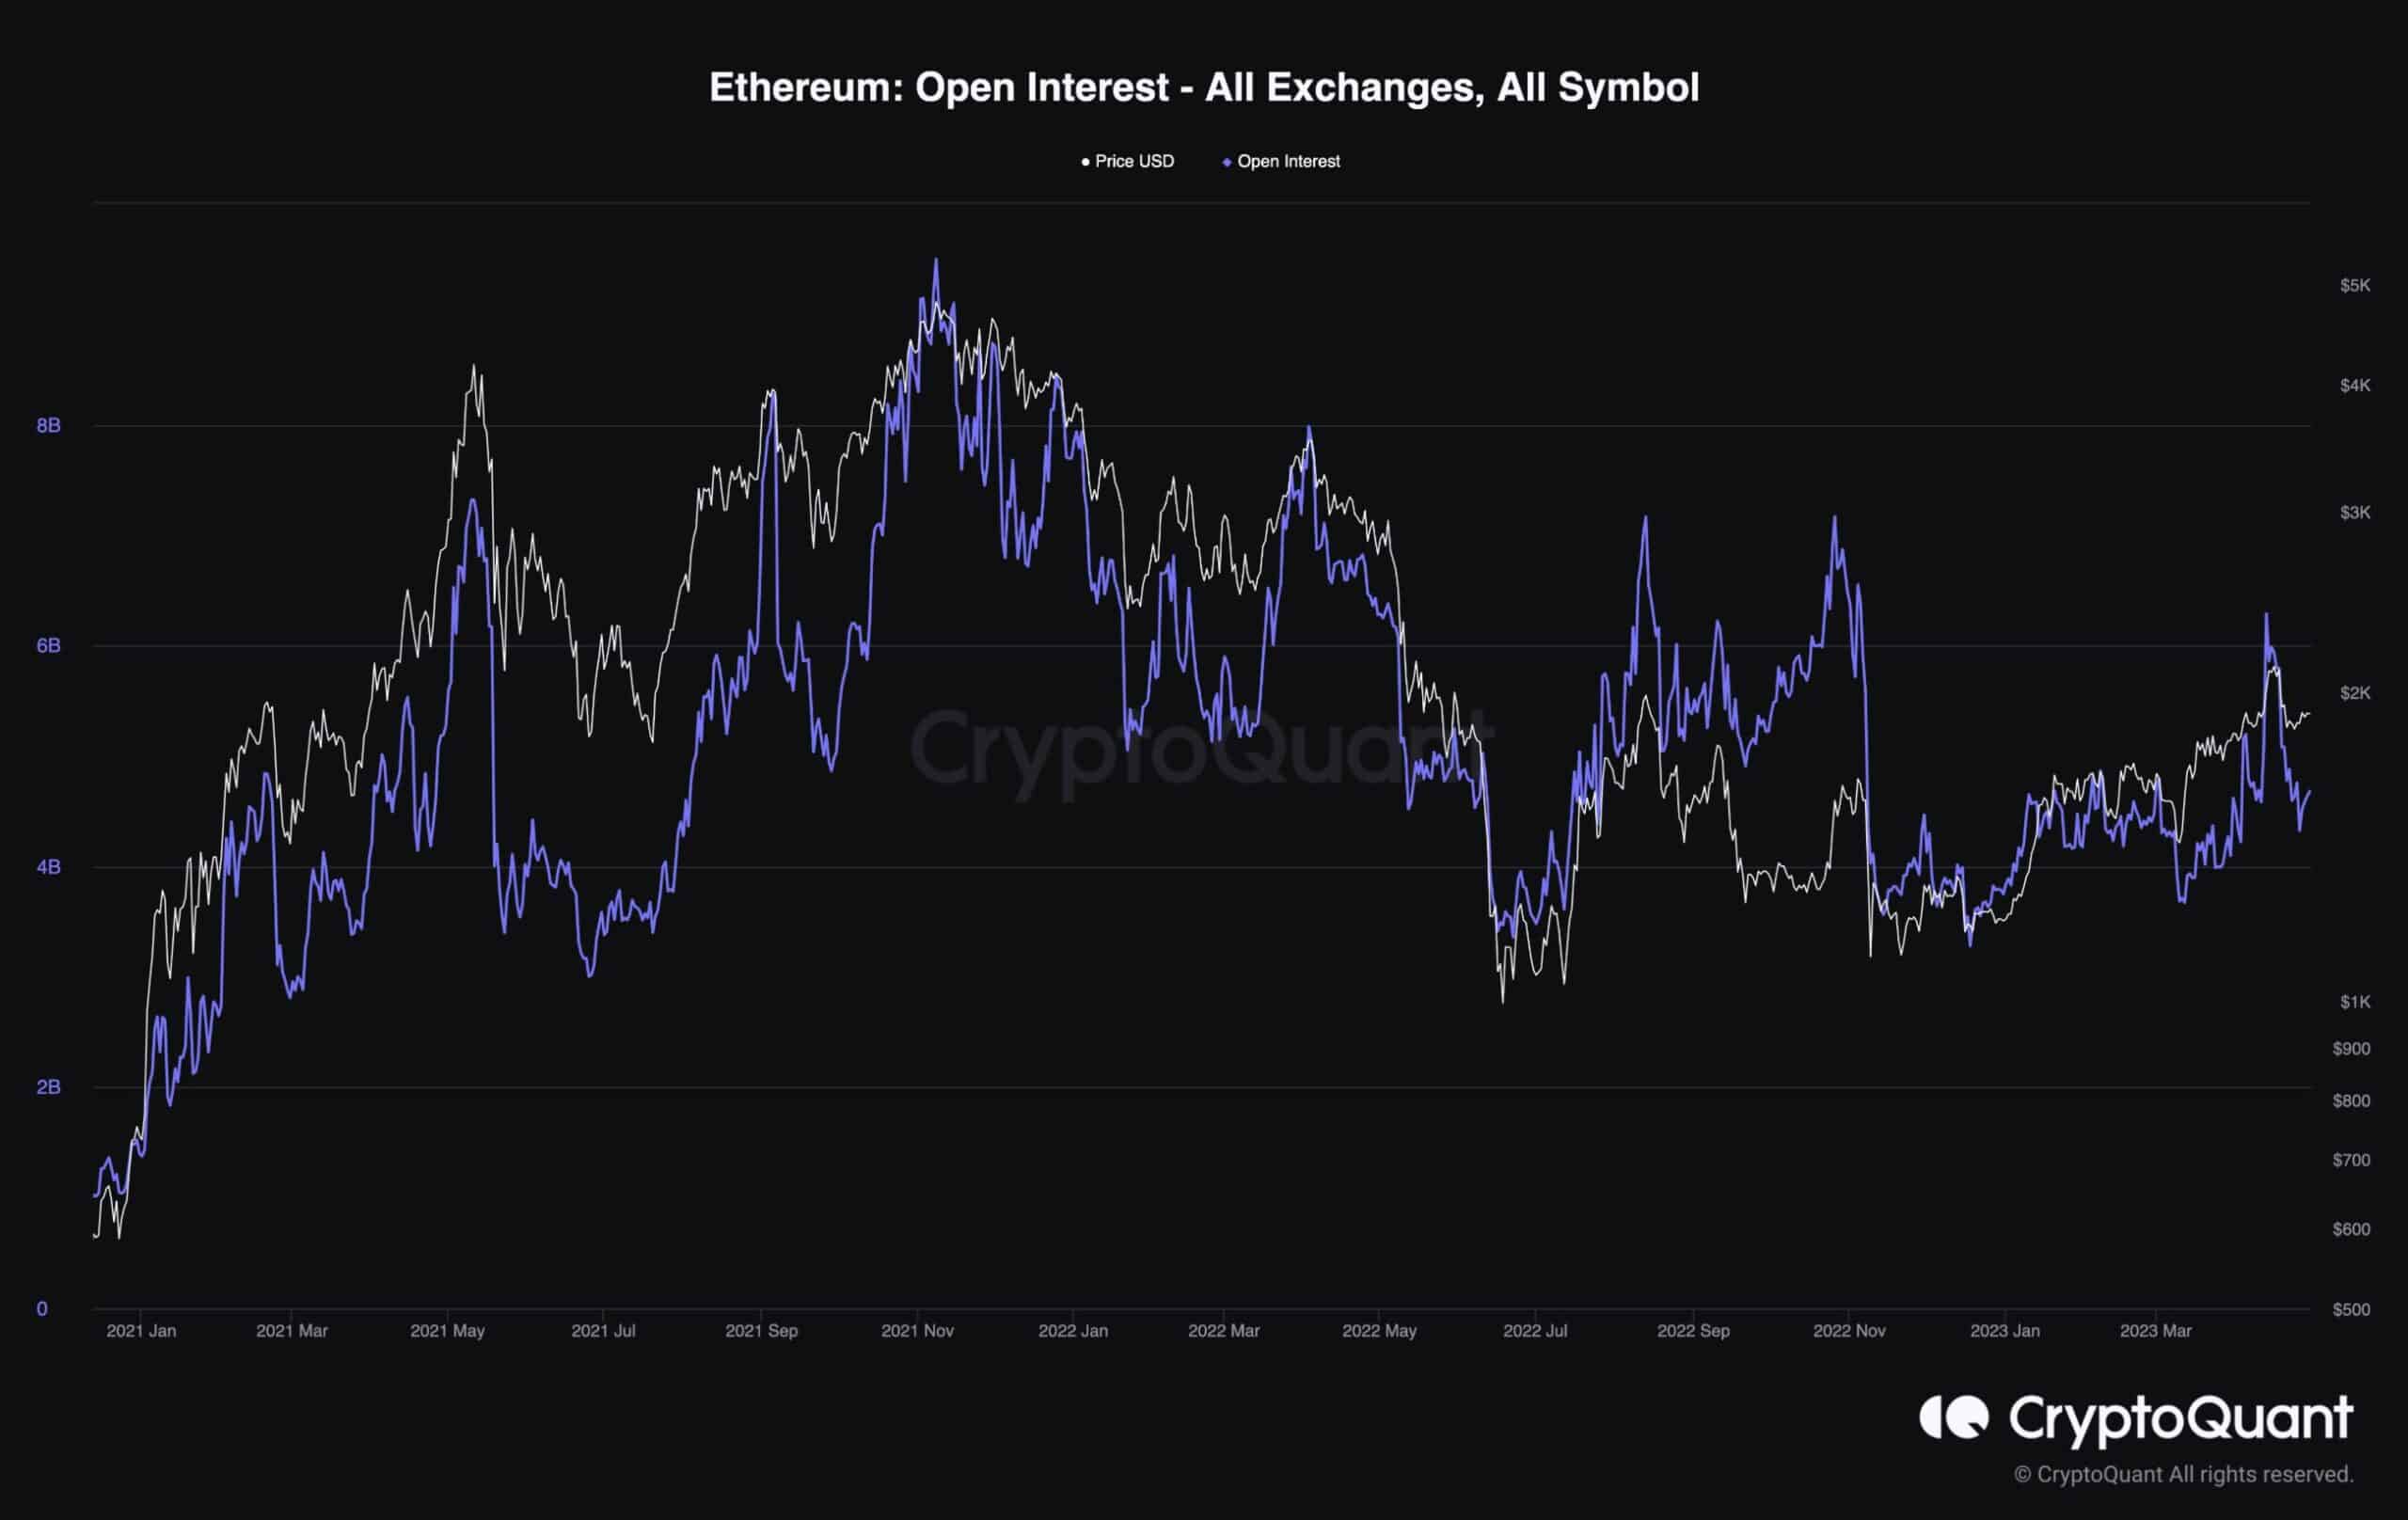
ETH’s price has plunged recently, following the uptrend over the recent months. Looking at the futures market sentiment metrics, it seems that the long liquidation cascade is the culprit.
This chart displays Ethereum’s Open Interest, which measures the number of open futures contracts. Open interest usually increases when the market sentiment is bullish and higher values lead to more volatility in the short term.
Considering the latest price action and the Open Interest chart, it is evident that this metric has been increasing towards the end of the recent rally but has also dropped significantly as the price has declined. This sudden decrease in price is likely due to the long positions being liquidated and adding to the selling pressure, further aggravating the decline.
This event is called a liquidation cascade and usually occurs when open interest rises rapidly. Yet, this metric is now showing lower values as a result of the massive liquidations, and lower volatility could be expected in the short term.

The post ETH Plummets 5% Daily, Will $1.8K Hold or is a Deeper Correction Inbound? (Ethereum Price Analysis) appeared first on CryptoPotato.


