ETH Needs to Break This Level to Take a Shot at $2K (Ethereum Price Analysis)
Ethereum continues its green streak and is currently charting a whopping 60% gain in the past seven days, trading around $1,600. The price is above the 200-week moving average, which is $1214.
Technical Analysis
By Grizzly
The Daily Chart
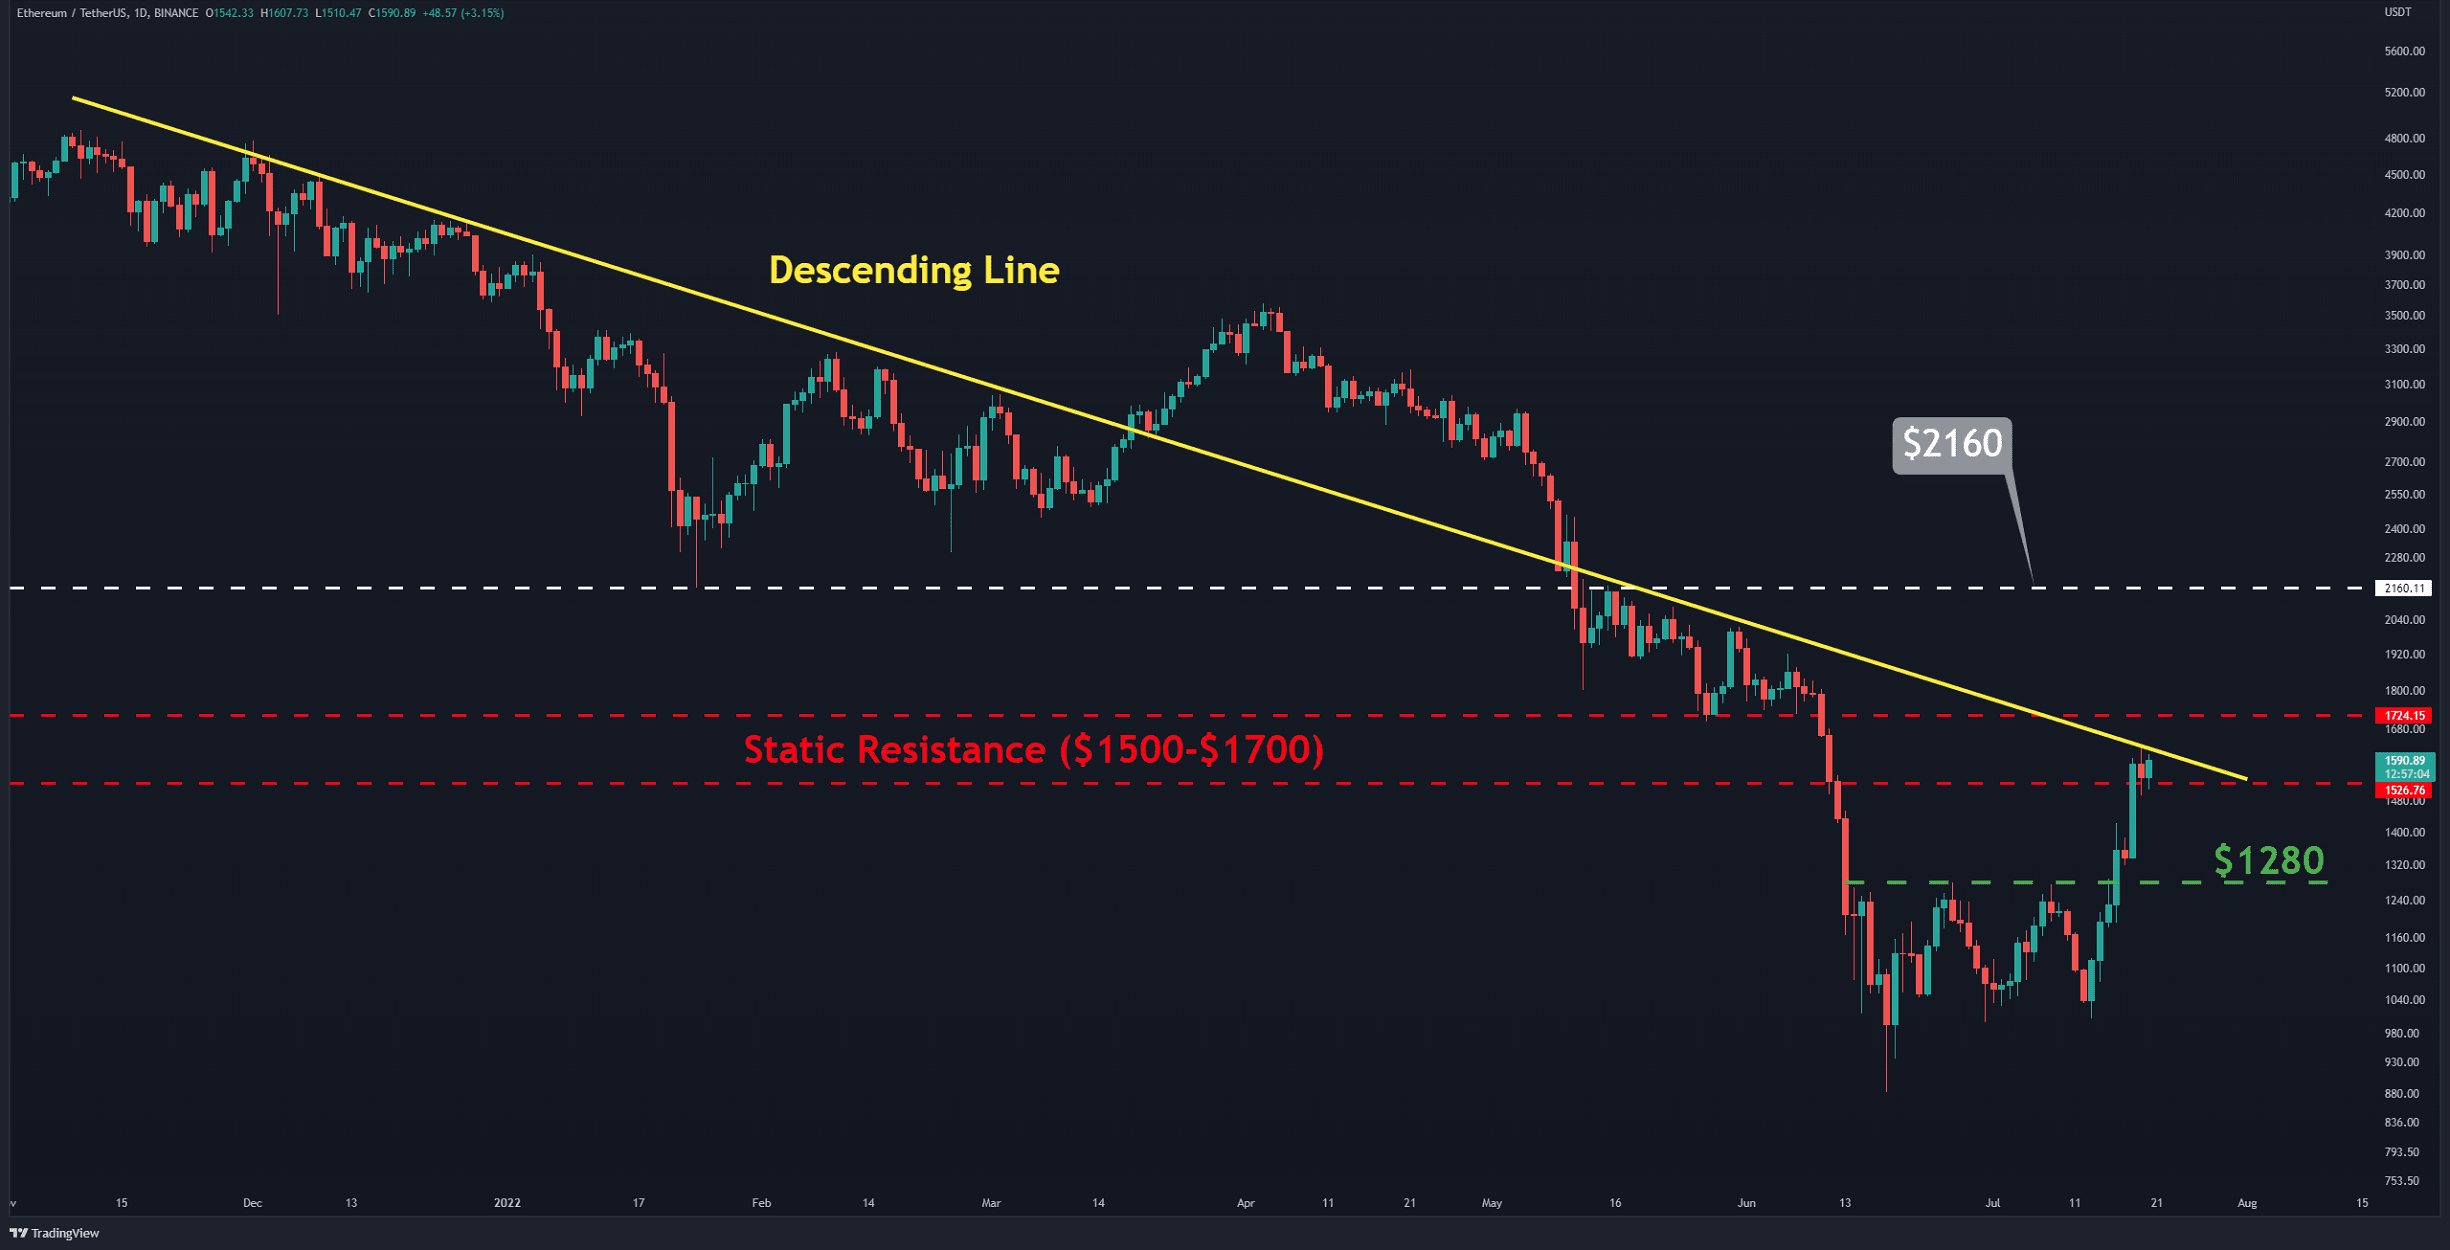
The bulls have pushed the price towards the resistance zone in the range of $1500-$1700 (in red). Ethereum has also touched the descending line (in yellow). This resistance has accompanied the price since the all-time high and has repeatedly prevented it from increasing further.
If the bulls want to revisit $2000, they will have to break out from this zone with a significant volume. Otherwise, if the upside momentum stall, participants should be prepared for a sharp increase in selling. This could send the price towards the horizontal support at $1280. However, as long as ETH trades above $1,280, the bullish momentum remains.
Key Support Levels: $1280 & $1000
Key Resistance Levels: $1700 & $2160

Daily Moving Averages:
MA20: $1230
MA50: $1321
MA100: $1903
MA200: $2435
The ETH/BTC Chart
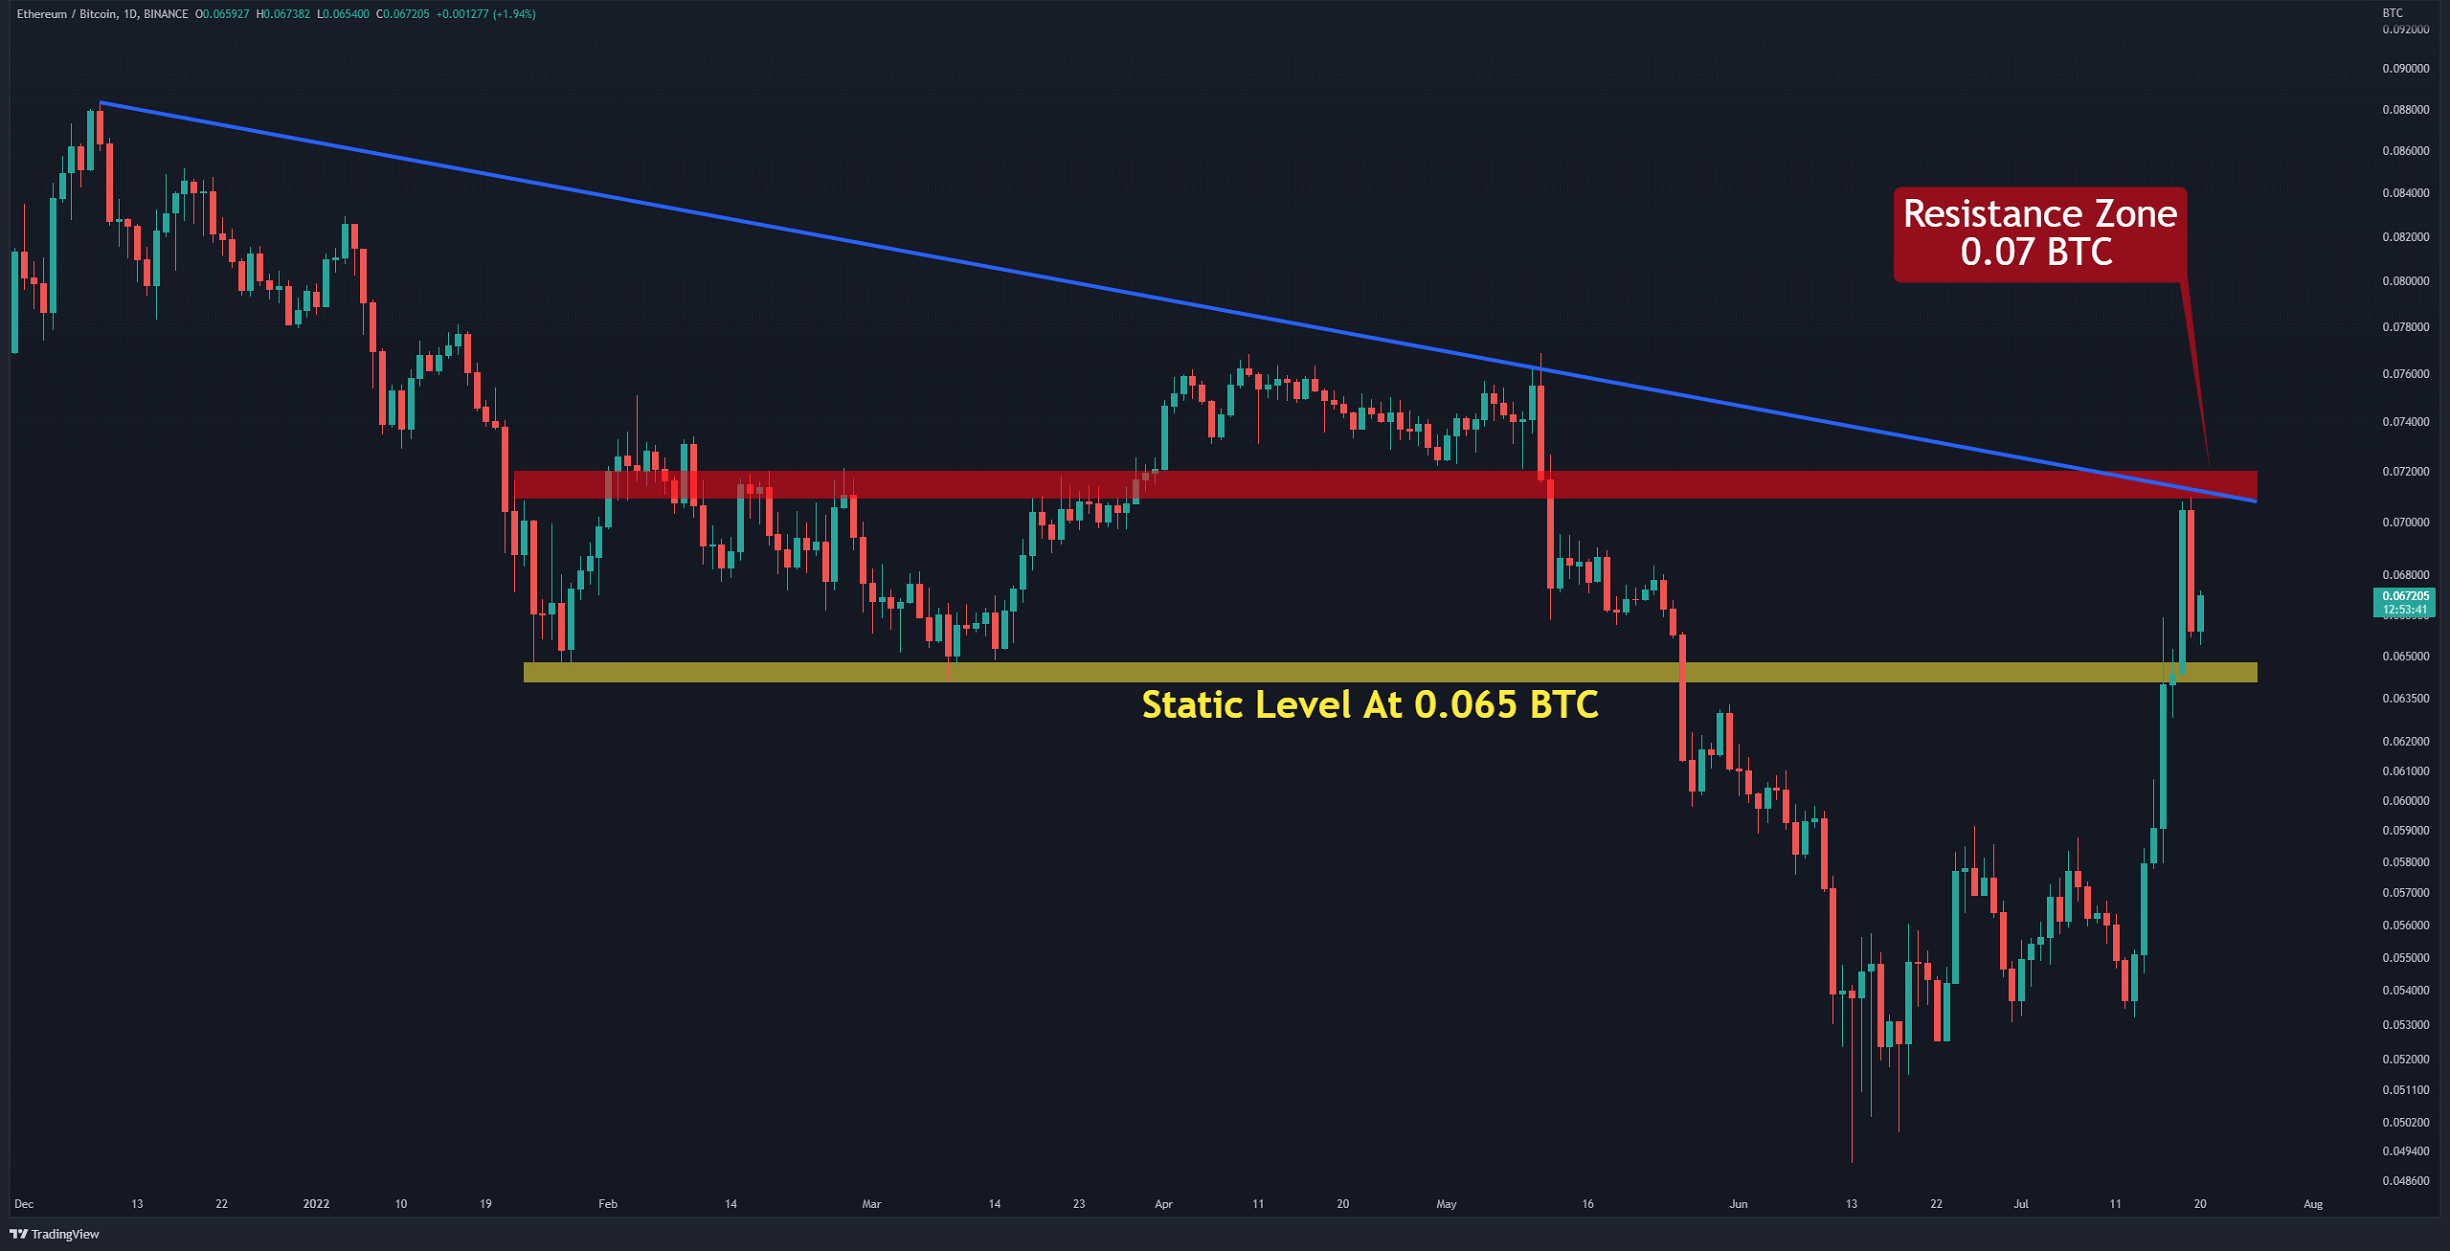
After rebounding off the bottom at 0.05 BTC, ETH has experienced a 33% increase against BTC. This bullish leg was stopped when the price hit the zone resulting containing the intersection of the horizontal resistance (in red) and the decreasing line (in blue) at 0.07 BTC.
From a technical point of view, the trend reversal has been confirmed by forming a higher high and higher low above 0.065 BTC. If Ethereum can reach above 0.07 BTC, this would instill further confidence in market participants. In this case, it is expected that the highest levels of 2021 to be retested above 0.08 BTC. This scenario is invalidated if the price goes below 0.06 BTC.

On-chain Analysis
Exchange Netflow
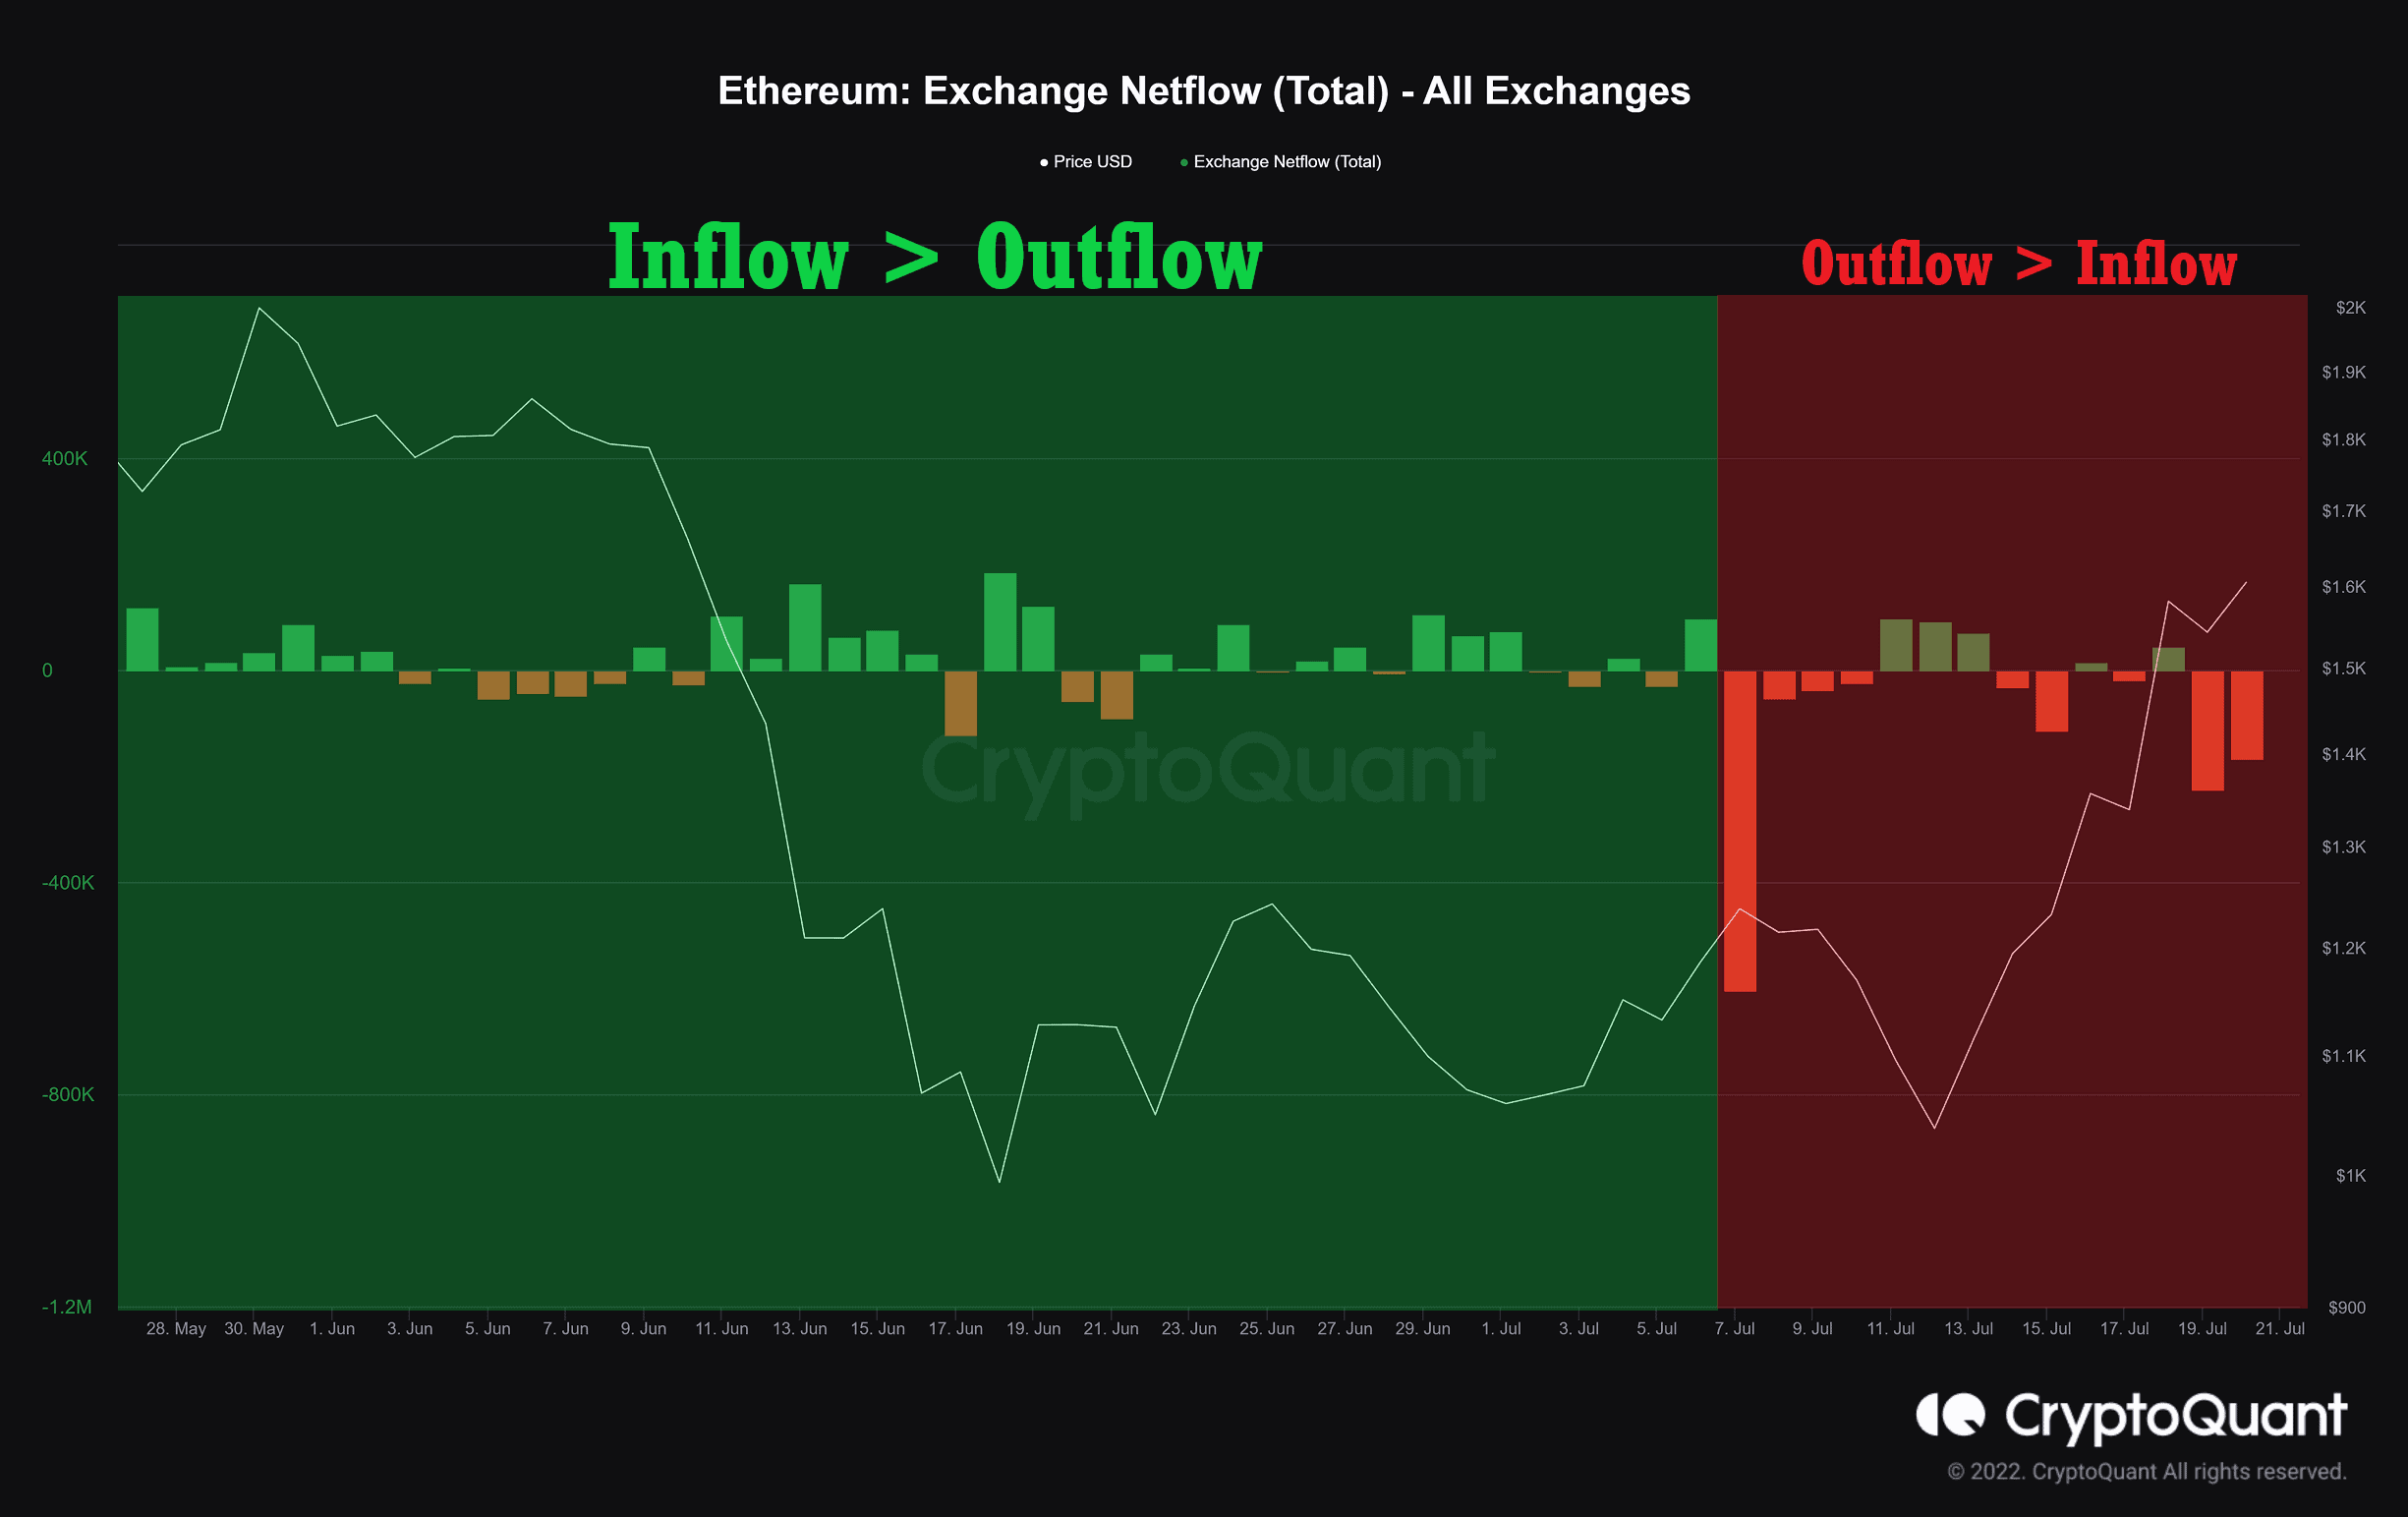
Definition: The difference between coins flowing into and out of the exchange. (Inflow – Outflow = Netflow). A positive value indicates reserve is increasing.
Finally, there are red histogram bars appeared in this chart after over two months. This shows that currently, more ETH is withdrawn from exchanges than it is being deposited. Oftentimes, in the short term, this is a positive sign as it reduces selling pressure.


