ETH Needs to Break This Level to Initiate a Rally (Ethereum Price Analysis)
Ethereum’s price has dropped below a significant resistance zone where the 100-day and 50-day moving averages and a recently formed channel’s middle boundary had a stronger confluence. Therefore, a possible uptrend will be possible only if the price exceeds this range. Oppositely, a rejection might trigger another bearish leg.
Technical Analysis
By Shayan
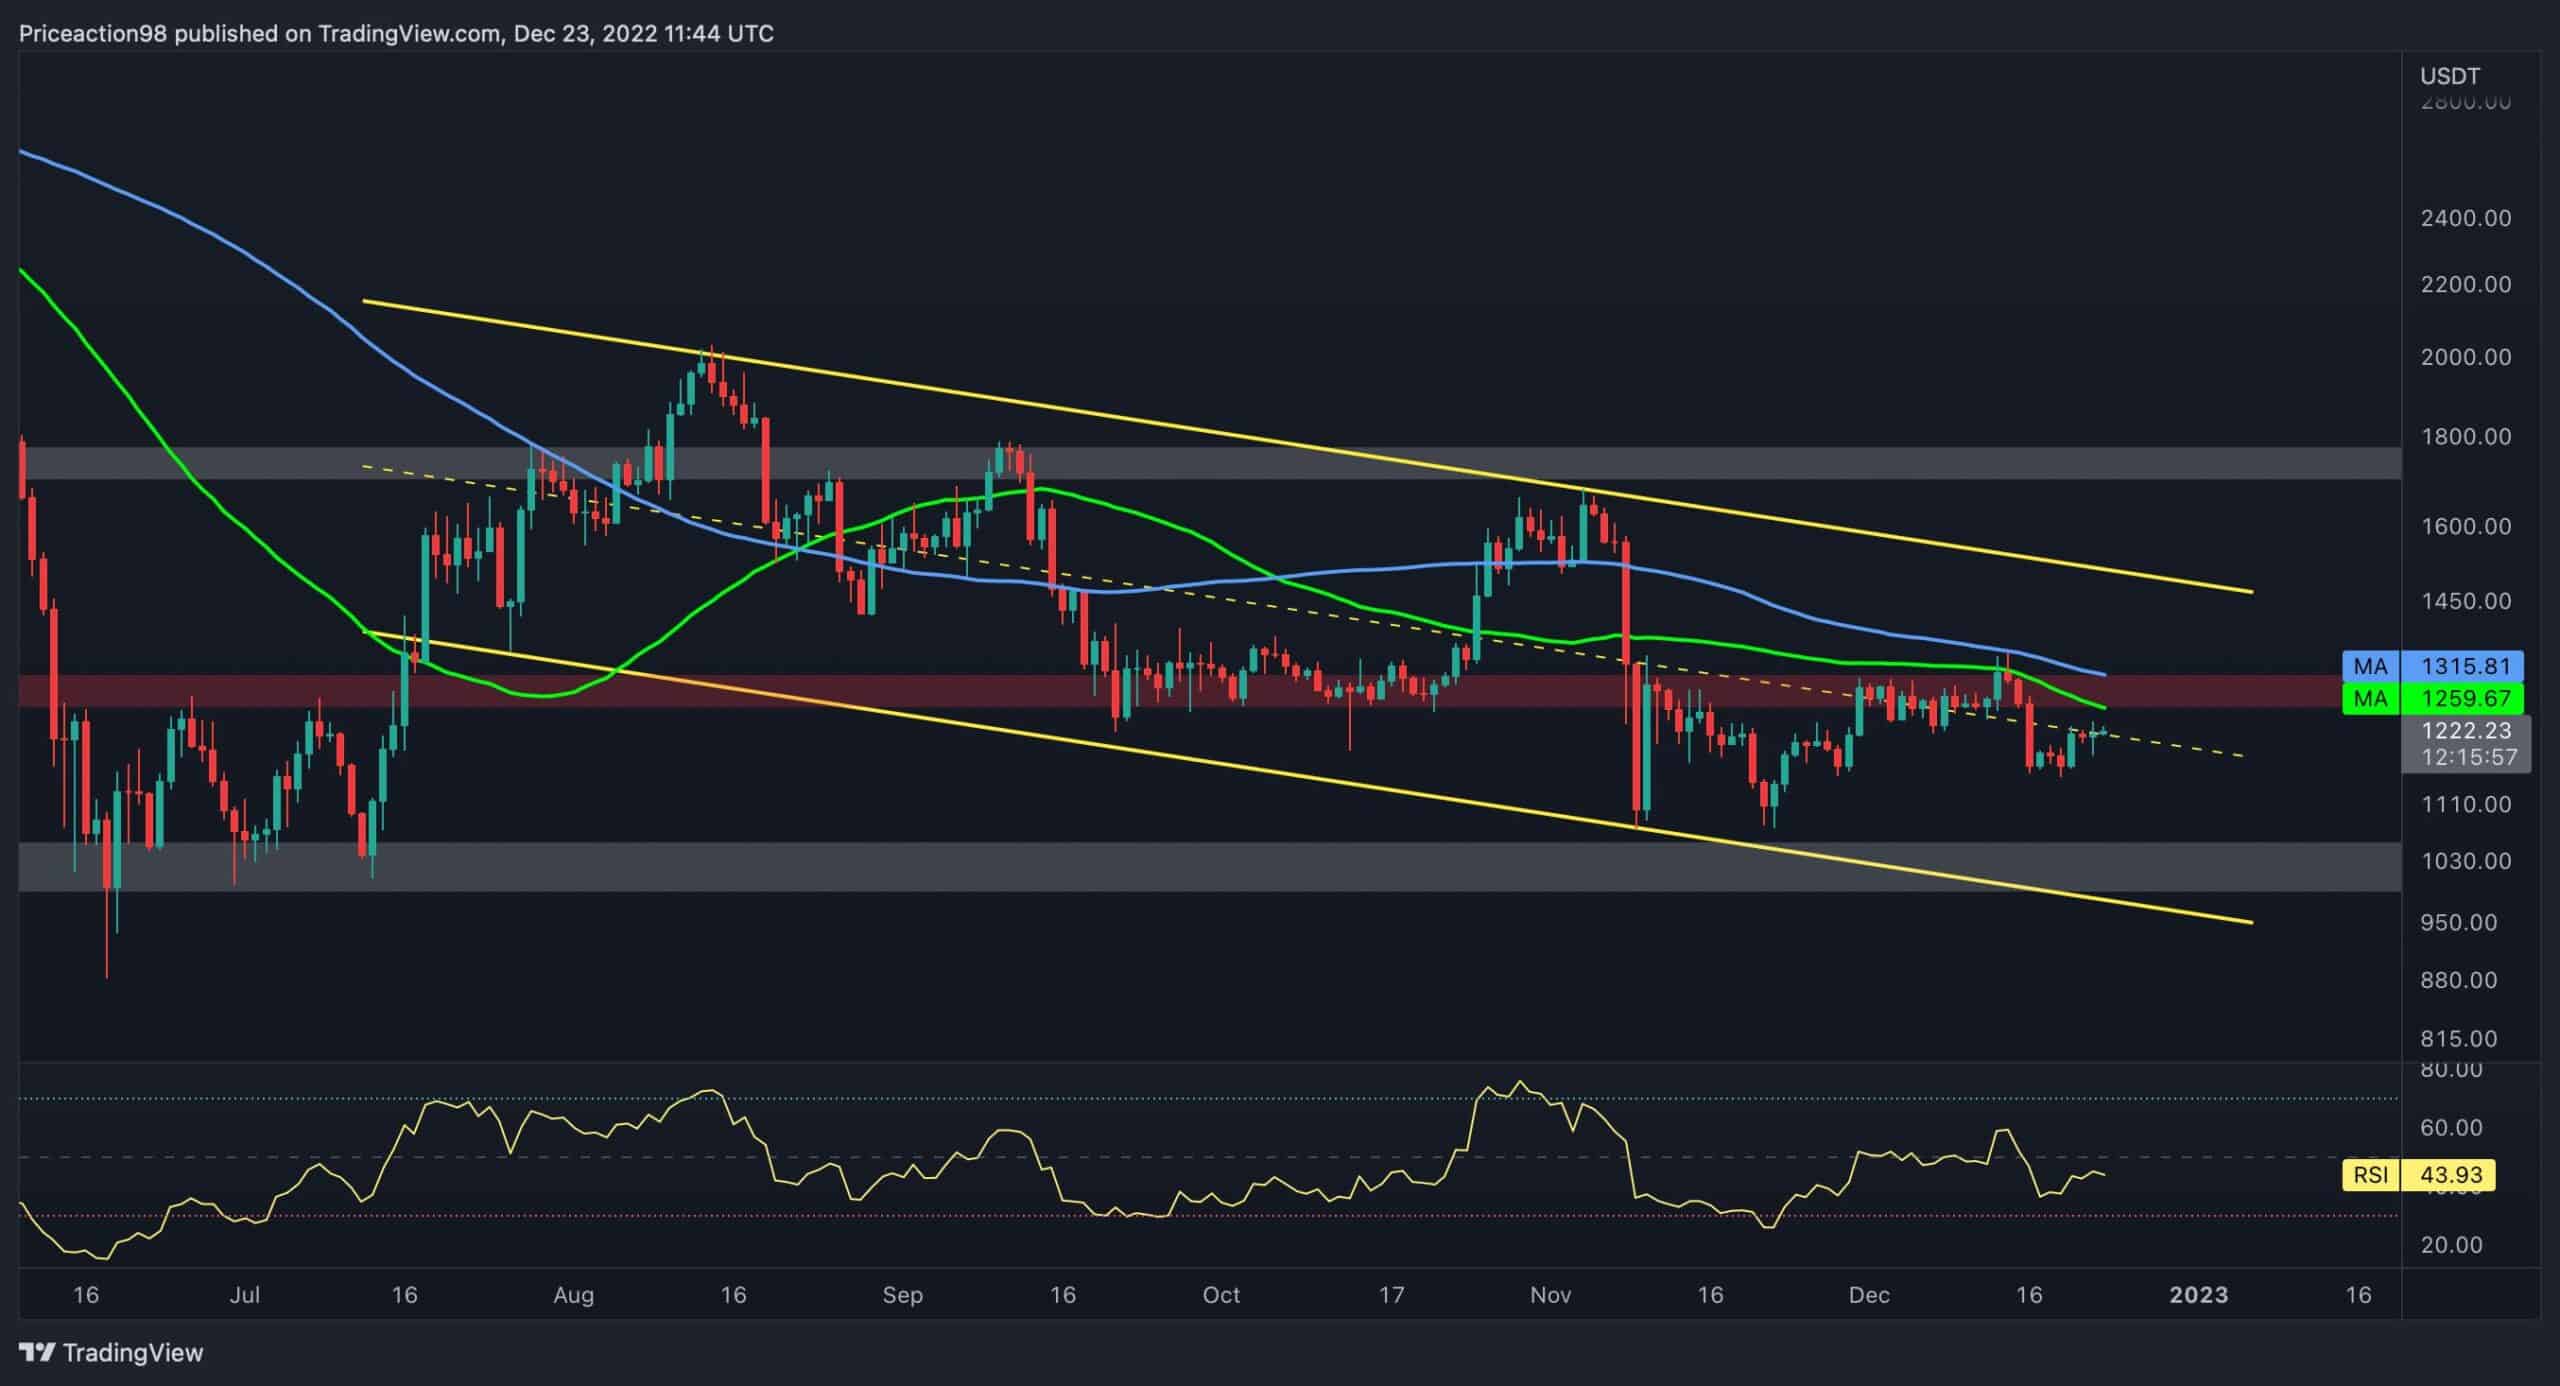
The Daily Chart
Ethereum’s price has been moving inside a descending price channel for six months. Most recently, the price failed to surpass the 100-day and 50-day moving averages at $1300. As a result, Ethereum plunged below the channel’s middle boundary and is currently attempting to retest it.
The alignment of the 50-day and 100-day moving averages and the static resistance level of $1300 makes this level a decisive one for the cryptocurrency. If the price breaks above the resistance zone mentioned above, the channel’s upper trendline around the $1500 mark would be the main barrier to the price. However, based on the current market sentiment, a drop toward $1000 would be the more likely scenario in the short term.
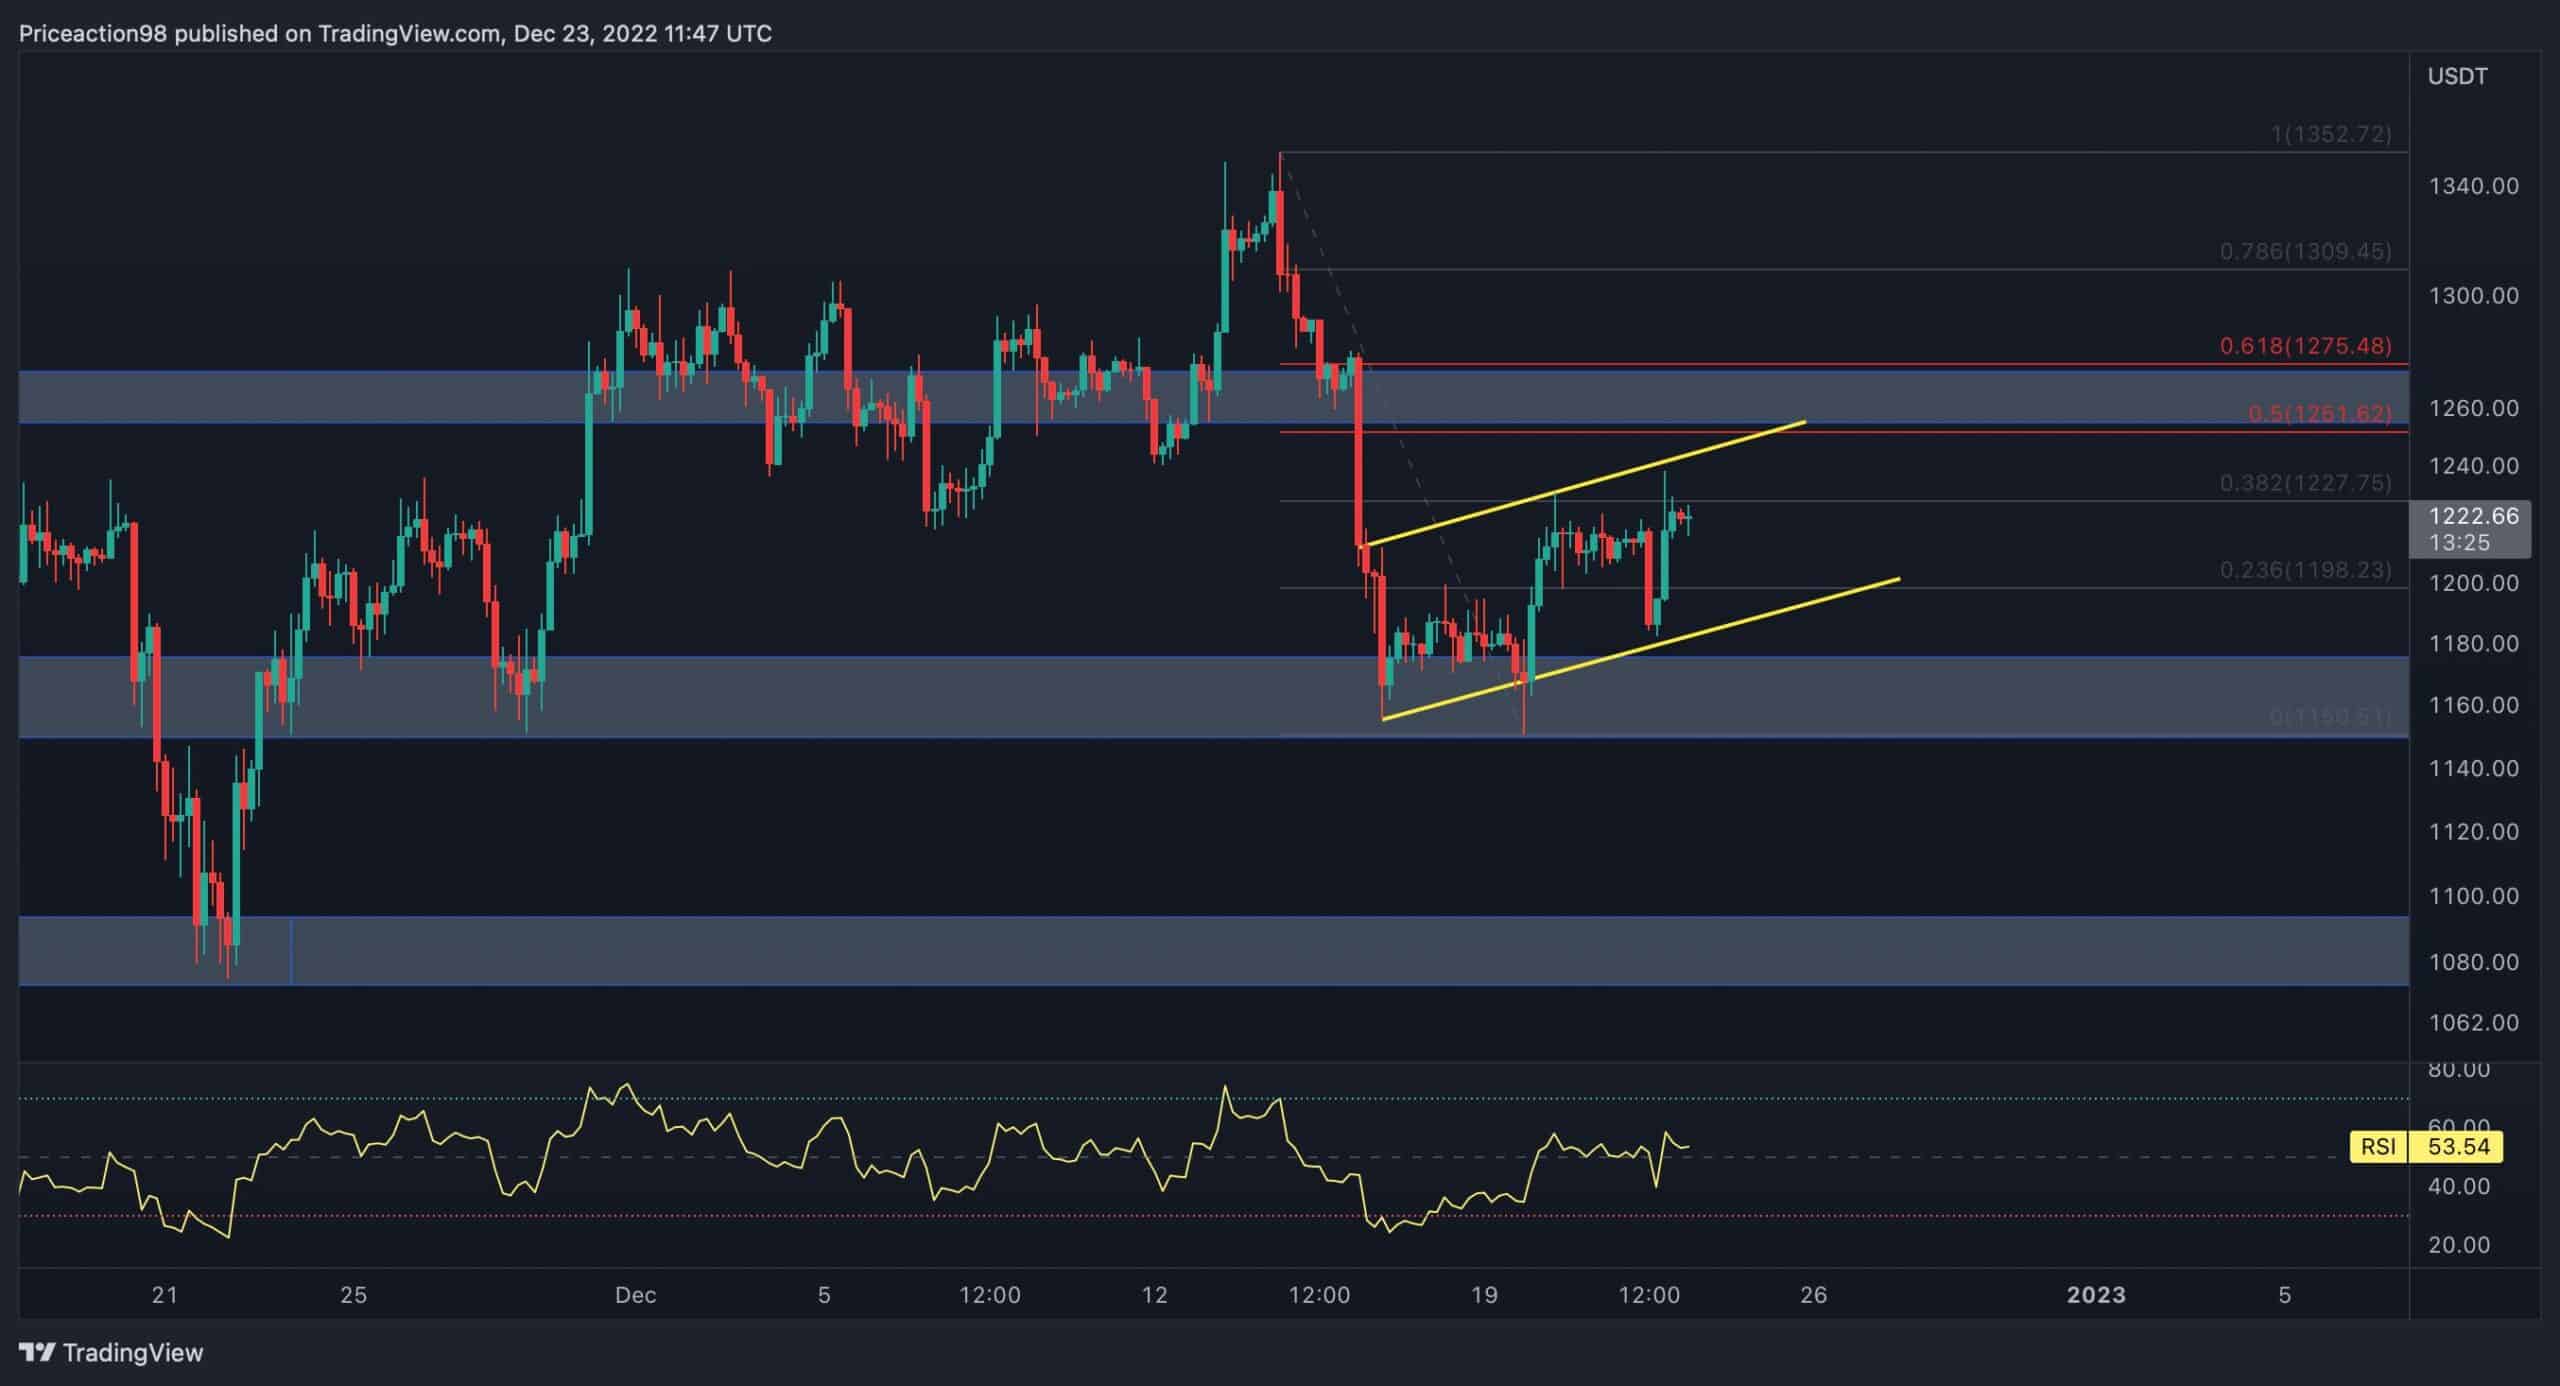
The 4-Hour Chart
In the 4-hour timeframe, the price had experienced an impulsive bearish rally and is consolidating in the form of a well-known continuation correction pattern called an ascending flag. On the other hand, the 0.5-0.618 area of the Fibonacci retracement, standing at $1251-$1275, coincides with the static resistance level of $1260.
Considering the importance of this resistance level and the bearish continuation flag pattern, the potential of getting rejected from the $1251-$1275 region, marking another bearish impulsive move towards the $1000 level, is high. Nevertheless, if the price surpasses the abovementioned level, the bulls could push the price higher.
Onchain Analysis
By Shayan
The following chart demonstrates the Exchange Reserves metric alongside Ethereum’s price. The metric has been in a downtrend since July 2020. However, after the massive price crash in November, the Exchange reserves metric experienced a significant decline and dropped to a new low.
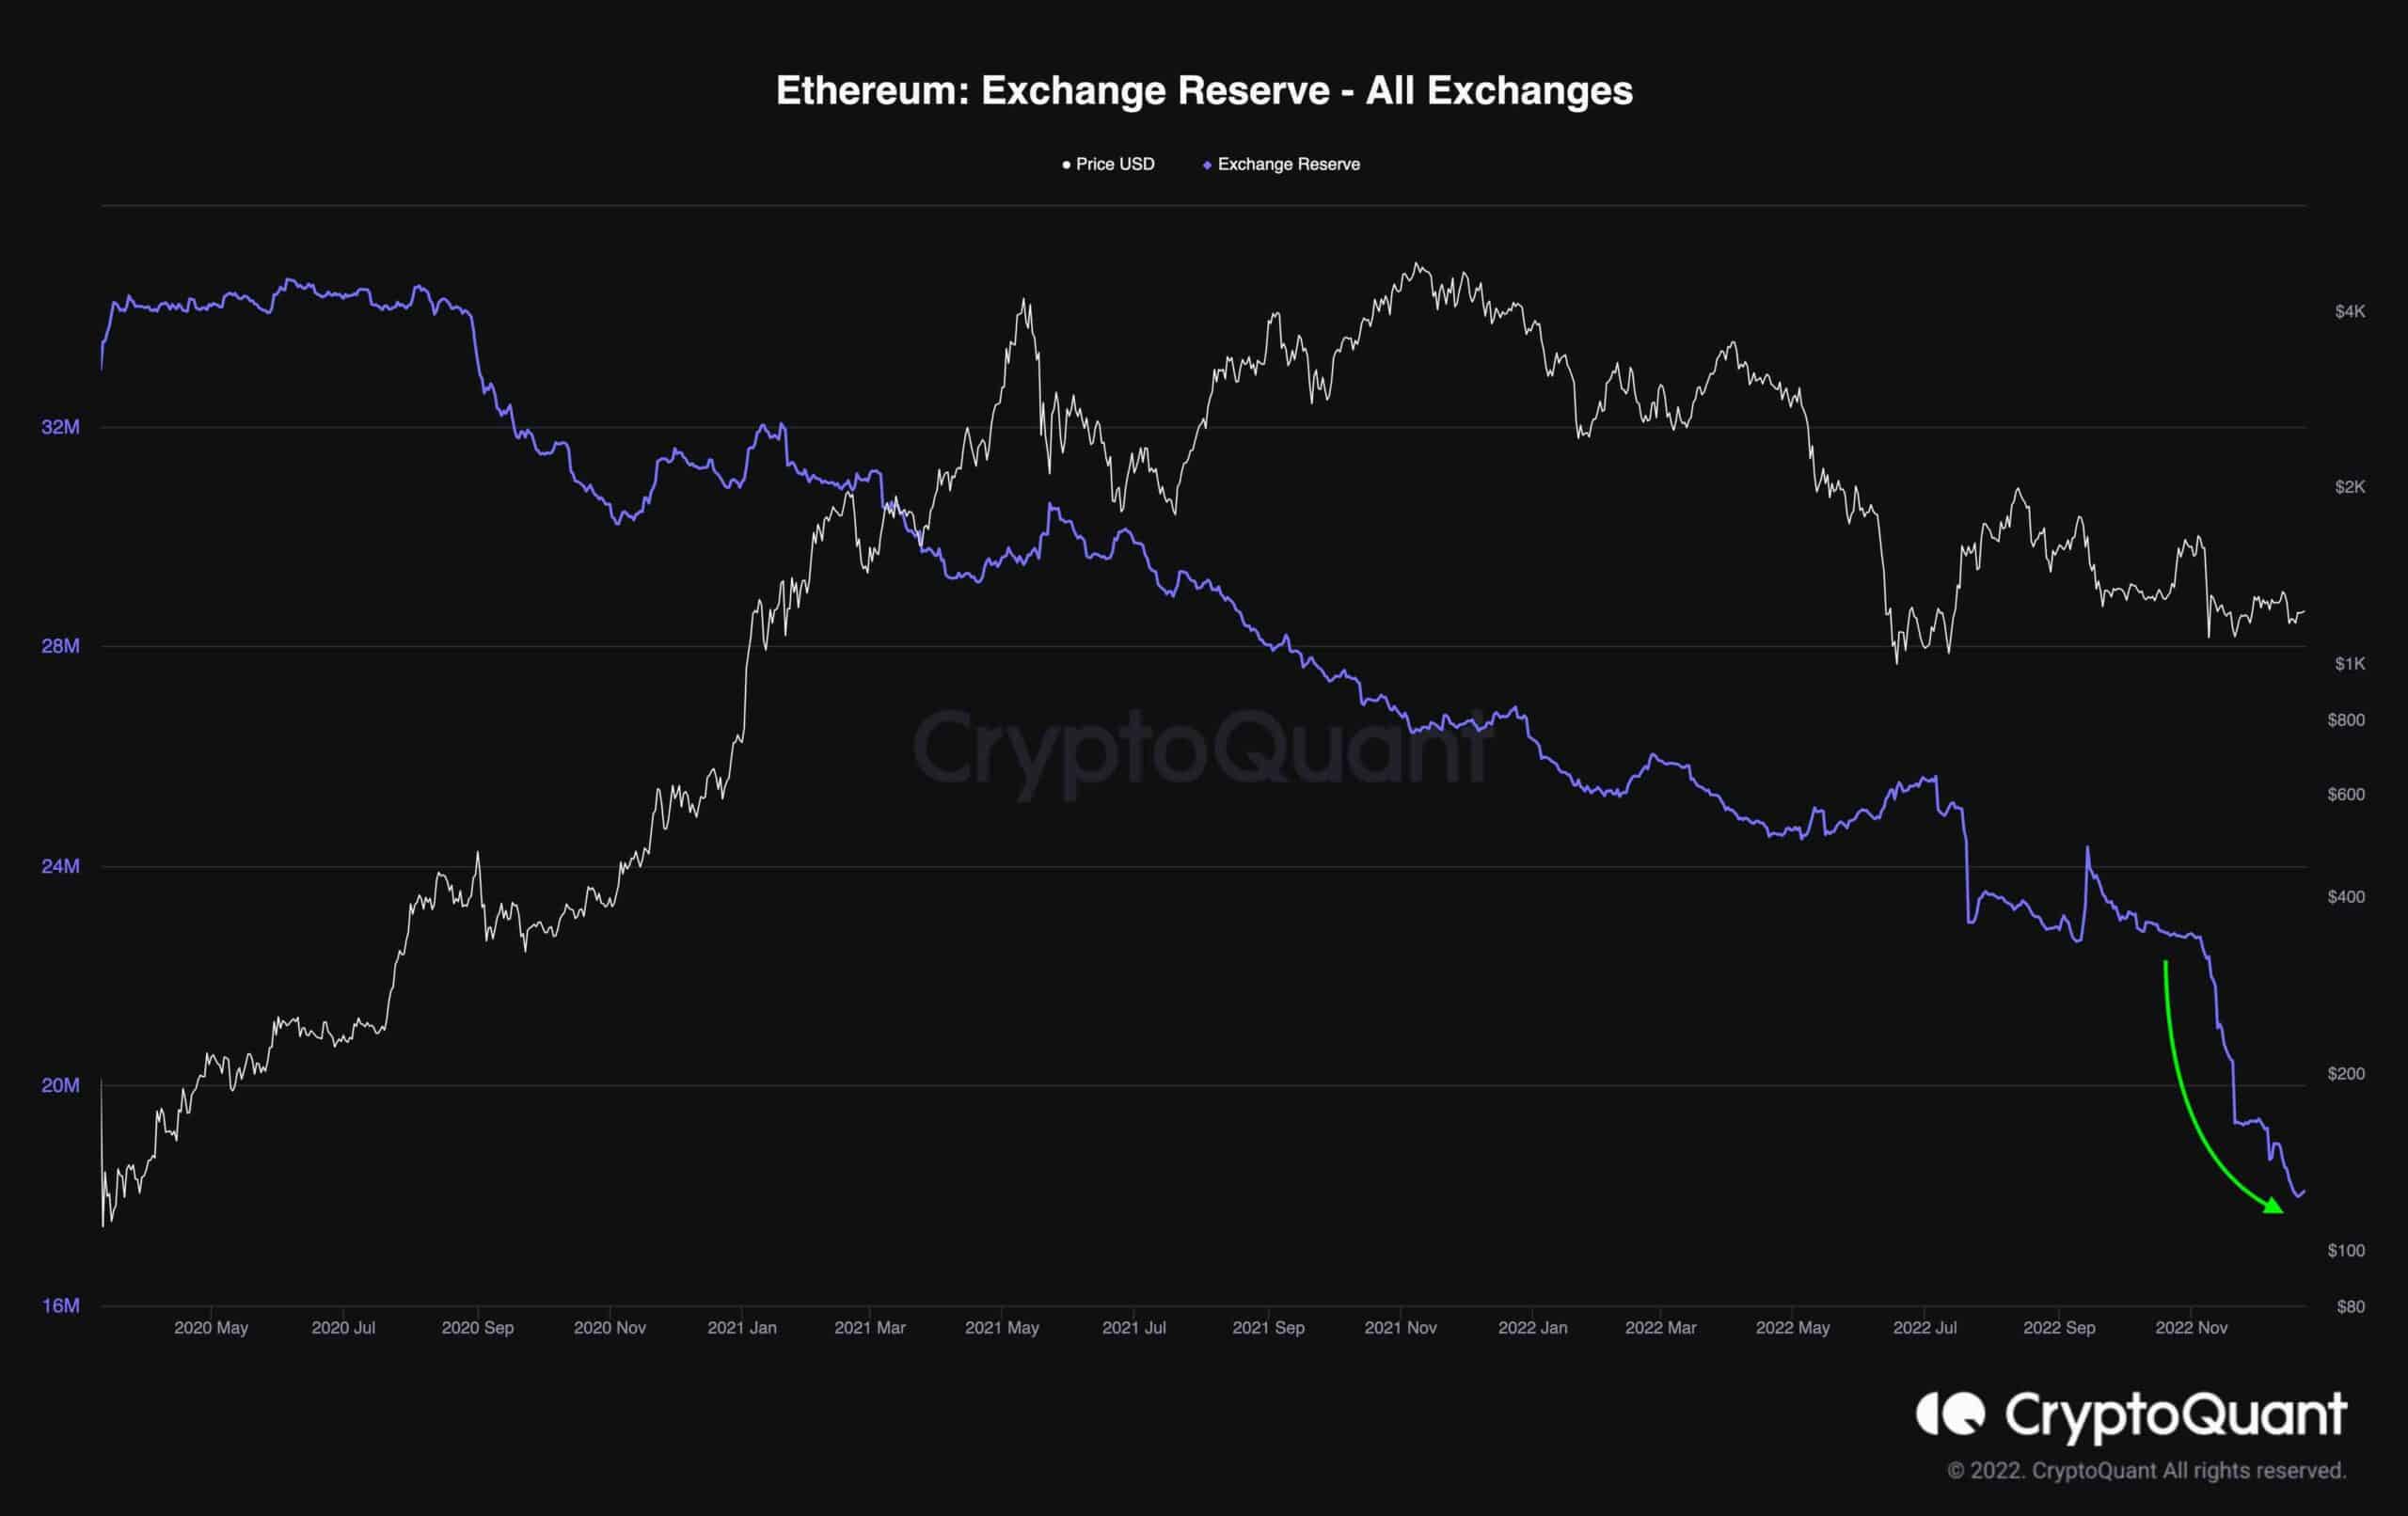
This indicates that the market participants are offloading their assets from exchanges following the FTX collapse. This results in a substantial market capitulation stage that might finally trigger the last phase of the recent bear market.
The post ETH Needs to Break This Level to Initiate a Rally (Ethereum Price Analysis) appeared first on CryptoPotato.