ETH Loses 15% Since the Merge as Bears Take Control (Ethereum Price Analysis)
Ethereum finally migrated to a proof-of-stake consensus algorithm. The event triggered a wave of selling which was probably propelled by those who bought ETH to receive the ETHW airdrop. Because of this, the price has declined by some 15% in the past couple of days.
Technical Analysis
By Grizzly
The Daily Chart
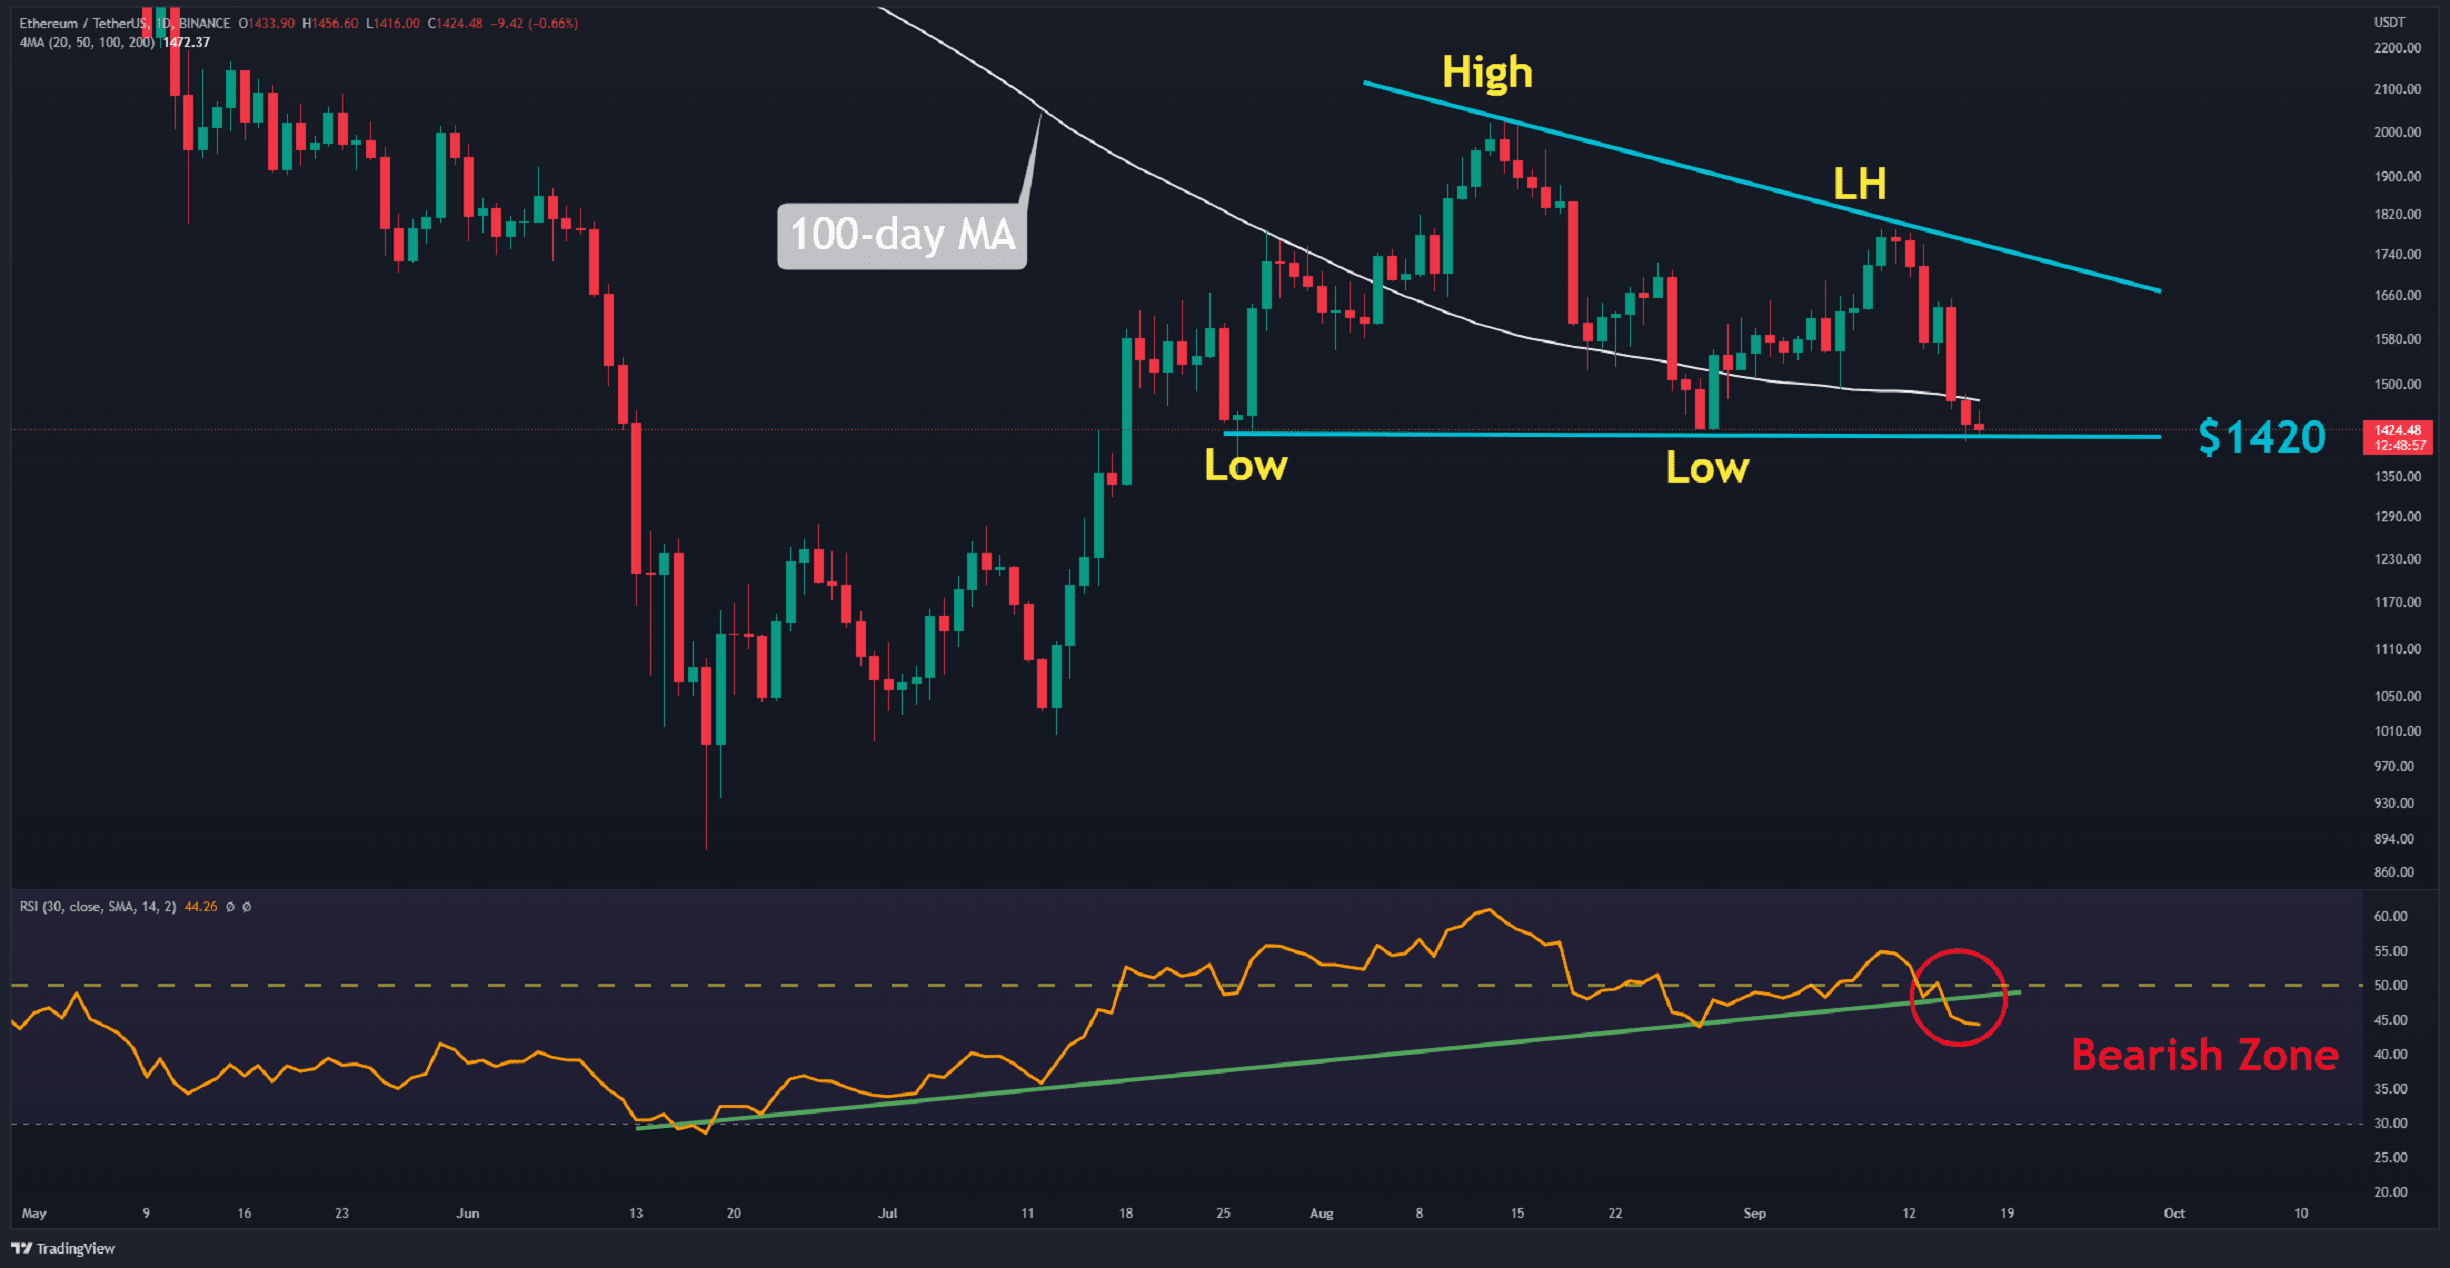
Ethereum is forming its third straight red candlestick on the daily timeframe. The cryptocurrency is currently back at a level defended by the bulls in the last two months.
Technically, the pattern revealed in the chart is bearish – a descending triangle (in light blue). Also, after a lengthy period, the 30-day Relative Strength Index (RSI) has lost the support of the ascending line (in green), which held its position above it for three months.
This indicates that a further correction can begin so long as the bears drive the price below $1,420. Such a scenario can initially extend the price down to $1,280. Given the market’s current bearish sentiment, it will be exceedingly challenging to reclaim any lost support in this situation.
If the asset recovers above $1,550 and the RSI returns above the baseline, the previous scenario would be invalidated.
Key Support Levels: $1420 & $1280
Key Resistance Levels: $1550 & $1700
Daily Moving Averages:
MA20: $1594
MA50: $1665
MA100: $1472
MA200: $2051
The ETH/BTC Chart
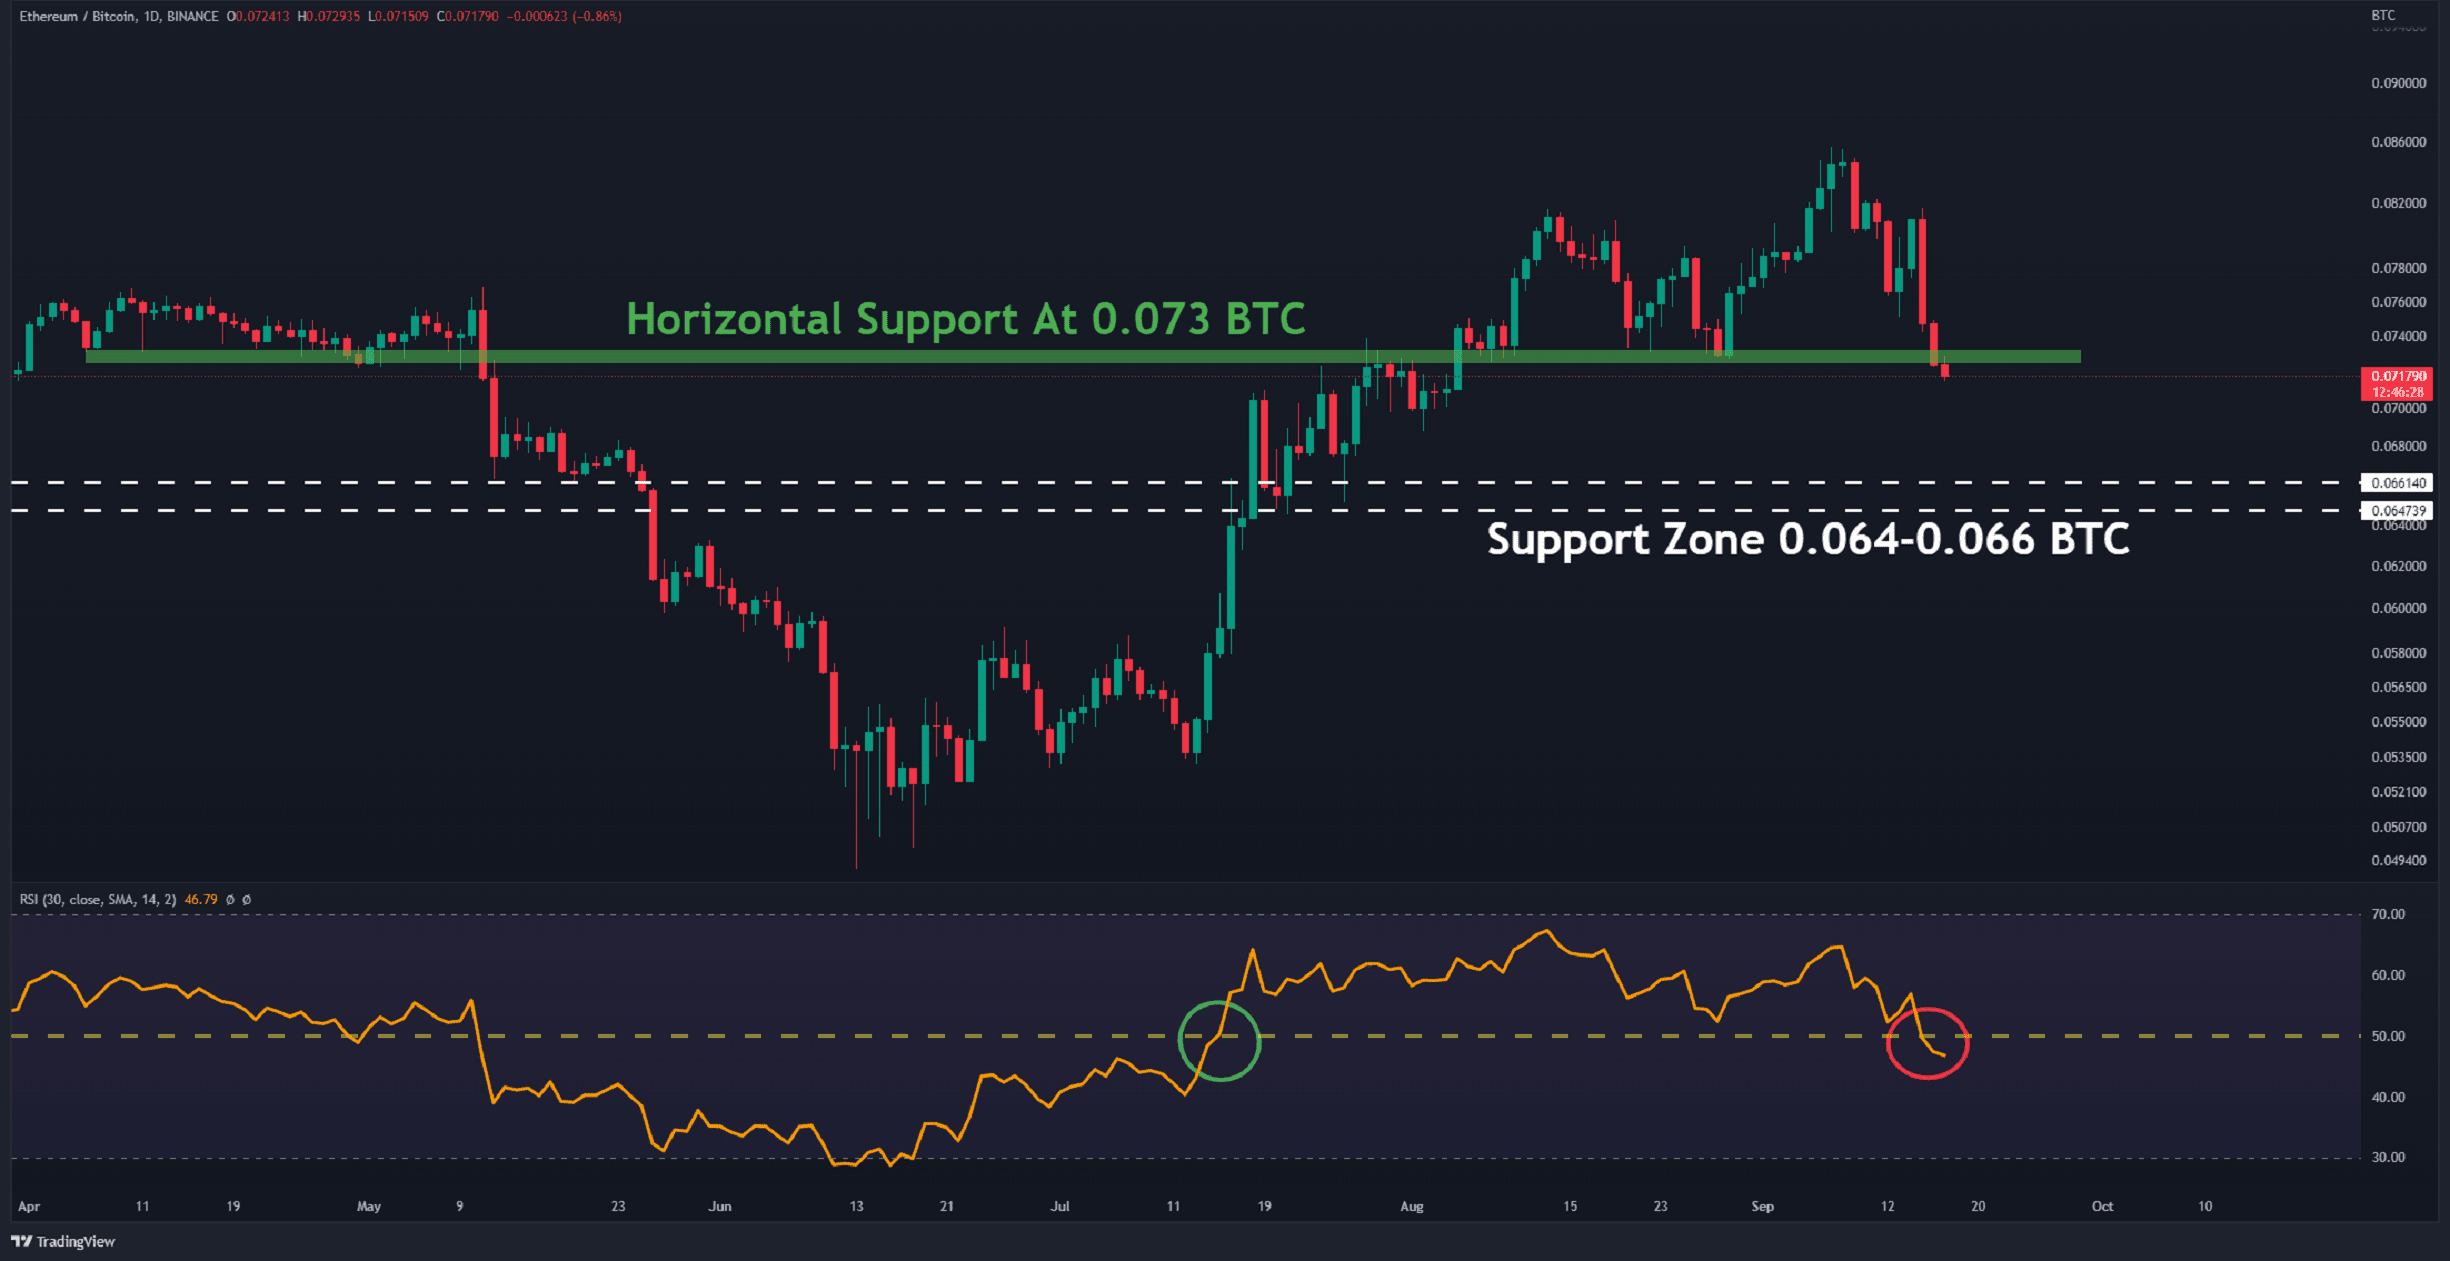
Against Bitcoin, the cryptocurrency trades below a critical support. A trend reversal would be confirmed by a break and closing below the horizontal support level at 0.073 BTC (in green). In this case, the next support is found in the range of 0.064-0.066 BTC (in white).
Additionally, the RSI has returned below the baseline after 63 days, demonstrating the market domination of the bears.
Key Support Levels: 0.066 & 0.064 BTC
Key Resistance Levels: 0.073 & 0.08 BTC
The post ETH Loses 15% Since the Merge as Bears Take Control (Ethereum Price Analysis) appeared first on CryptoPotato.