ETH Finally Reclaims $250 In Wake of Bitcoin’s Latest Rally, What’s Next? Ethereum Price Analysis
- Ethereum surged by a total of 6% over the past 24 hours of trading as the coin breaks $250.
- Before this, ETH was struggling with the resistance at $244 – which has now become strong support.
- Against Bitcoin, Ethereum remains within a wide symmetrical triangle as it attempts to break the upper boundary again.
Key Support & Resistance Levels
ETH/USD:
Support: $250, $245, $255.
Resistance:$265, £274, $280.
ETH/BTC:
Support: 0.0243 BTC, 0.0239 BTC, 0.0235 BTC.
Resistance: 0.025 BTC, 0.0255 BTC, 0.0259 BTC.
ETH/USD: Ethereum Finally Reclaims $250
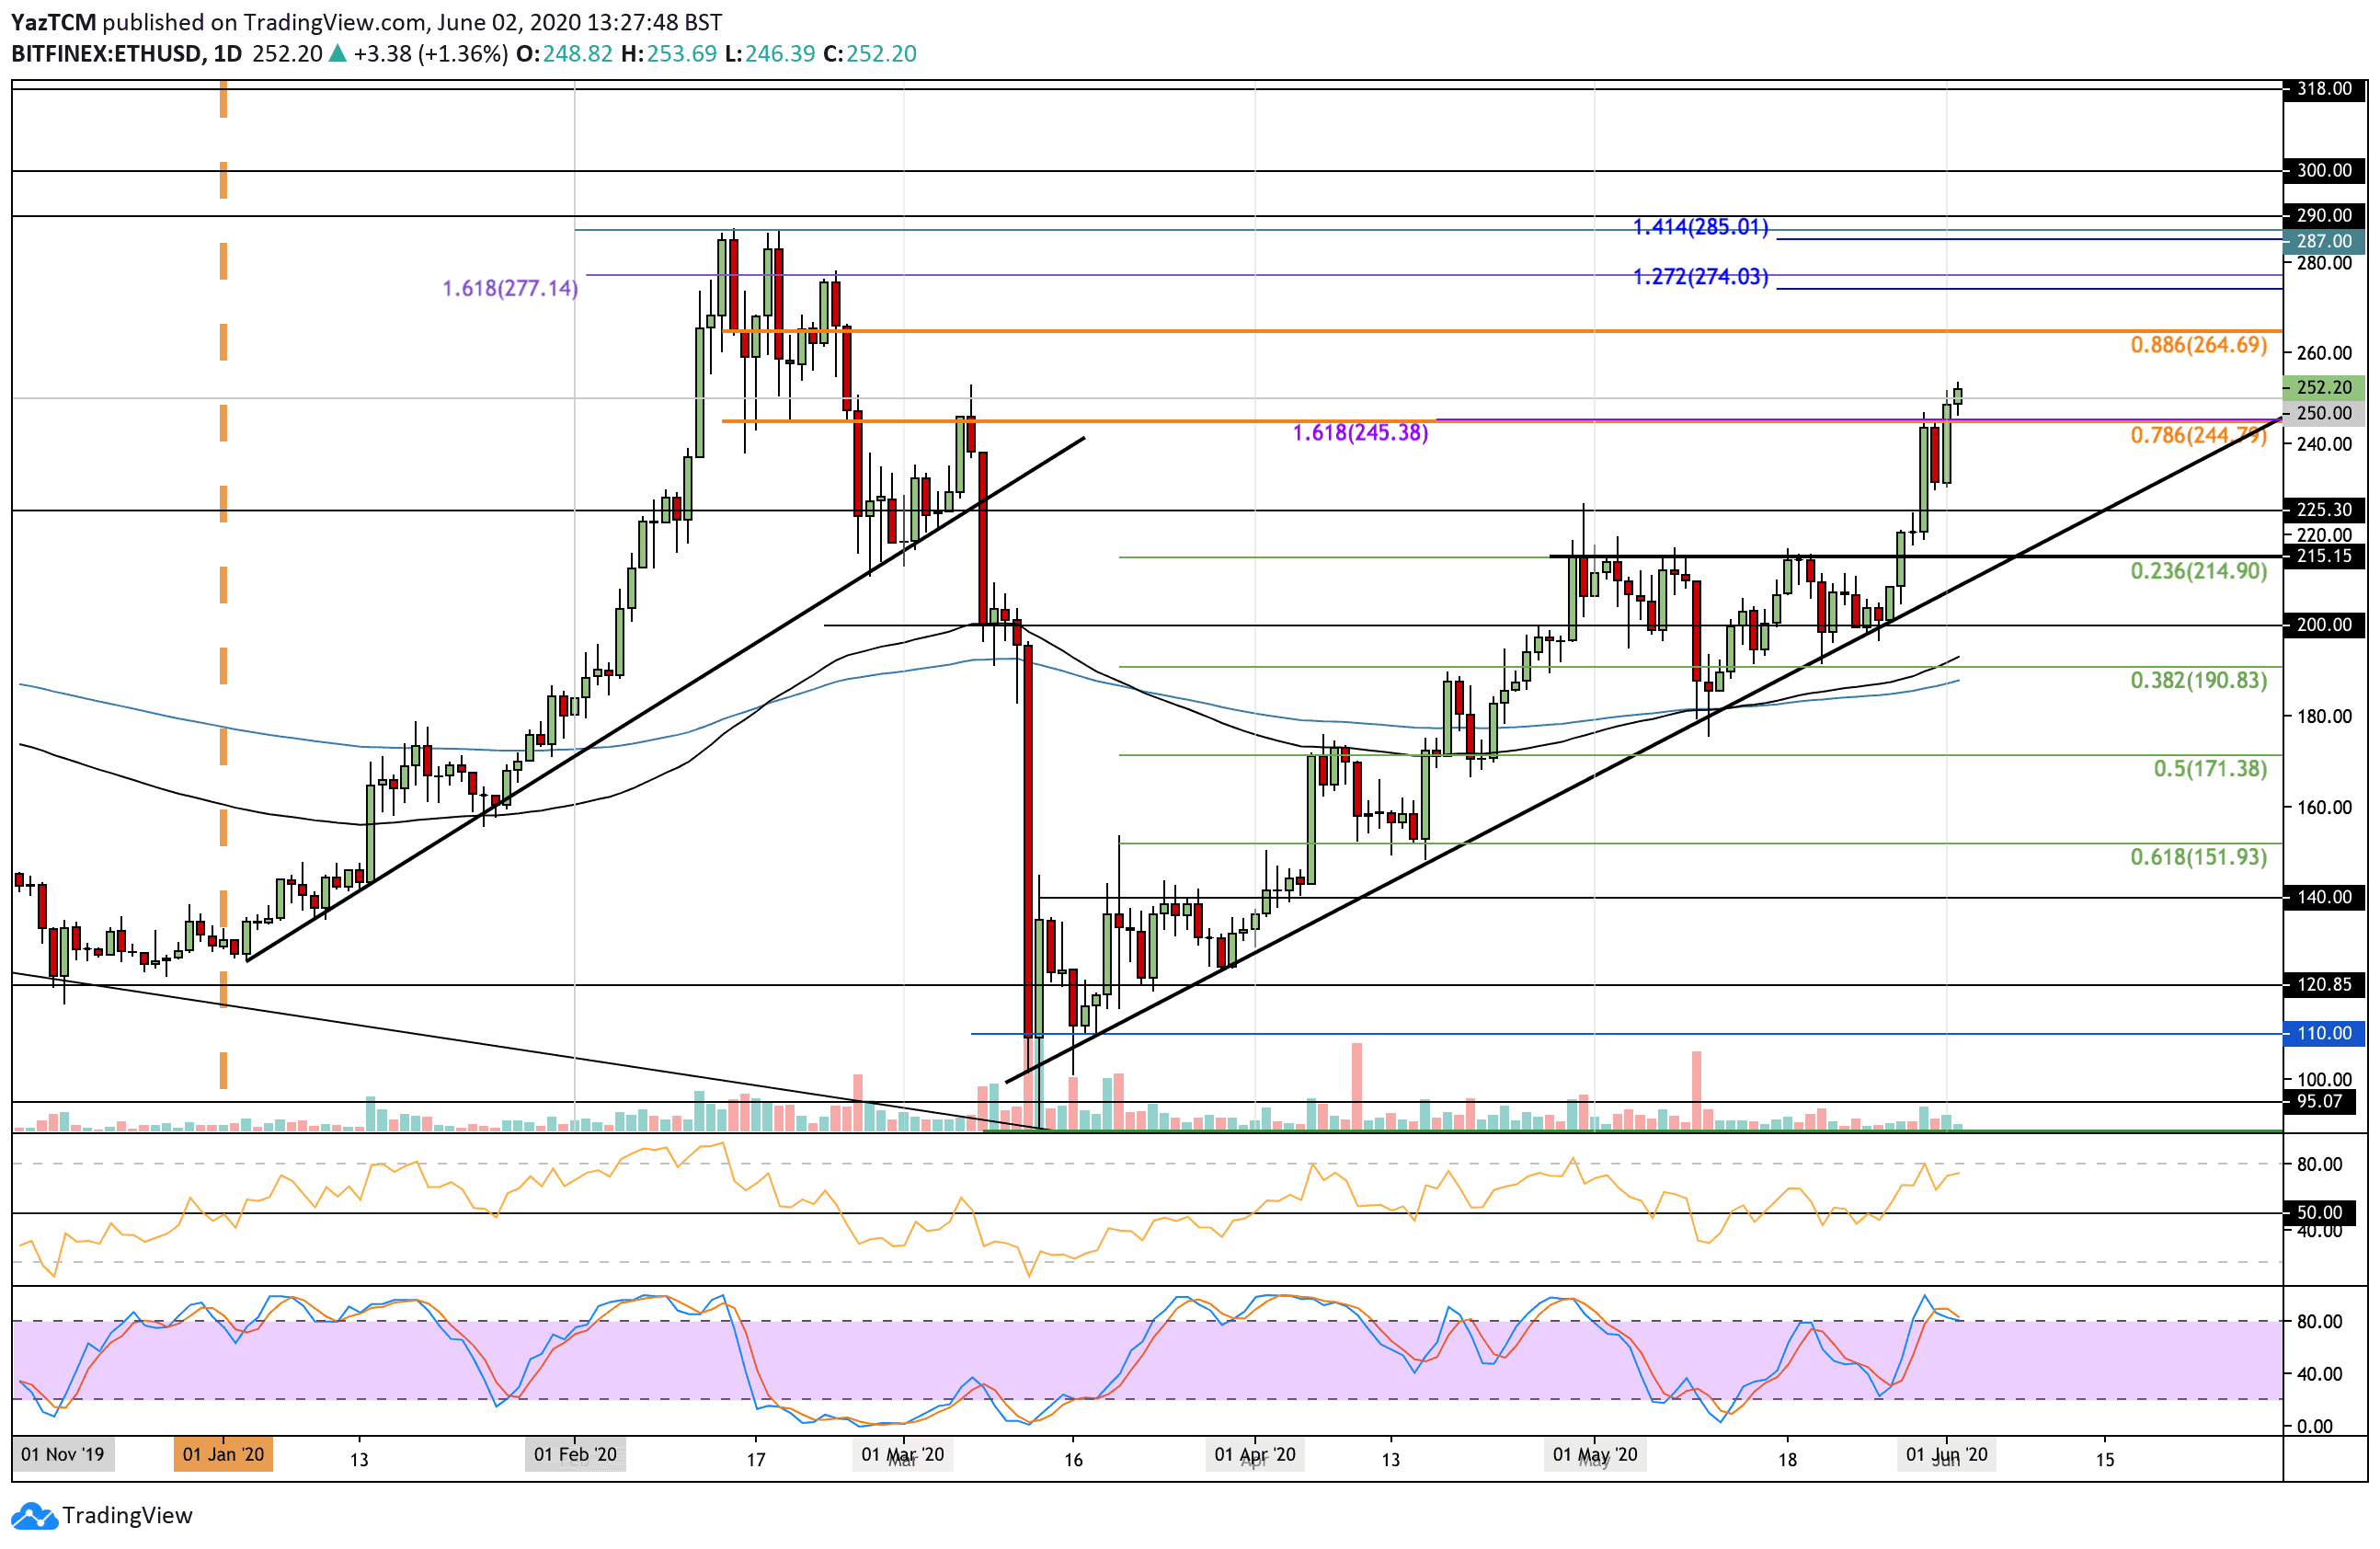
The 6% surge over the last 24 hours of trading allowed Ethereum to break above the $250 level for the first time since early March 2020. Over the weekend, the coin was struggling at the $245 level, where it battled the resistance at the bearish .786 Fib Retracement.
Yesterday, the ETH bulls managed to penetrate above this level of resistance as they pushed higher to break $250. This was primarily a result of BTC pushing higher above $10,000, but it was also helped by the fact that ETH/BTC rebounded from 0.0243 BTC.
ETH-USD Short Term Price Prediction
Looking ahead, if the bulls continue to drive ETH higher, the first level of resistance is located at $265 (bearish .886 Fibonacci Retracement level). Above this, resistance lies at $274, $280, $285, and $287 (2020 highs).
On the other side, if the sellers push lower, the first level of support lies at $250. Beneath this, support is found at $245, $225, and the rising trend line at around $215.
The RSI is well within the bullish territory as the buyers control the market momentum. However, the Stochastic RSI is overbought, and a bearish crossover signal could send the market lower.
ETH/BTC: ETH Battling With Upper Boundary Of Symmetrical Triangle
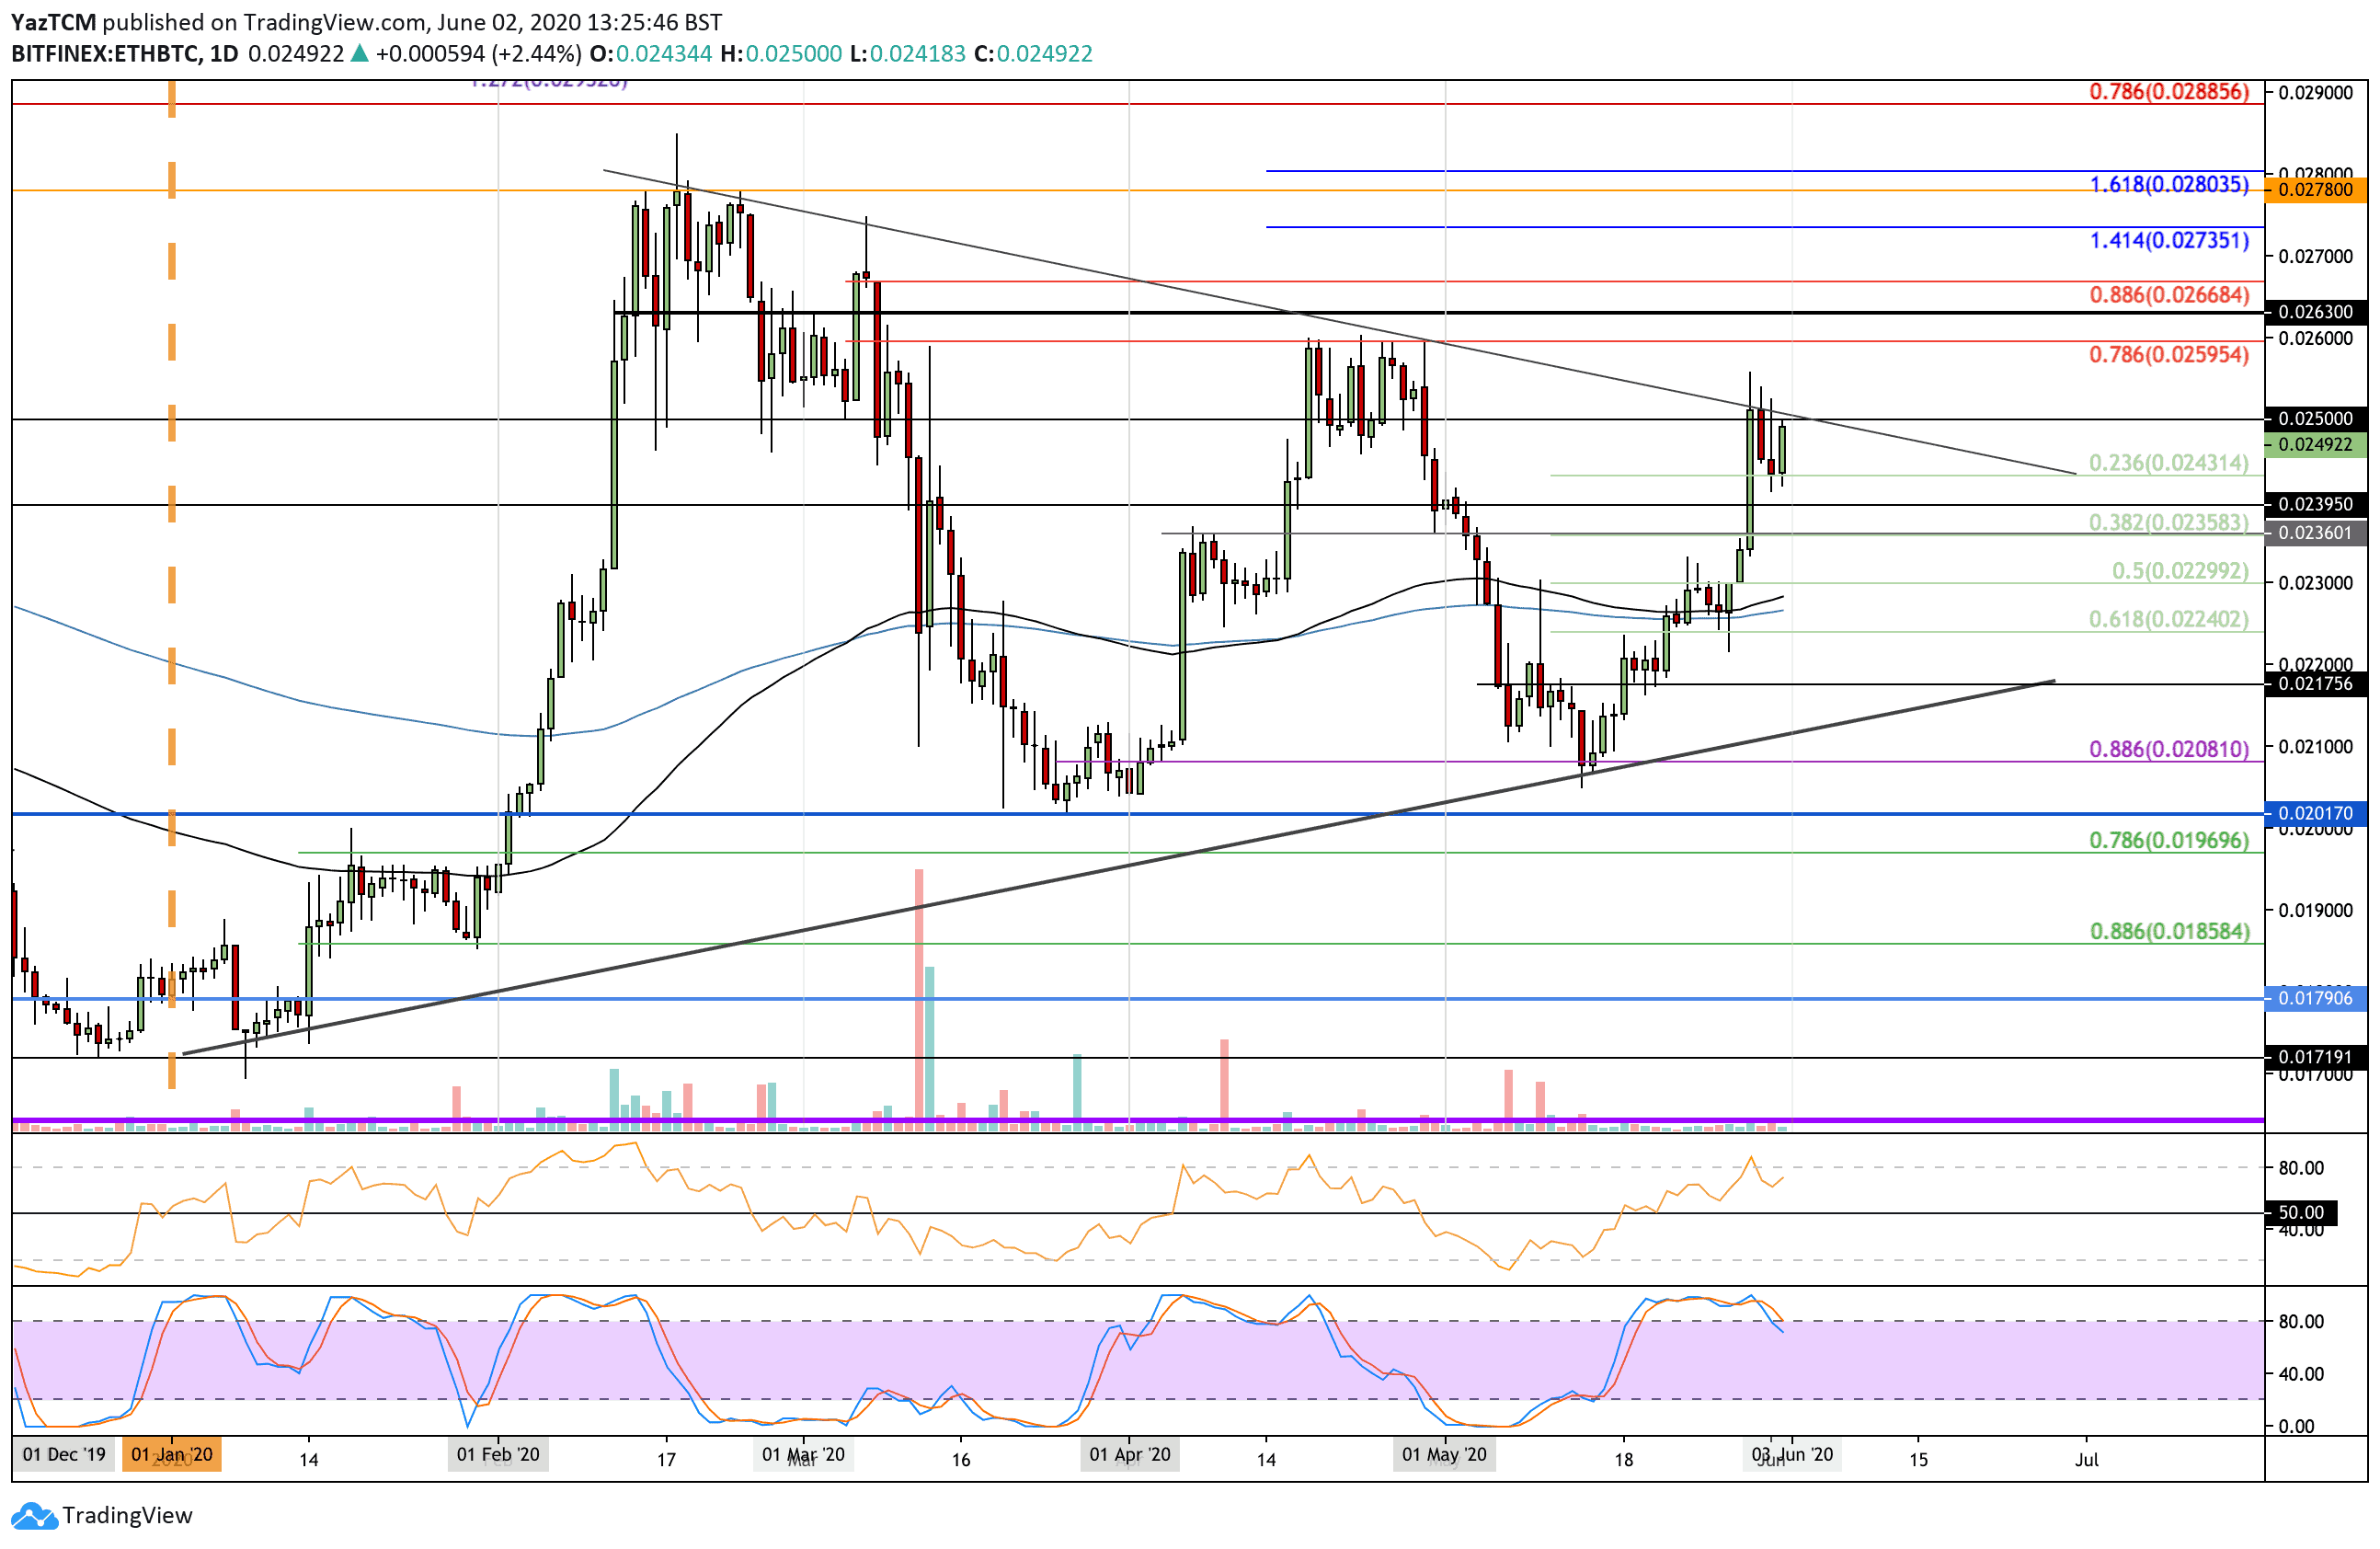
Against Bitcoin, Ethereum has been trapped within an extensive symmetrical triangle formation for the entire period of 2020. During May, Ethereum rebounded from the lower boundary of the triangle as the buyers started to drive it higher. The bulls managed to reach the upper edge by the end of May 2020.
It dropped slightly over the weekend into the support at 0.0243 BTC (.236 Fib Retracement), and it managed to rebound from there yesterday as it pushed higher and attempt to go beyond the triangle once again.
ETH-BTC Short Term Price Prediction
If the buyers can break the upper boundary at 0.025 BTC, the first level of higher resistance lies at 0.0255 BTC. Above this, resistance is located at 0.0259 BTC (bearish .786 Fib Retracement and April 2020 high), 0.0263 BTC, and 0.0266 BTC (bearish .886 Fib Retracement).
On the other side, the first level of support is located at 0.0243 BTC (.236 Fib Retracement). Beneath this, support lies at 0.0239 BTC, 0.0235 BTC (.382 Fib Retracement), and 0.023 BTC.
The RSI is also well within the bullish territory as the buyers dominate the market momentum.
The post ETH Finally Reclaims $250 In Wake of Bitcoin’s Latest Rally, What’s Next? Ethereum Price Analysis appeared first on CryptoPotato.


