ETH Facing Critical Resistance at $1.8K But Worrying Signs Emerge (Ethereum Price Analysis)
After experiencing a mid-term uptrend, Ethereum has now reached a significant resistance region of $1.7K-$2K. A successful breakout from this range may trigger a long-term bullish rally. However, there is also a possibility that the price may face rejection and fall below the 50-week moving average once again.
Technical Analysis
By Shayan
The Weekly Chart
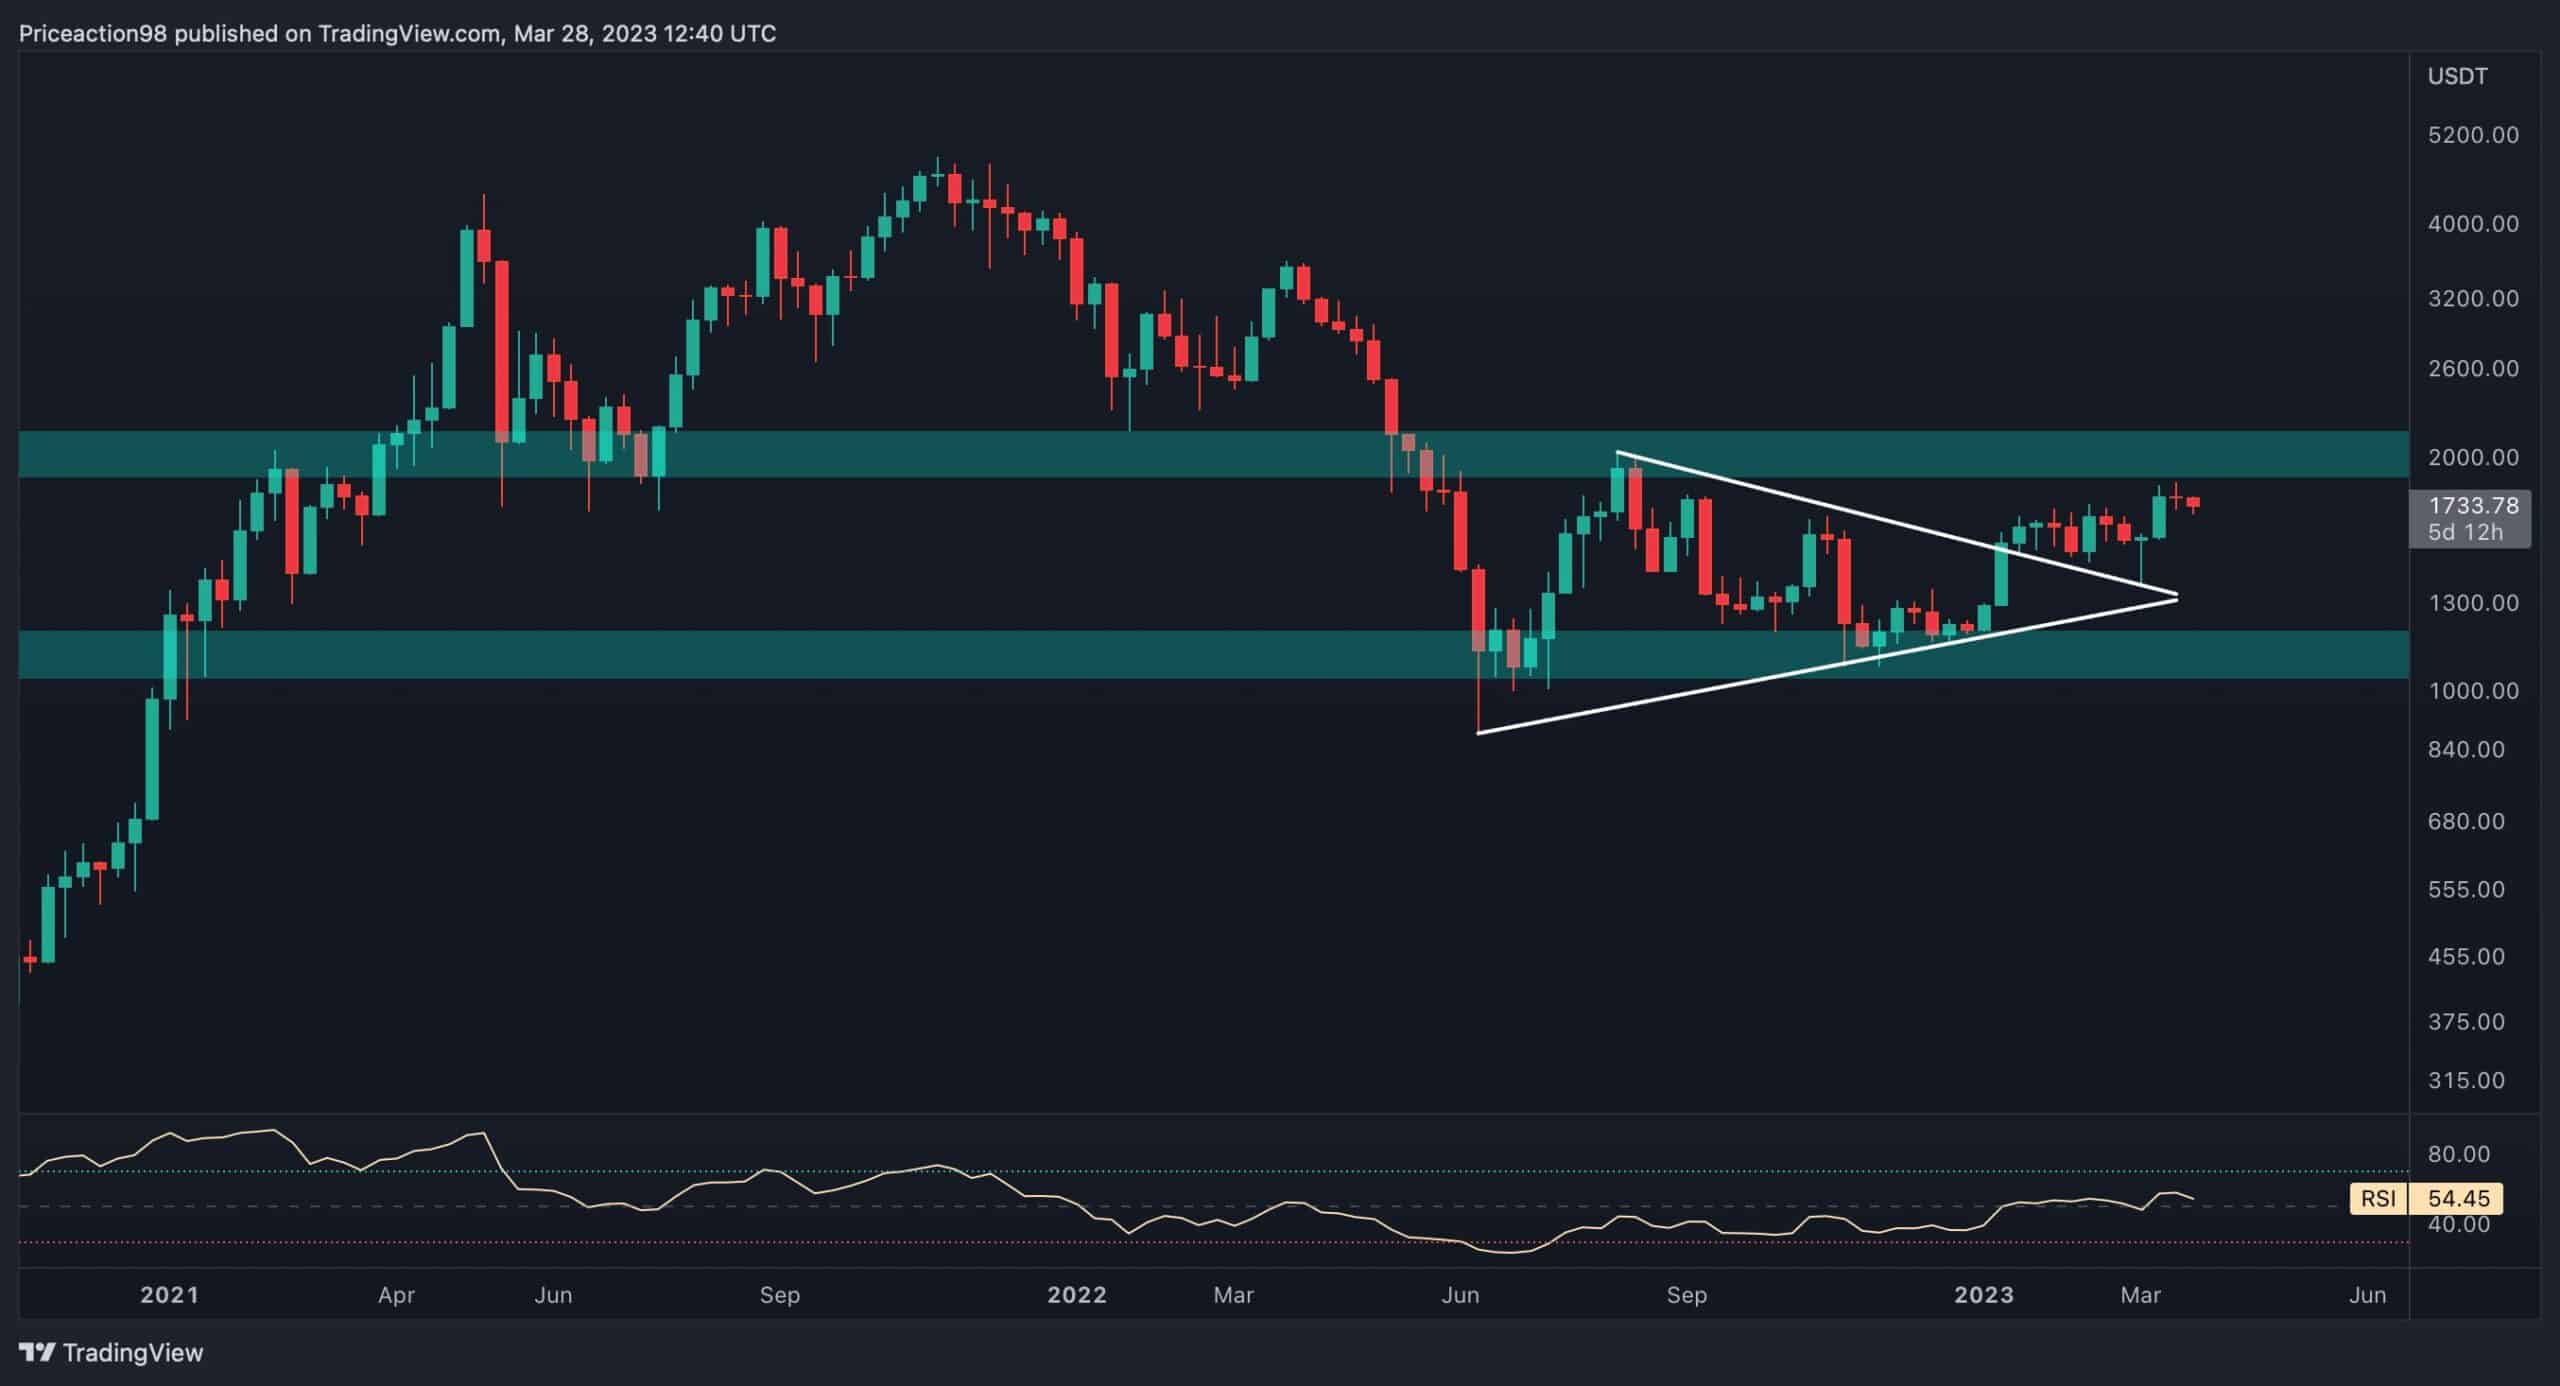
After being supported by the significant support level of $1K, Ethereum began an uptrend resulting in a breakout from the symmetrical triangle pattern. The price then formed a pullback to the triangle’s upper trendline before continuing to rise above the $1.6K mark and surpassing the 50-week moving average.
The 50-week moving average is a crucial level for the price to maintain, as it sets a general bias for the cryptocurrency in the long term. With ETH having reclaimed this crucial level, its outlook is currently bullish.
However, the price faces a significant resistance region at $2K. A successful breakout from this price range may trigger a long-term bullish rally.
The 4-Hour Chart
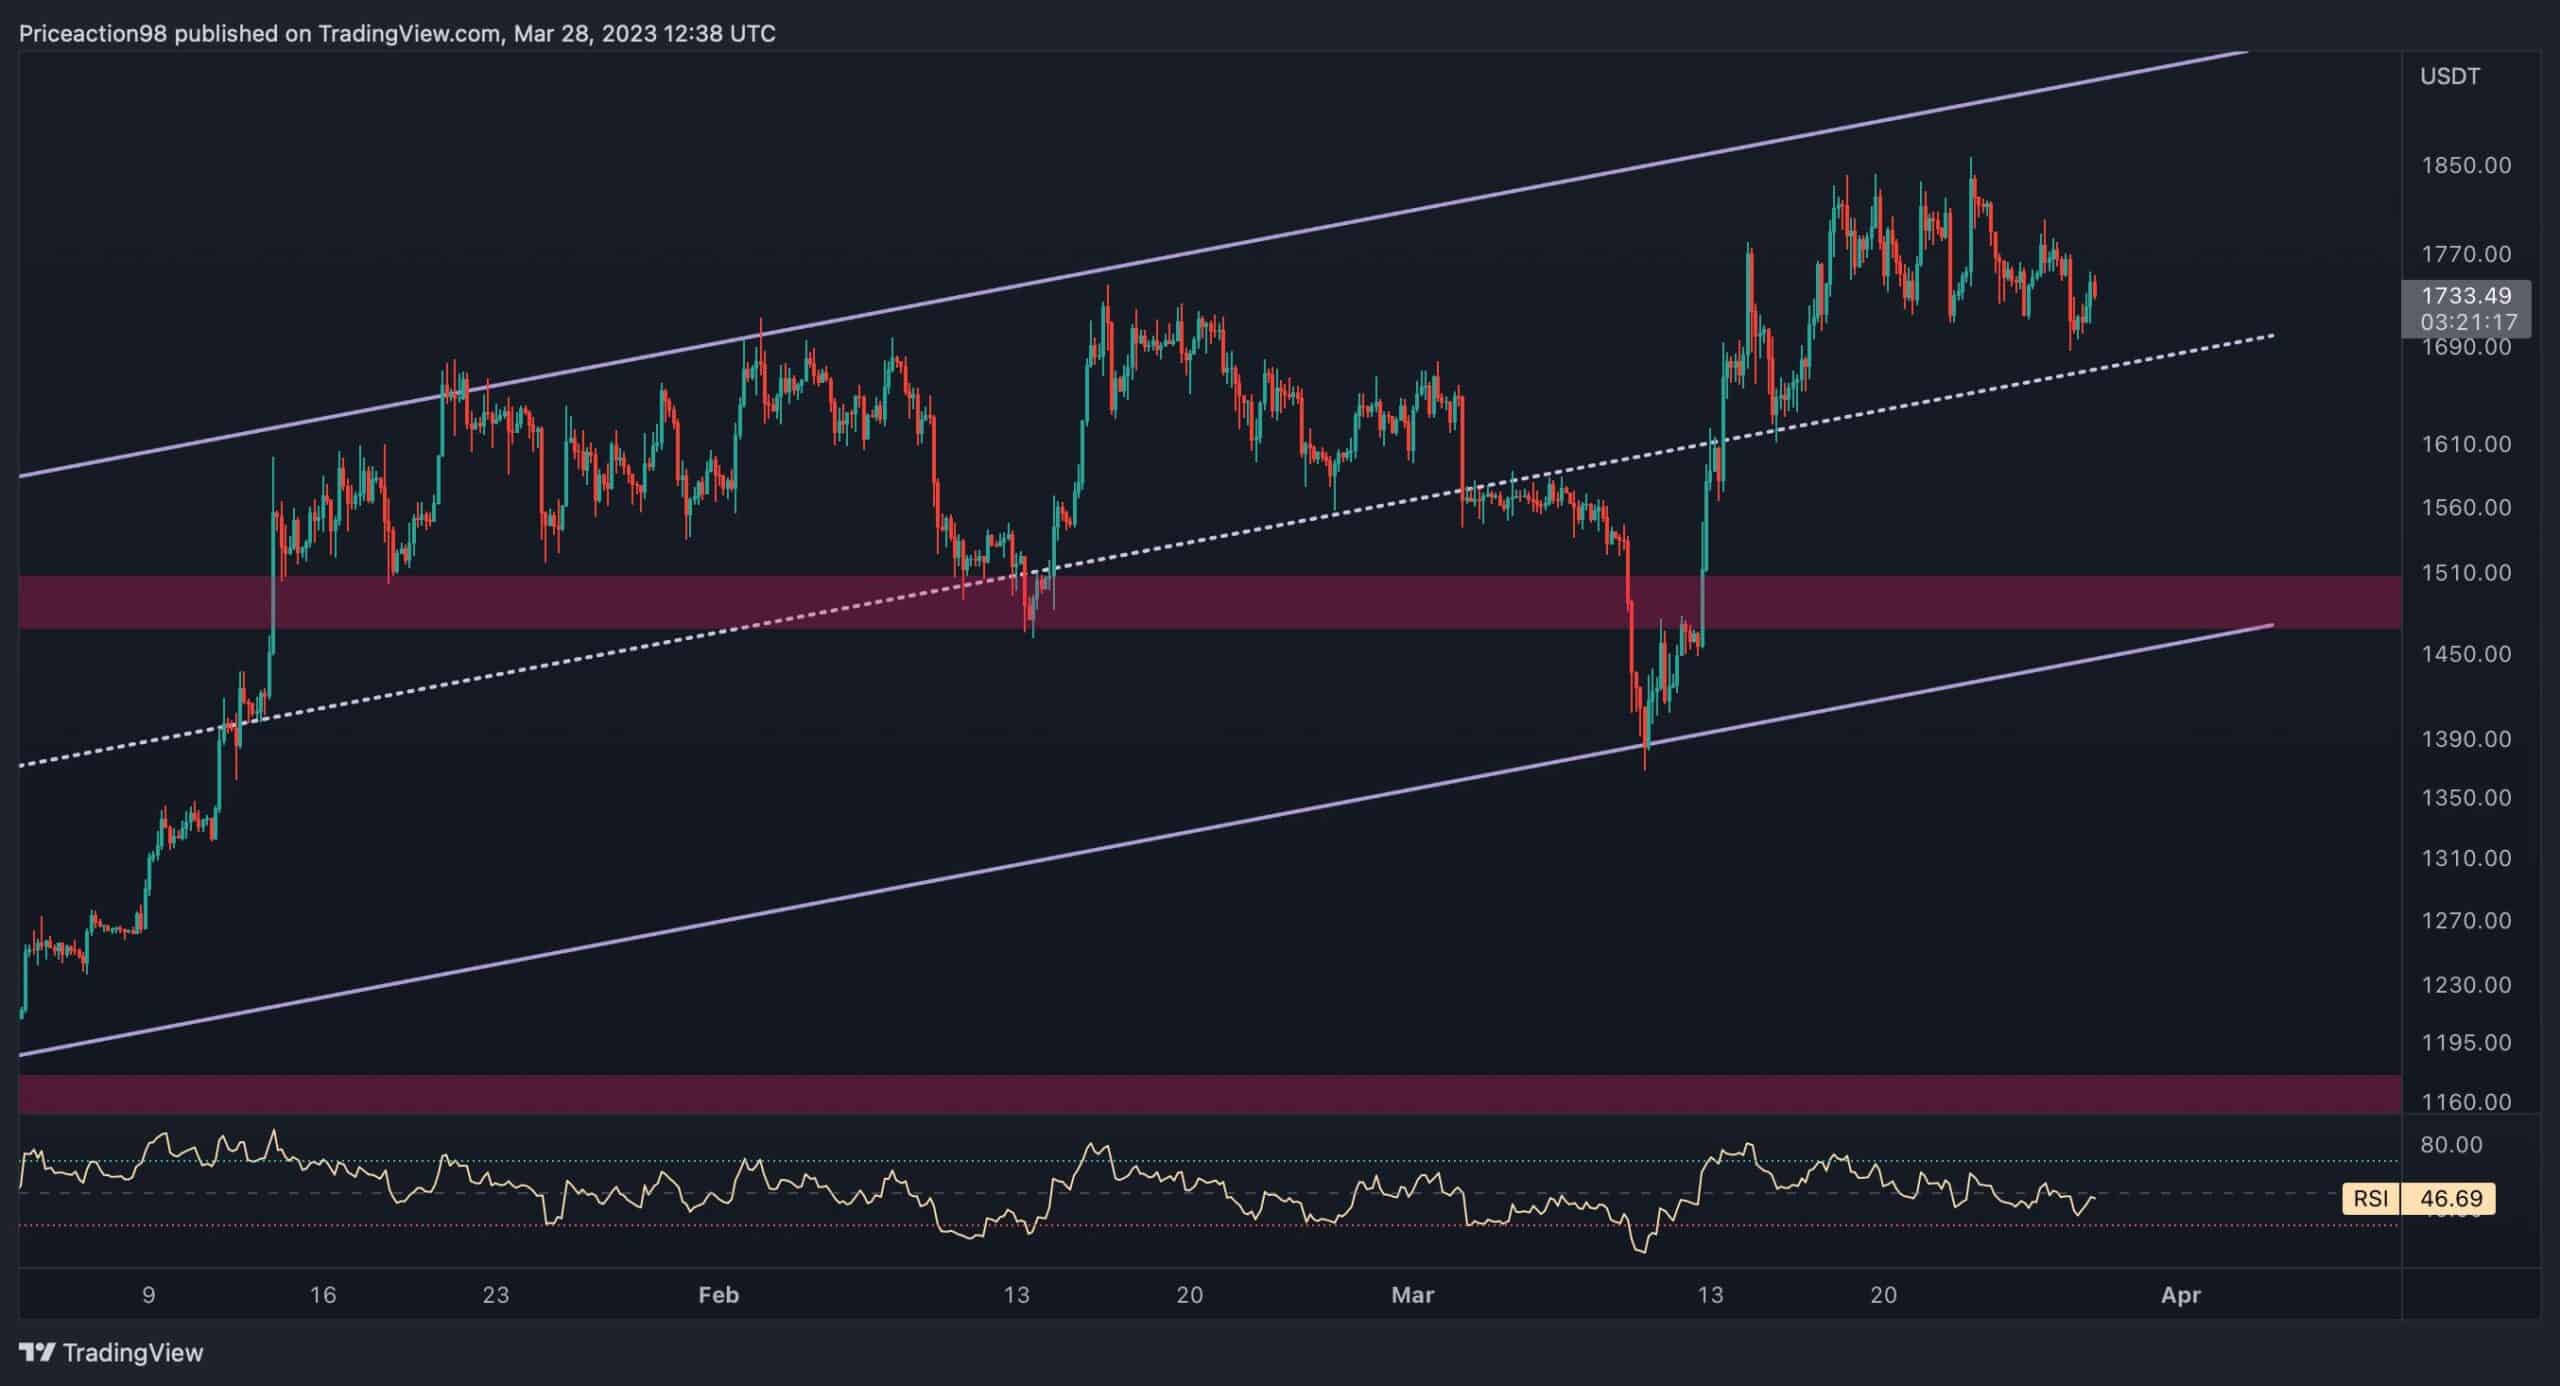
The recent price action of Ethereum does not provide any clear indication about its upcoming direction. Currently, the cryptocurrency is consolidating with no specific direction after finding support at the middle boundary of the ascending channel.
However, the price faces two critical levels of support and resistance: the channel’s middle-boundary at $1.7K acting as support, and the channel’s upper trendline at $1.9K acting as resistance.
If the price manages to surpass the channel’s upper trendline, the long-term outlook for ETH will be confirmed as bullish. However, if it experiences a sharp decline and falls below the mid-boundary, the next level of support for ETH will be the $1.5K mark.
On-chain Analysis
By Shayan
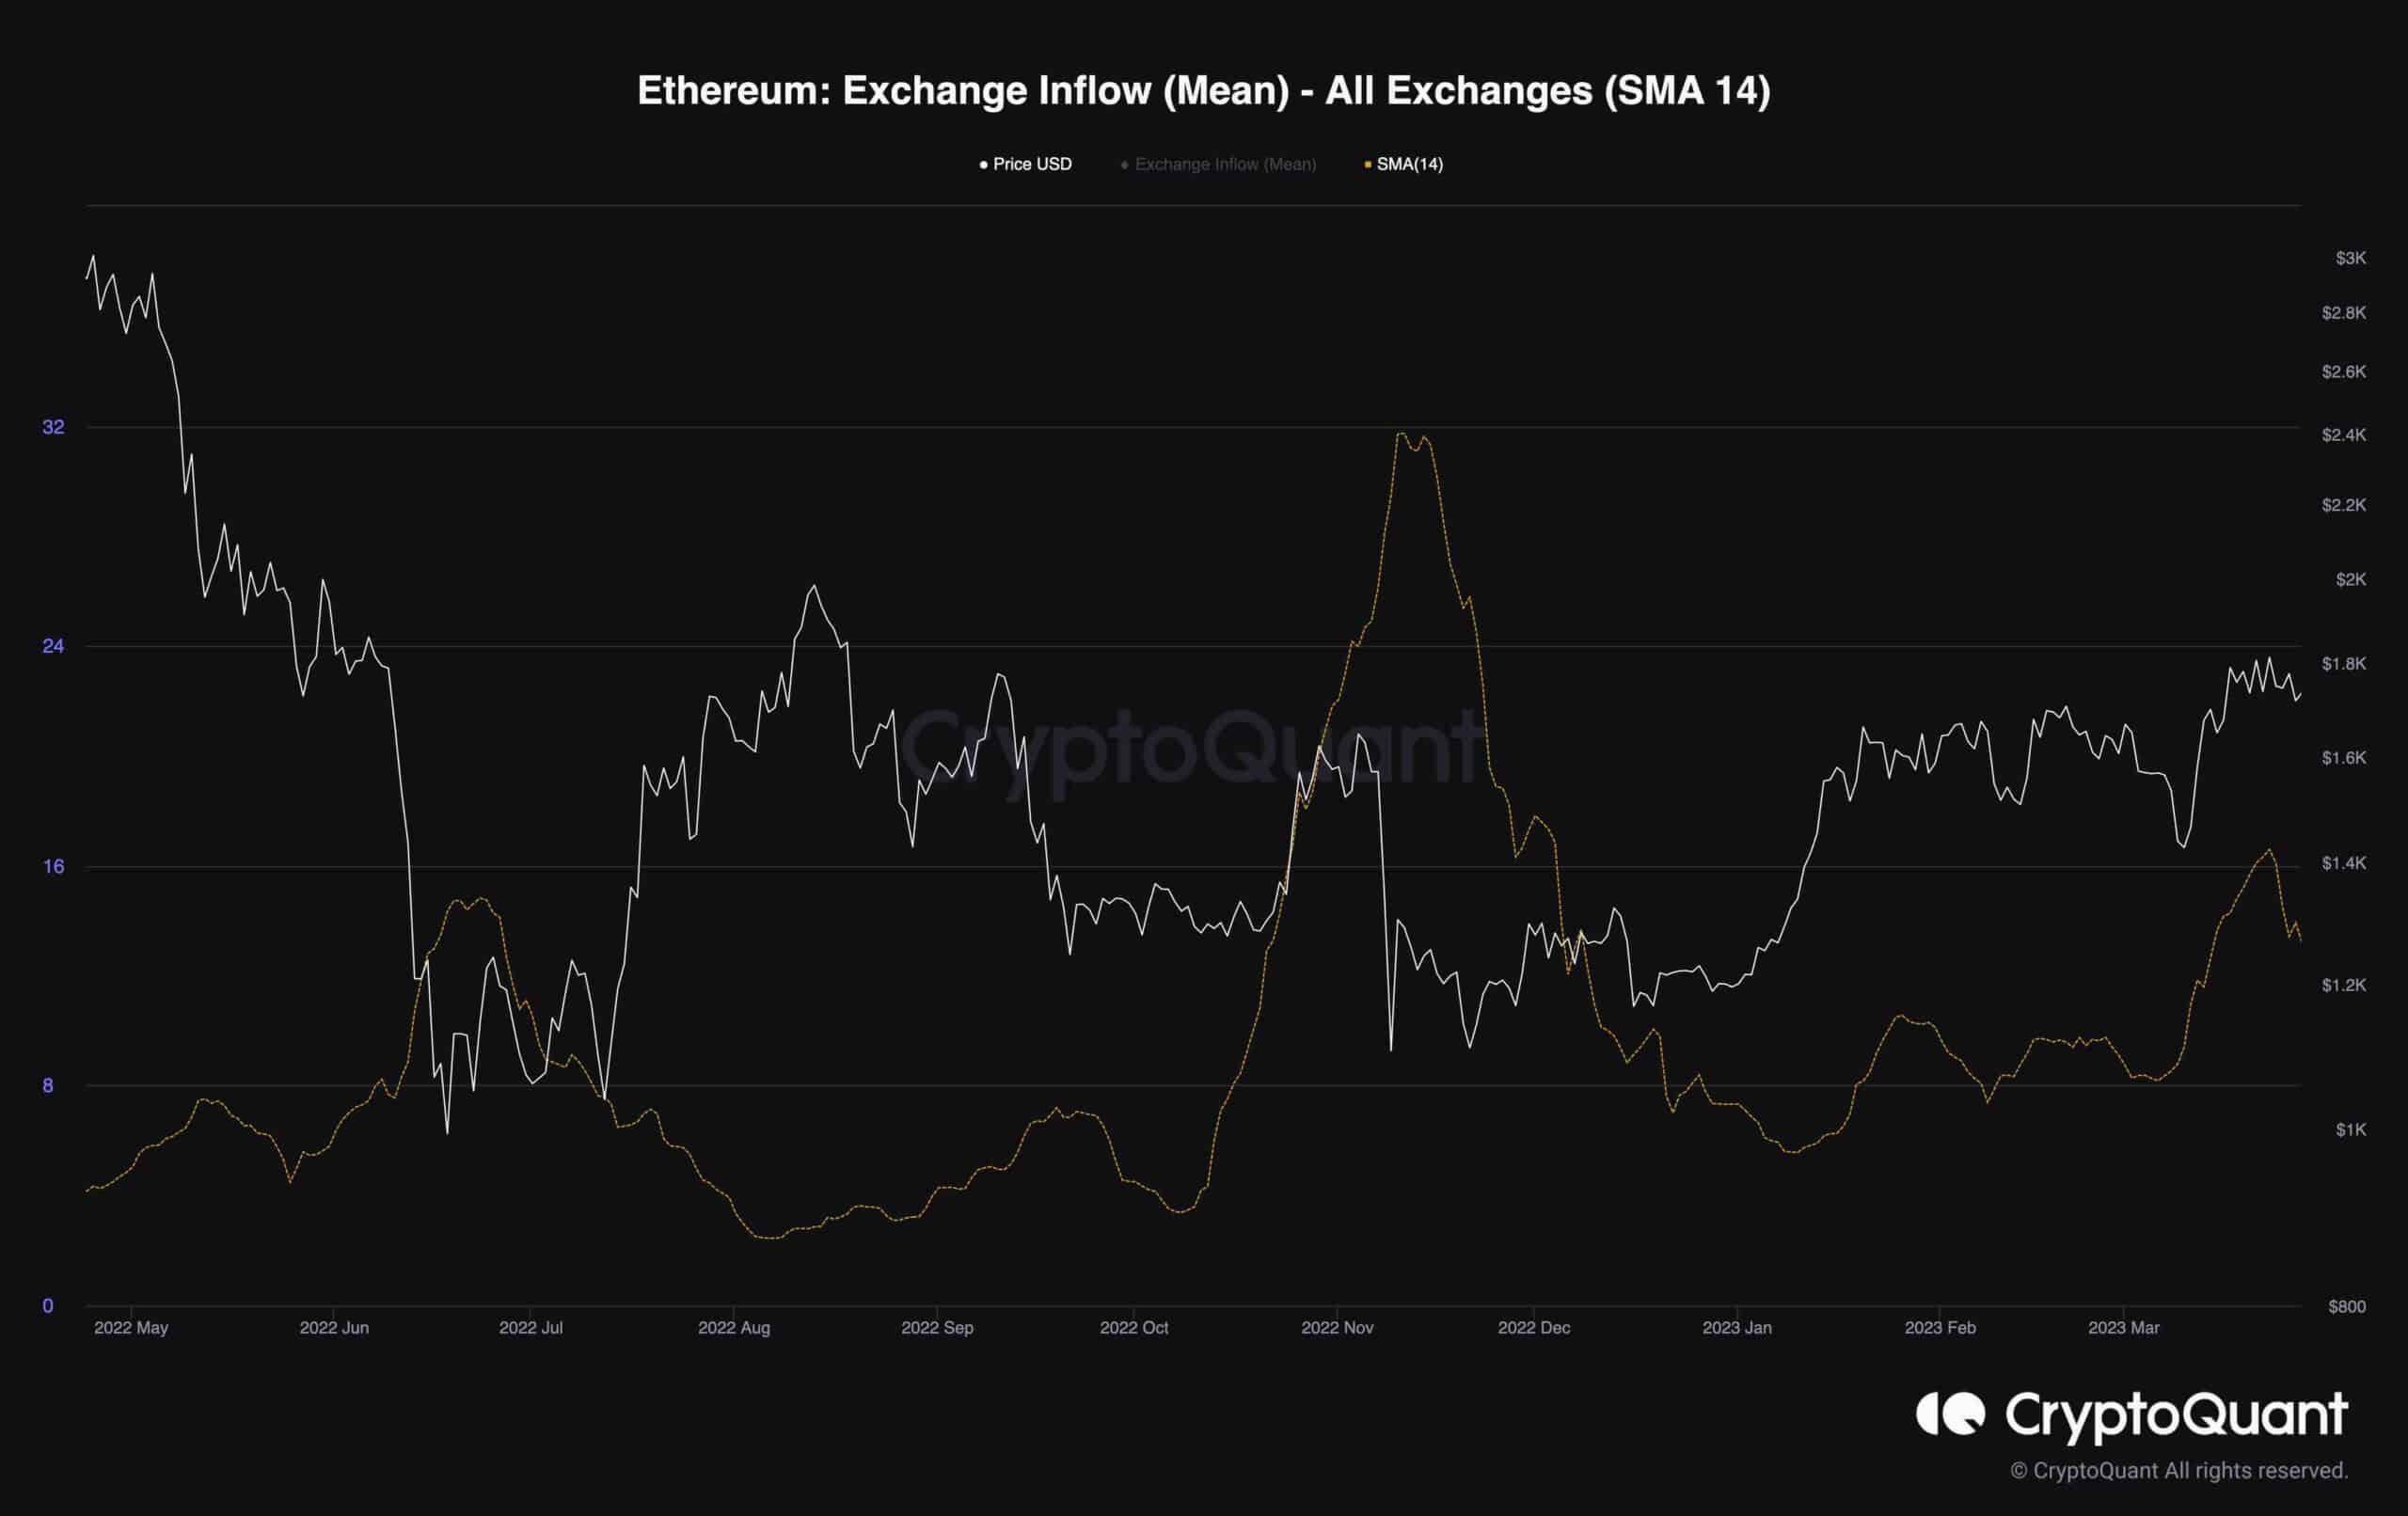
The chart shows the mean amount of coins per transaction (SMA-14) sent to exchanges alongside the price of Ethereum.
When the metric shows high values, it suggests that investors are sending a larger number of coins in each transaction, which could indicate increased selling pressure. This, in turn, could lead to a potential decline in the price of Ethereum in the future.
The metric has recently surged, which can be attributed to the upward trend in the price. This observation suggests that there may be an increase in selling pressure among participants, especially in this price range, in order to recoup their losses from the previous bear market by taking profits.
However, it is crucial to keep a close eye on the metric in the upcoming days in case of any sudden spikes to avoid further losses.
The post ETH Facing Critical Resistance at $1.8K But Worrying Signs Emerge (Ethereum Price Analysis) appeared first on CryptoPotato.


