ETH Crashes 6% Daily, is $1500 The Next Target? (Ethereum Price Analysis)
Ethereum’s price has experienced a decline in recent days after being unable to surpass the $2,000 level. However, it is currently testing an important support level, and its response to it is expected to have a significant impact on performance in the coming months.
Technical Analysis
By: Edris
The Daily Chart:
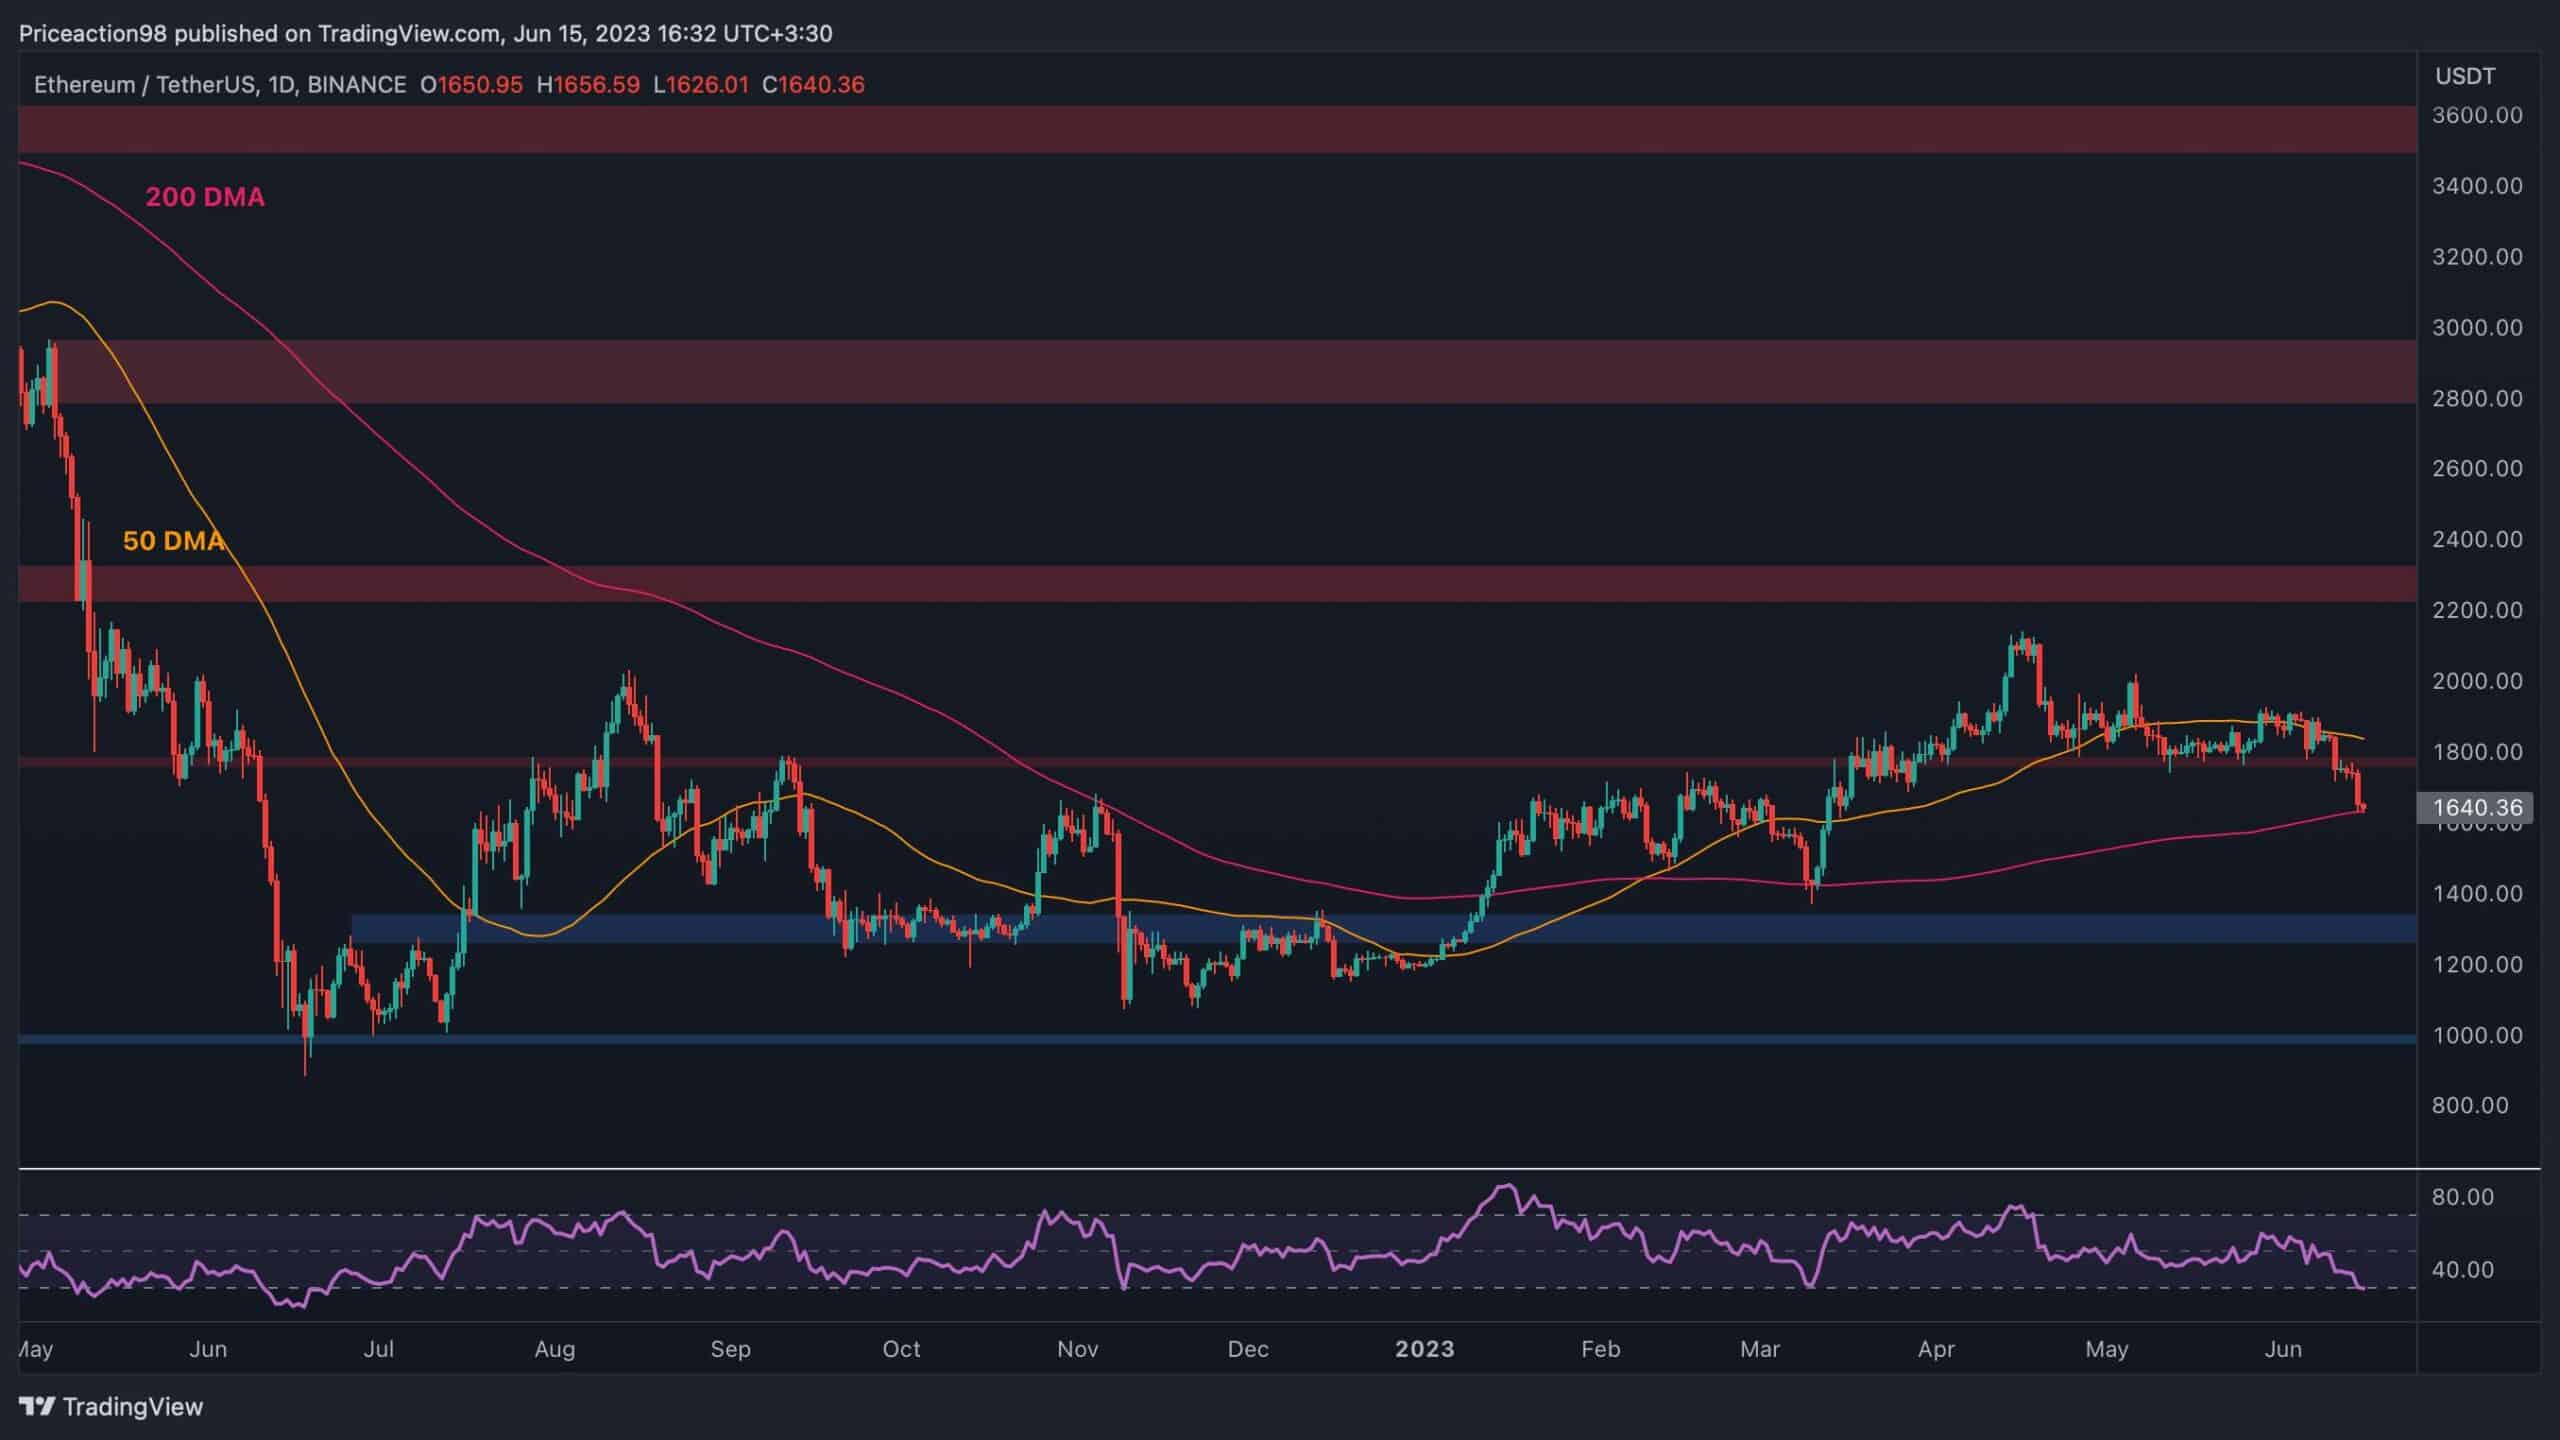
On the daily timeframe, Ethereum’s price has faced rejection from the 50-day moving average at approximately $1,850 and has subsequently declined below $1,800. The price is currently experiencing downward momentum, but it is finding support near the 200-day moving average around $1,600.
The 200-day moving average is a strong indicator of the overall trend, and if ETH falls below it, it would indicate a continuation of the bearish market sentiment, potentially leading to a drop toward the $1,300 level.
However, if the price bounces back from the mentioned moving average and successfully breaks above both the $1,800 level and the 50-day moving average, there is a high likelihood of Ethereum rallying towards the resistance level at $2,300 and potentially even higher.
The 4-Hour Chart:
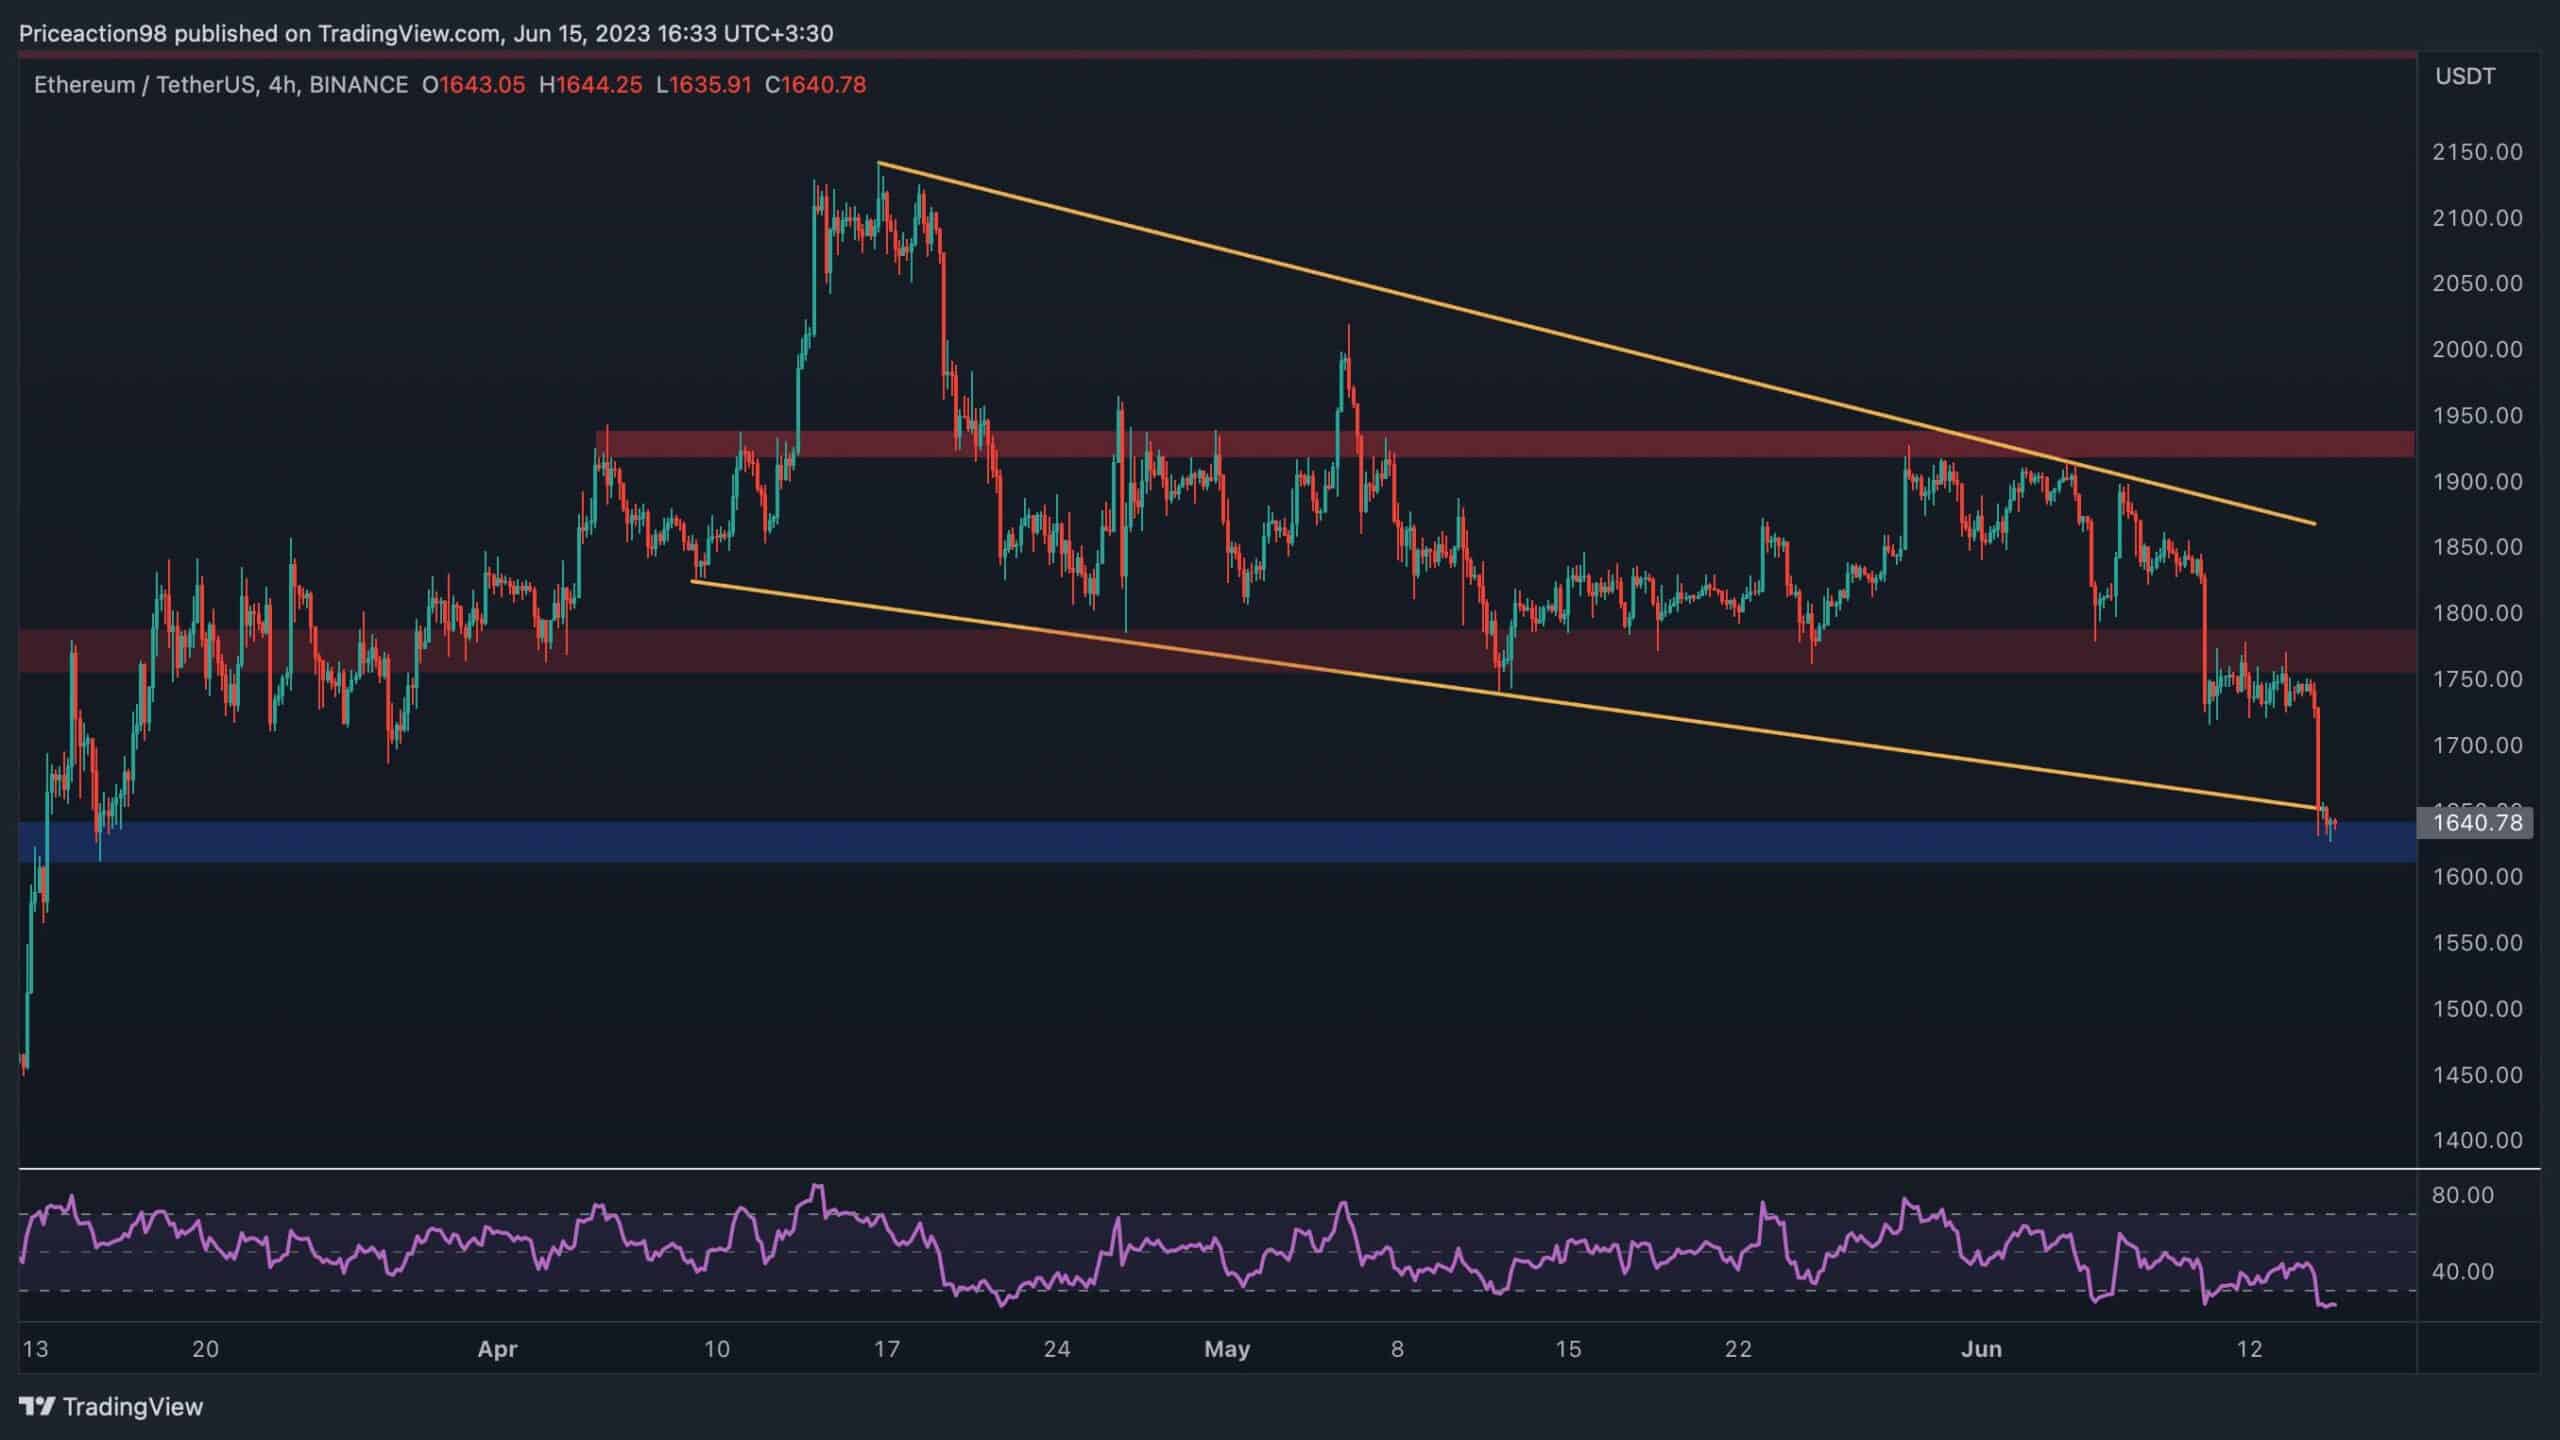
On the 4-hour chart, Ethereum’s price has experienced a rapid decline in recent days after being rejected from the $1,900 level and the upper boundary of the large falling wedge pattern.
It is currently testing the lower trend line of the pattern, which is situated around the $1,600 support level. A breakdown below it would have severe consequences for the price.
However, the RSI indicator is suggesting that the market is oversold, which suggests the possibility of a potential pullback, consolidation, or even a bullish reversal from the current area. Yet, the outcome will depend on whether the price is able to hold at the current level or if it breaks down further.
Sentiment Analysis
By: Edris
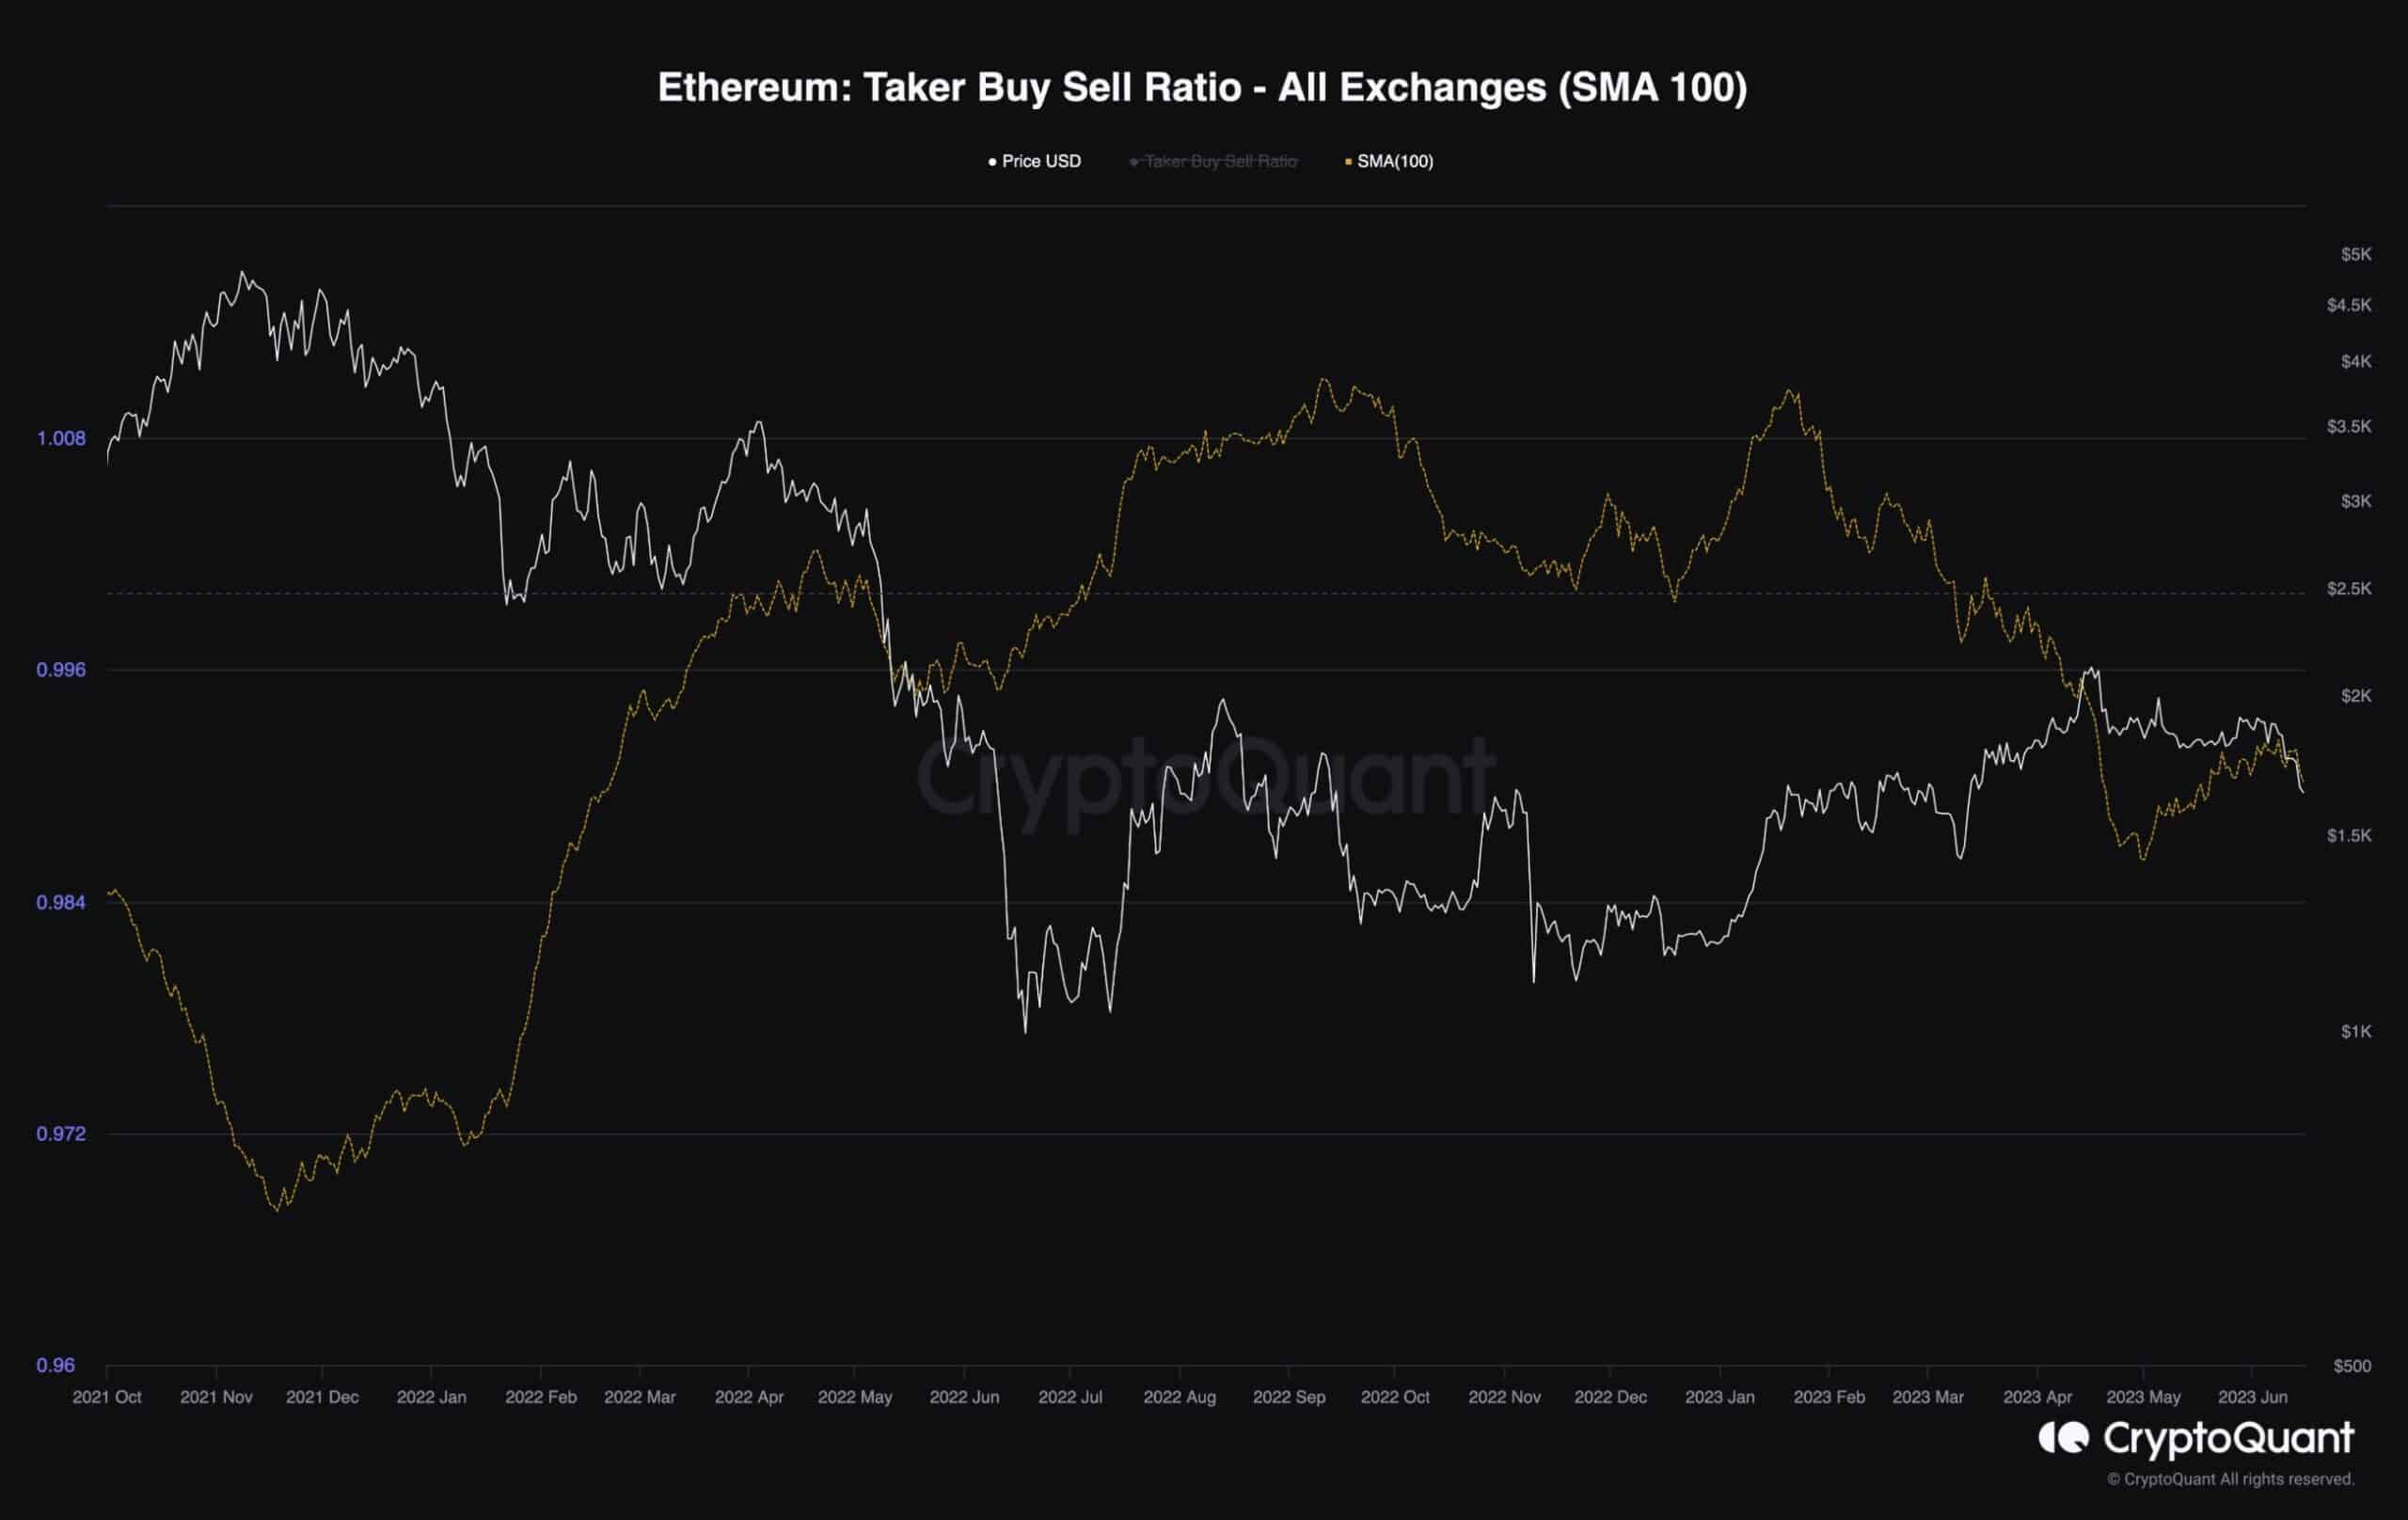
Ethereum Taker Buy Sell Ratio
Ethereum’s price has experienced a bearish trend after failing to surpass the $2,000 level. To gain insights into the reasons behind this behavior, analyzing the sentiment in the futures market can be informative.
The taker buy-sell ratio metric, depicted in the chart with a 100-day moving average applied, examines whether buyers or sellers are executing their perpetual futures orders more aggressively, meaning entering at the market price instead of setting limit orders.
It is apparent that when the price approached $2,000, the metric dropped below 1, indicating that short sellers started dominating the market and actively shorting Ethereum. This contributed to the downward pressure on the price. Although the ratio has shown a slight recovery recently, as long as it remains below 1, there is still potential for further downward price movement.
The post ETH Crashes 6% Daily, is $1500 The Next Target? (Ethereum Price Analysis) appeared first on CryptoPotato.