ETH Bears Take Control as $1.8K Support Seemingly Next to Test (Ethereum Price Analysis)
Ethereum’s price has been undergoing a period of consolidation, characterized by fluctuations that have yet to provide a clear directional bias for market participants. Despite this, the cryptocurrency faces two critical support levels, the 100 and 200-day moving averages.
Technical Analysis
By Shayan
The Daily Chart
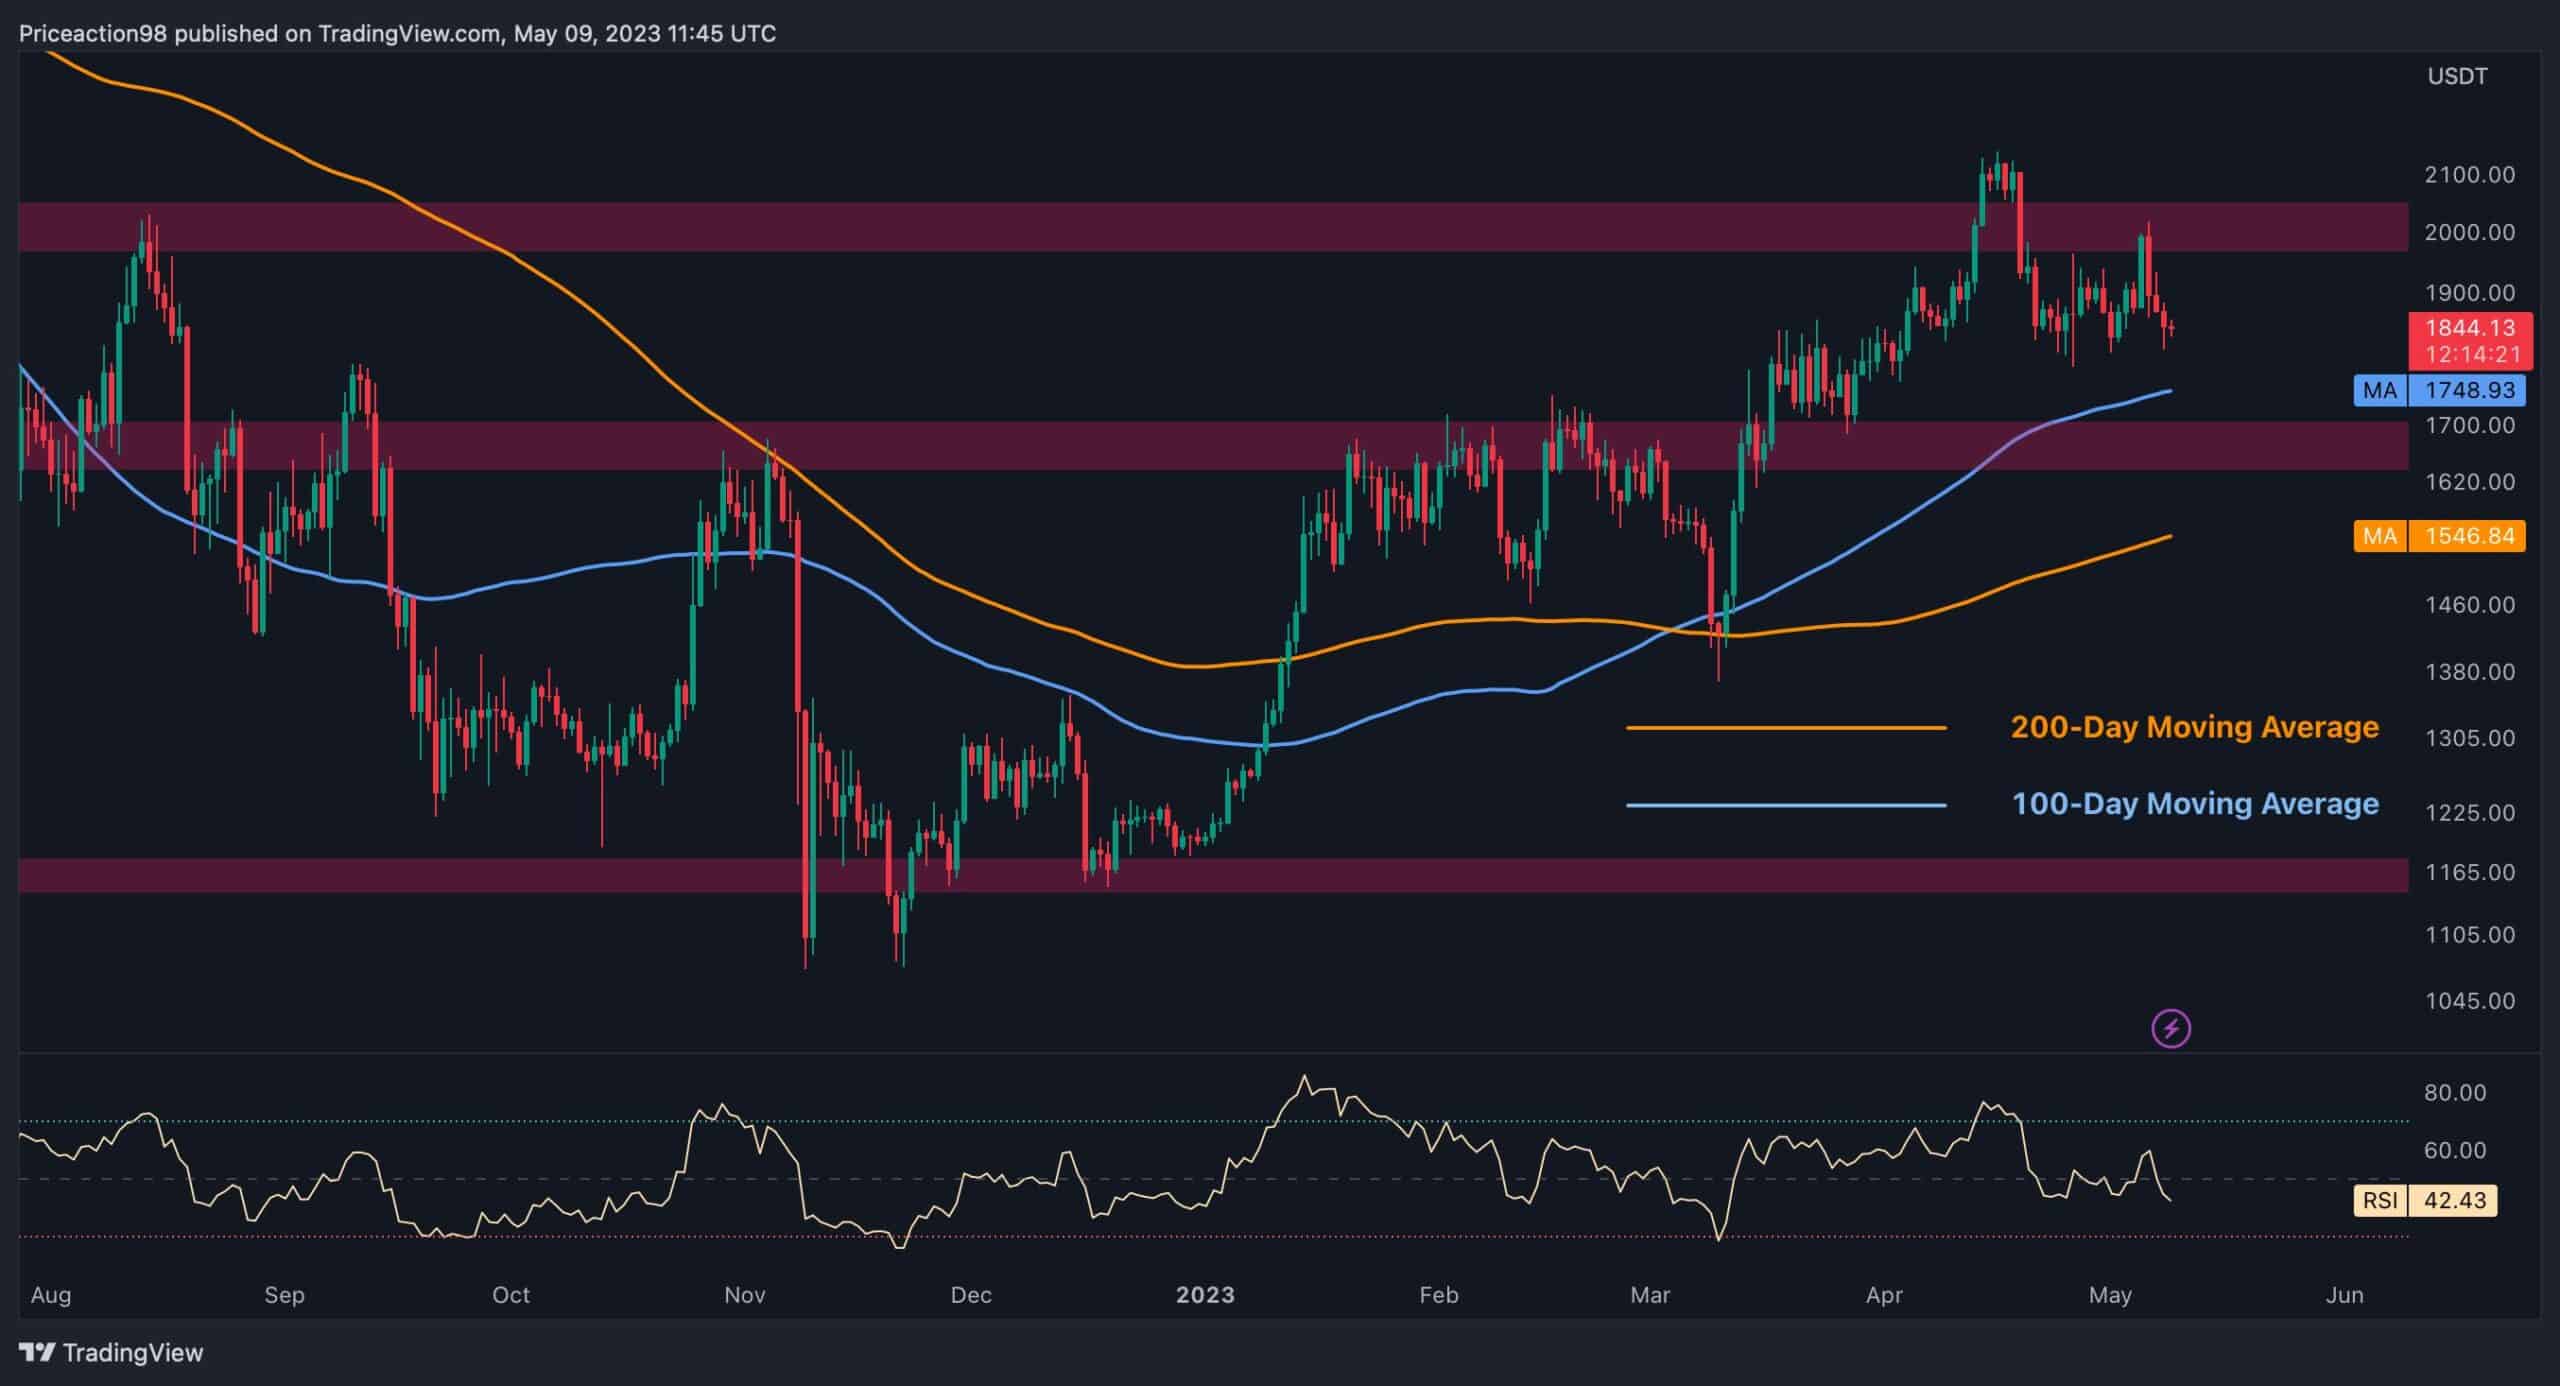
After failing to exceed the $2.1K level and experiencing an impulsive bearish leg, the price reached $1.8K and entered a consolidation phase. However, during this stage, ETH has not shown a clear direction yet and has printed candles that move up and down.
Nevertheless, the price currently faces three crucial levels: the 100-day moving average at $1748, the 200-day moving average at $1546 as primary supports, and the $2.1K price zone as major resistance. Given the bullish sentiment in the market, in the event of another cascade, the 100 and 200-day moving averages are likely to buoy the price, spurring another upward movement.
The 4-Hour Chart
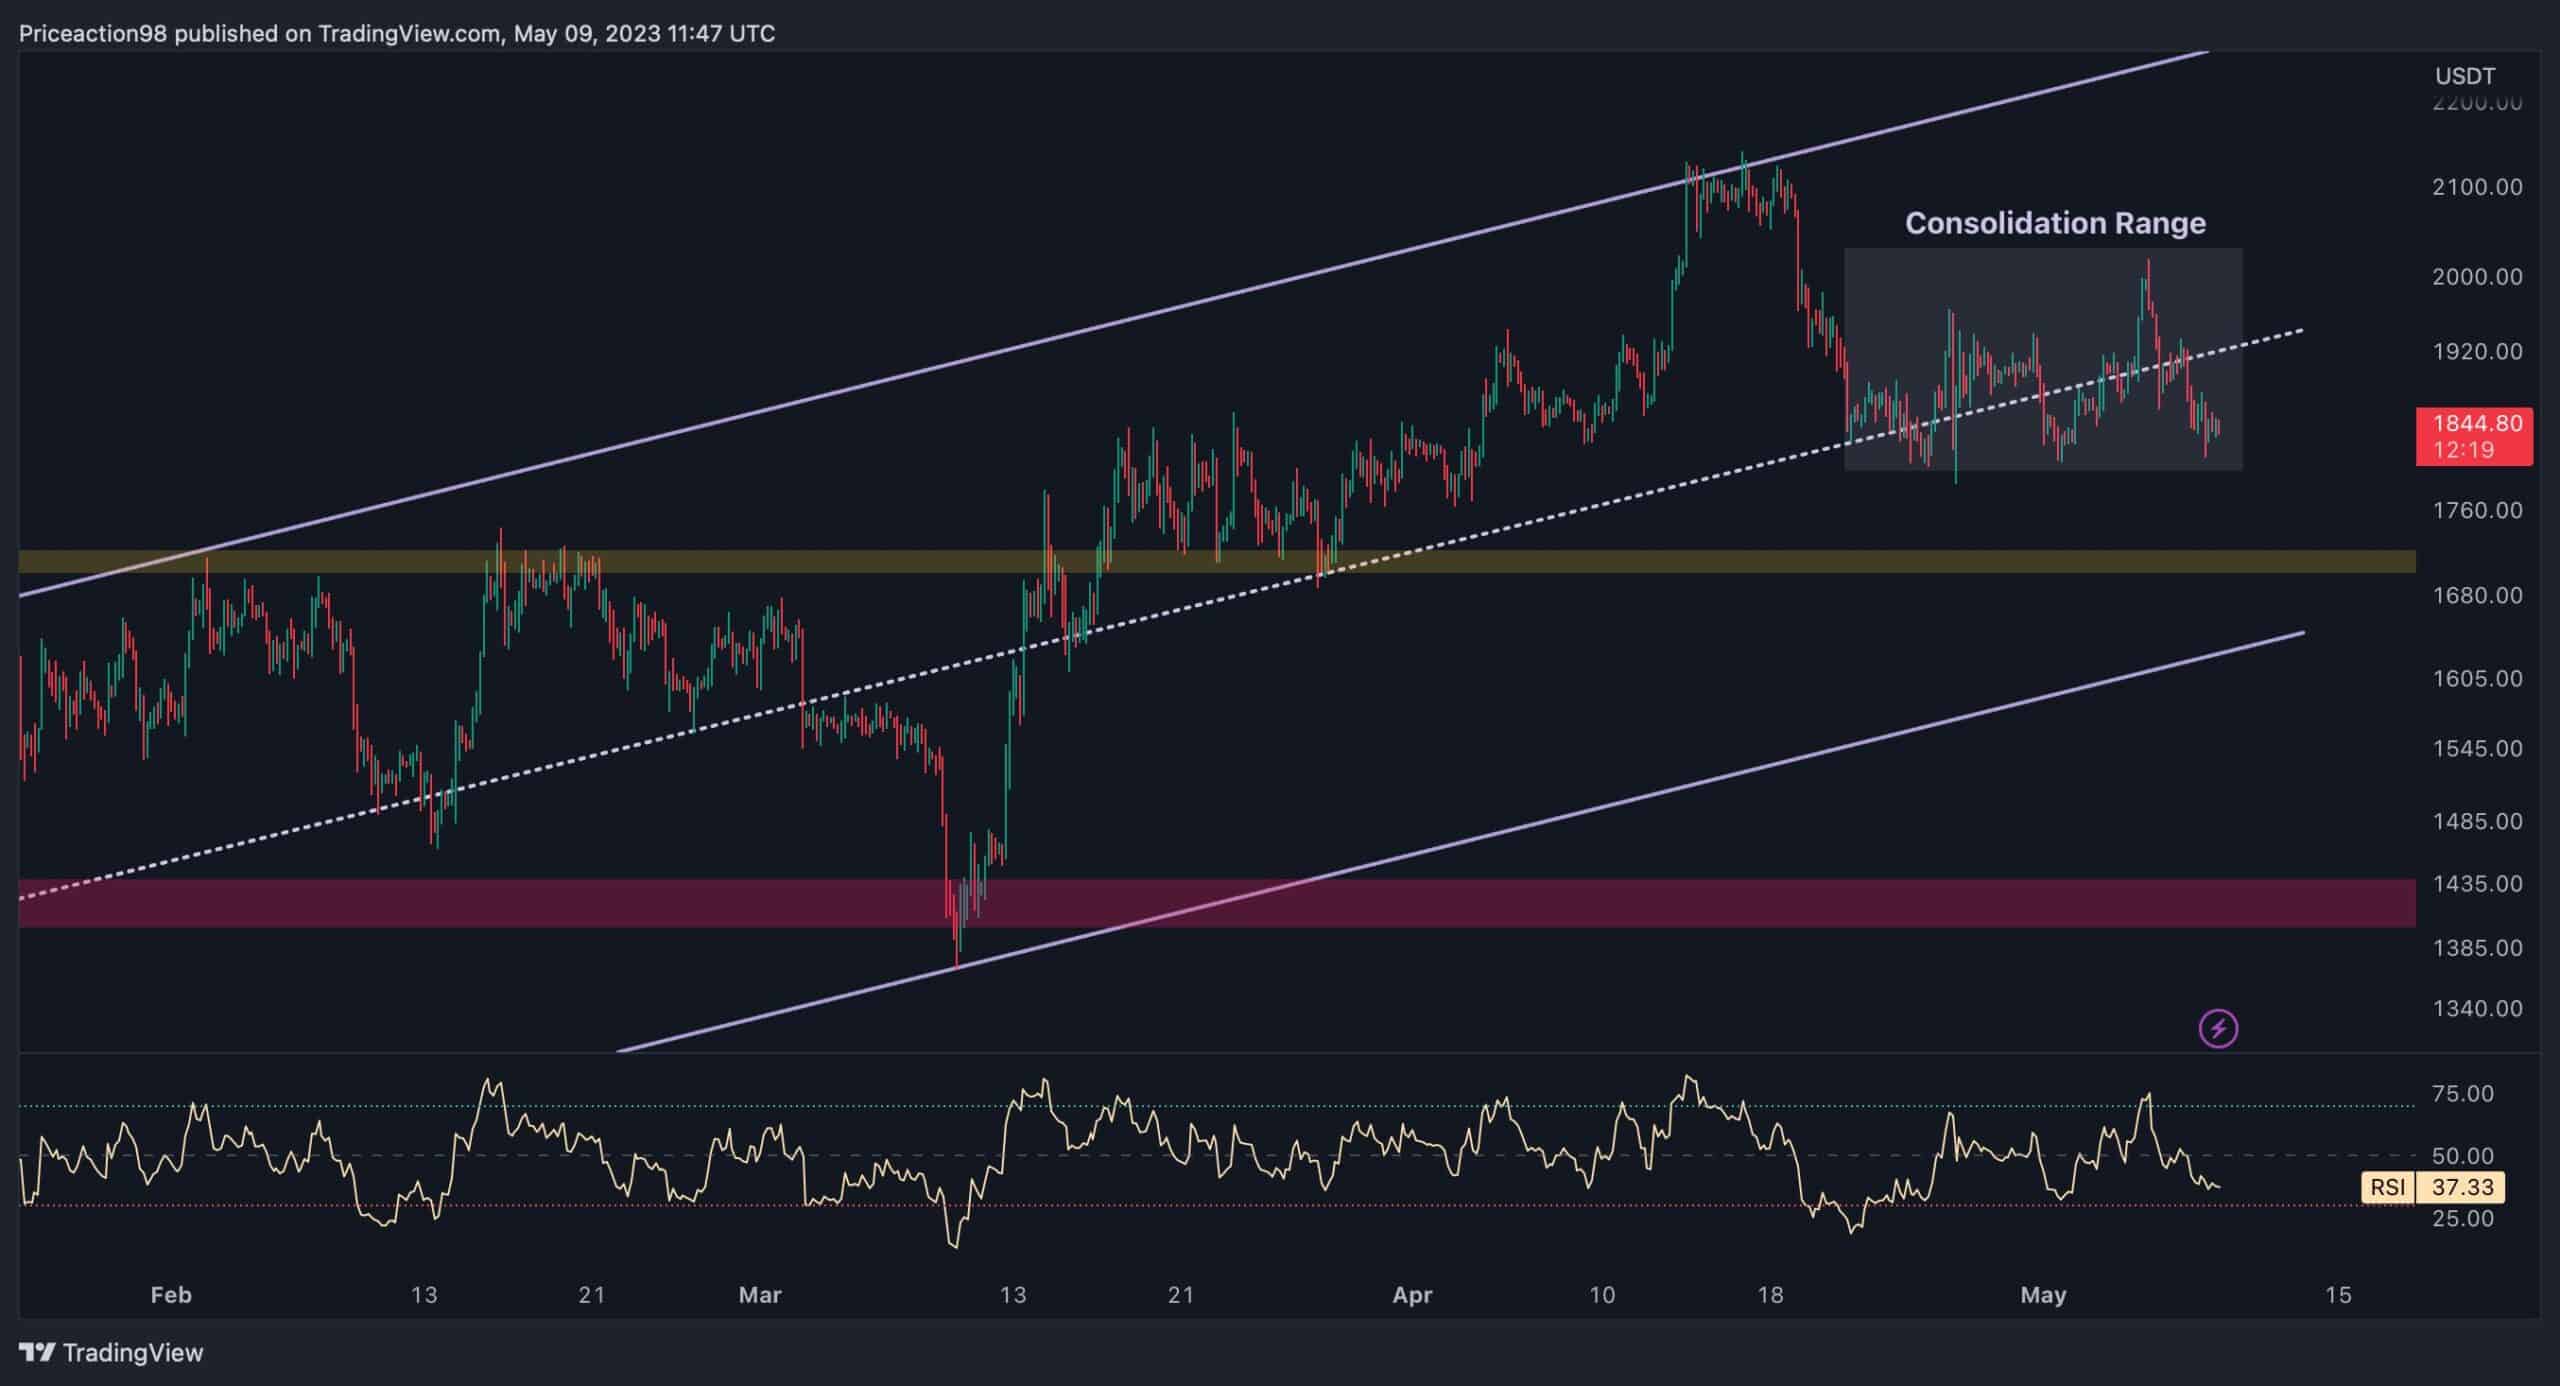
After dropping to the middle boundary of the channel, Ethereum’s price has entered a consolidation range that is clearly evident in the 4-hour timeframe. This price action suggests a battle between the bulls and bears at this crucial price level, where buying and selling pressure appear to be evenly matched.
Despite this, a downward break of the consolidation range would lead to Ethereum’s next stop at the $1.7K range, whereas a resurgence of the bull’s dominance over the bears would likely see the price attack the $2.1K resistance region.
On-chain Analysis
By Shayan
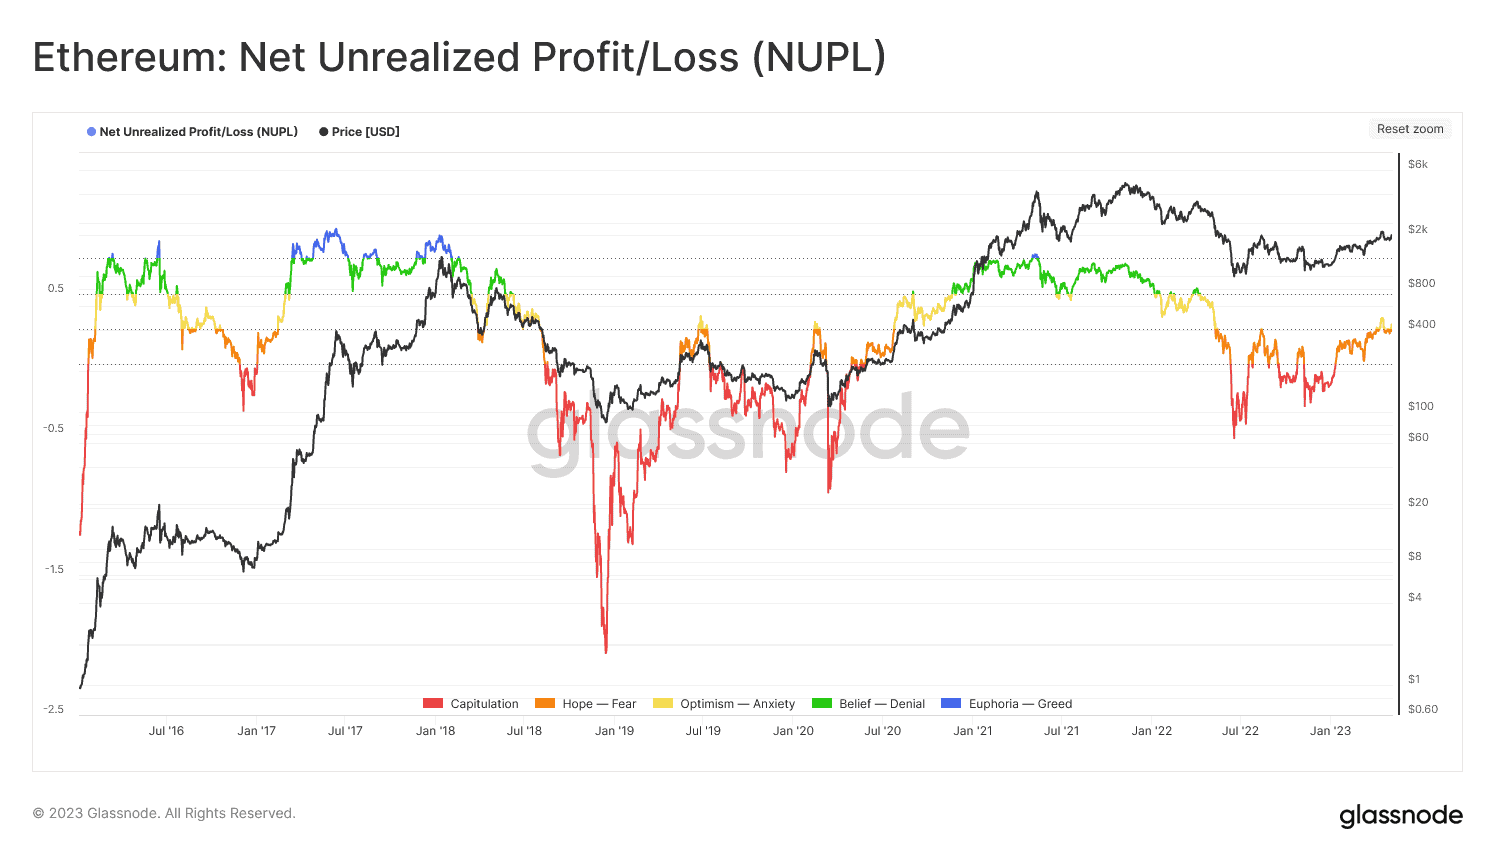
Ethereum’s price has been trending upward since the start of 2023, with many investors regaining their profitability. The Net Unrealized Profit/Loss (NUPL) metric, as depicted on the chart, reveals the total amount of profit/loss across all the coins, represented as a ratio.
This ratio may be interpreted as the proportion of investors who are profitable. Values over 0 denote investor profitability, and a rising trend in value indicates that an increasing number of investors are becoming profitable.
Given the recent uptrend in NUPL, it follows that more investors are achieving profitability, providing a bullish sentiment across the market. Although this could signal the beginning of a new bull market, investors may soon realize their profits, causing short-term corrections due to growing selling pressure.
The post ETH Bears Take Control as $1.8K Support Seemingly Next to Test (Ethereum Price Analysis) appeared first on CryptoPotato.