DOT Soars 4% Daily as the Bulls Target This Level Next (Polkadot Price Analysis)
Polkadot’s price action has been choppy lately, with the market going through a consolidation period over the last month. However, things might be turning for the better.
Technical Analysis
By TradingRage
The Daily Chart
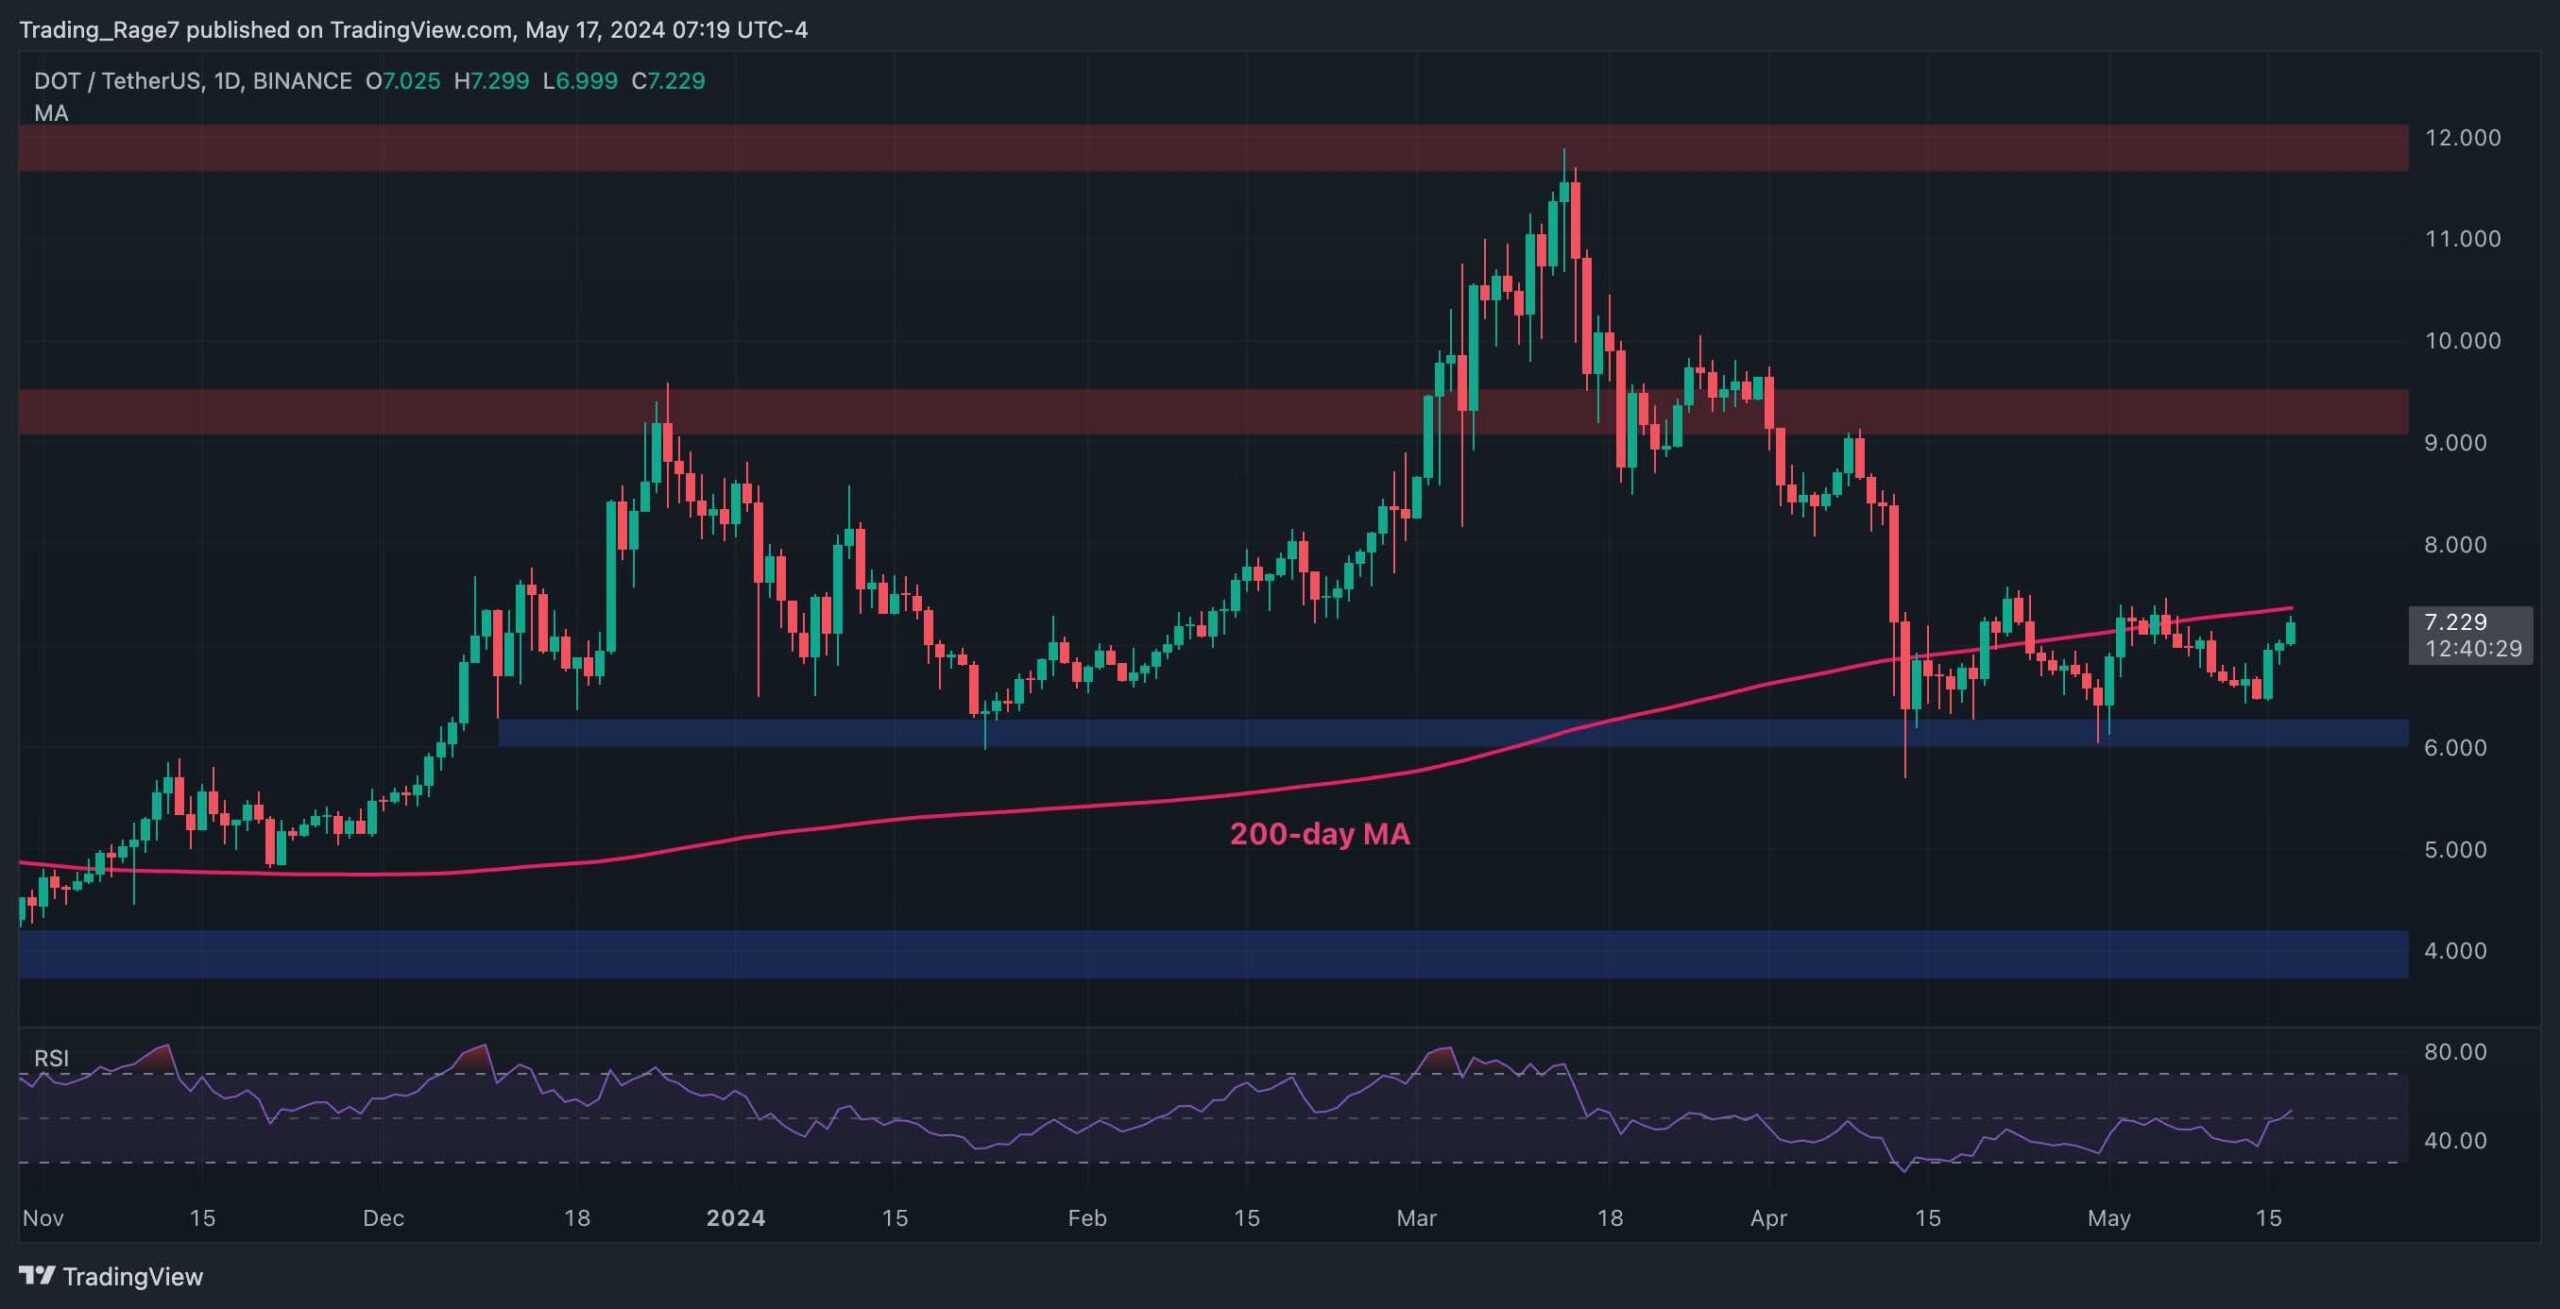
In the daily timeframe, it is evident that DOT’s price has been hovering below the 200-day moving average, at around the $7.5 mark, for a while now. Yet, the cryptocurrency is approaching the moving average again, looking to break above.
Since the $6 support level has held the price several times, a bullish breakout above the moving average seems more likely than a bearish continuation. Therefore, a climb above the 200-day moving average and toward $9 is a probable scenario in the short term.
The 4-Hour Chart
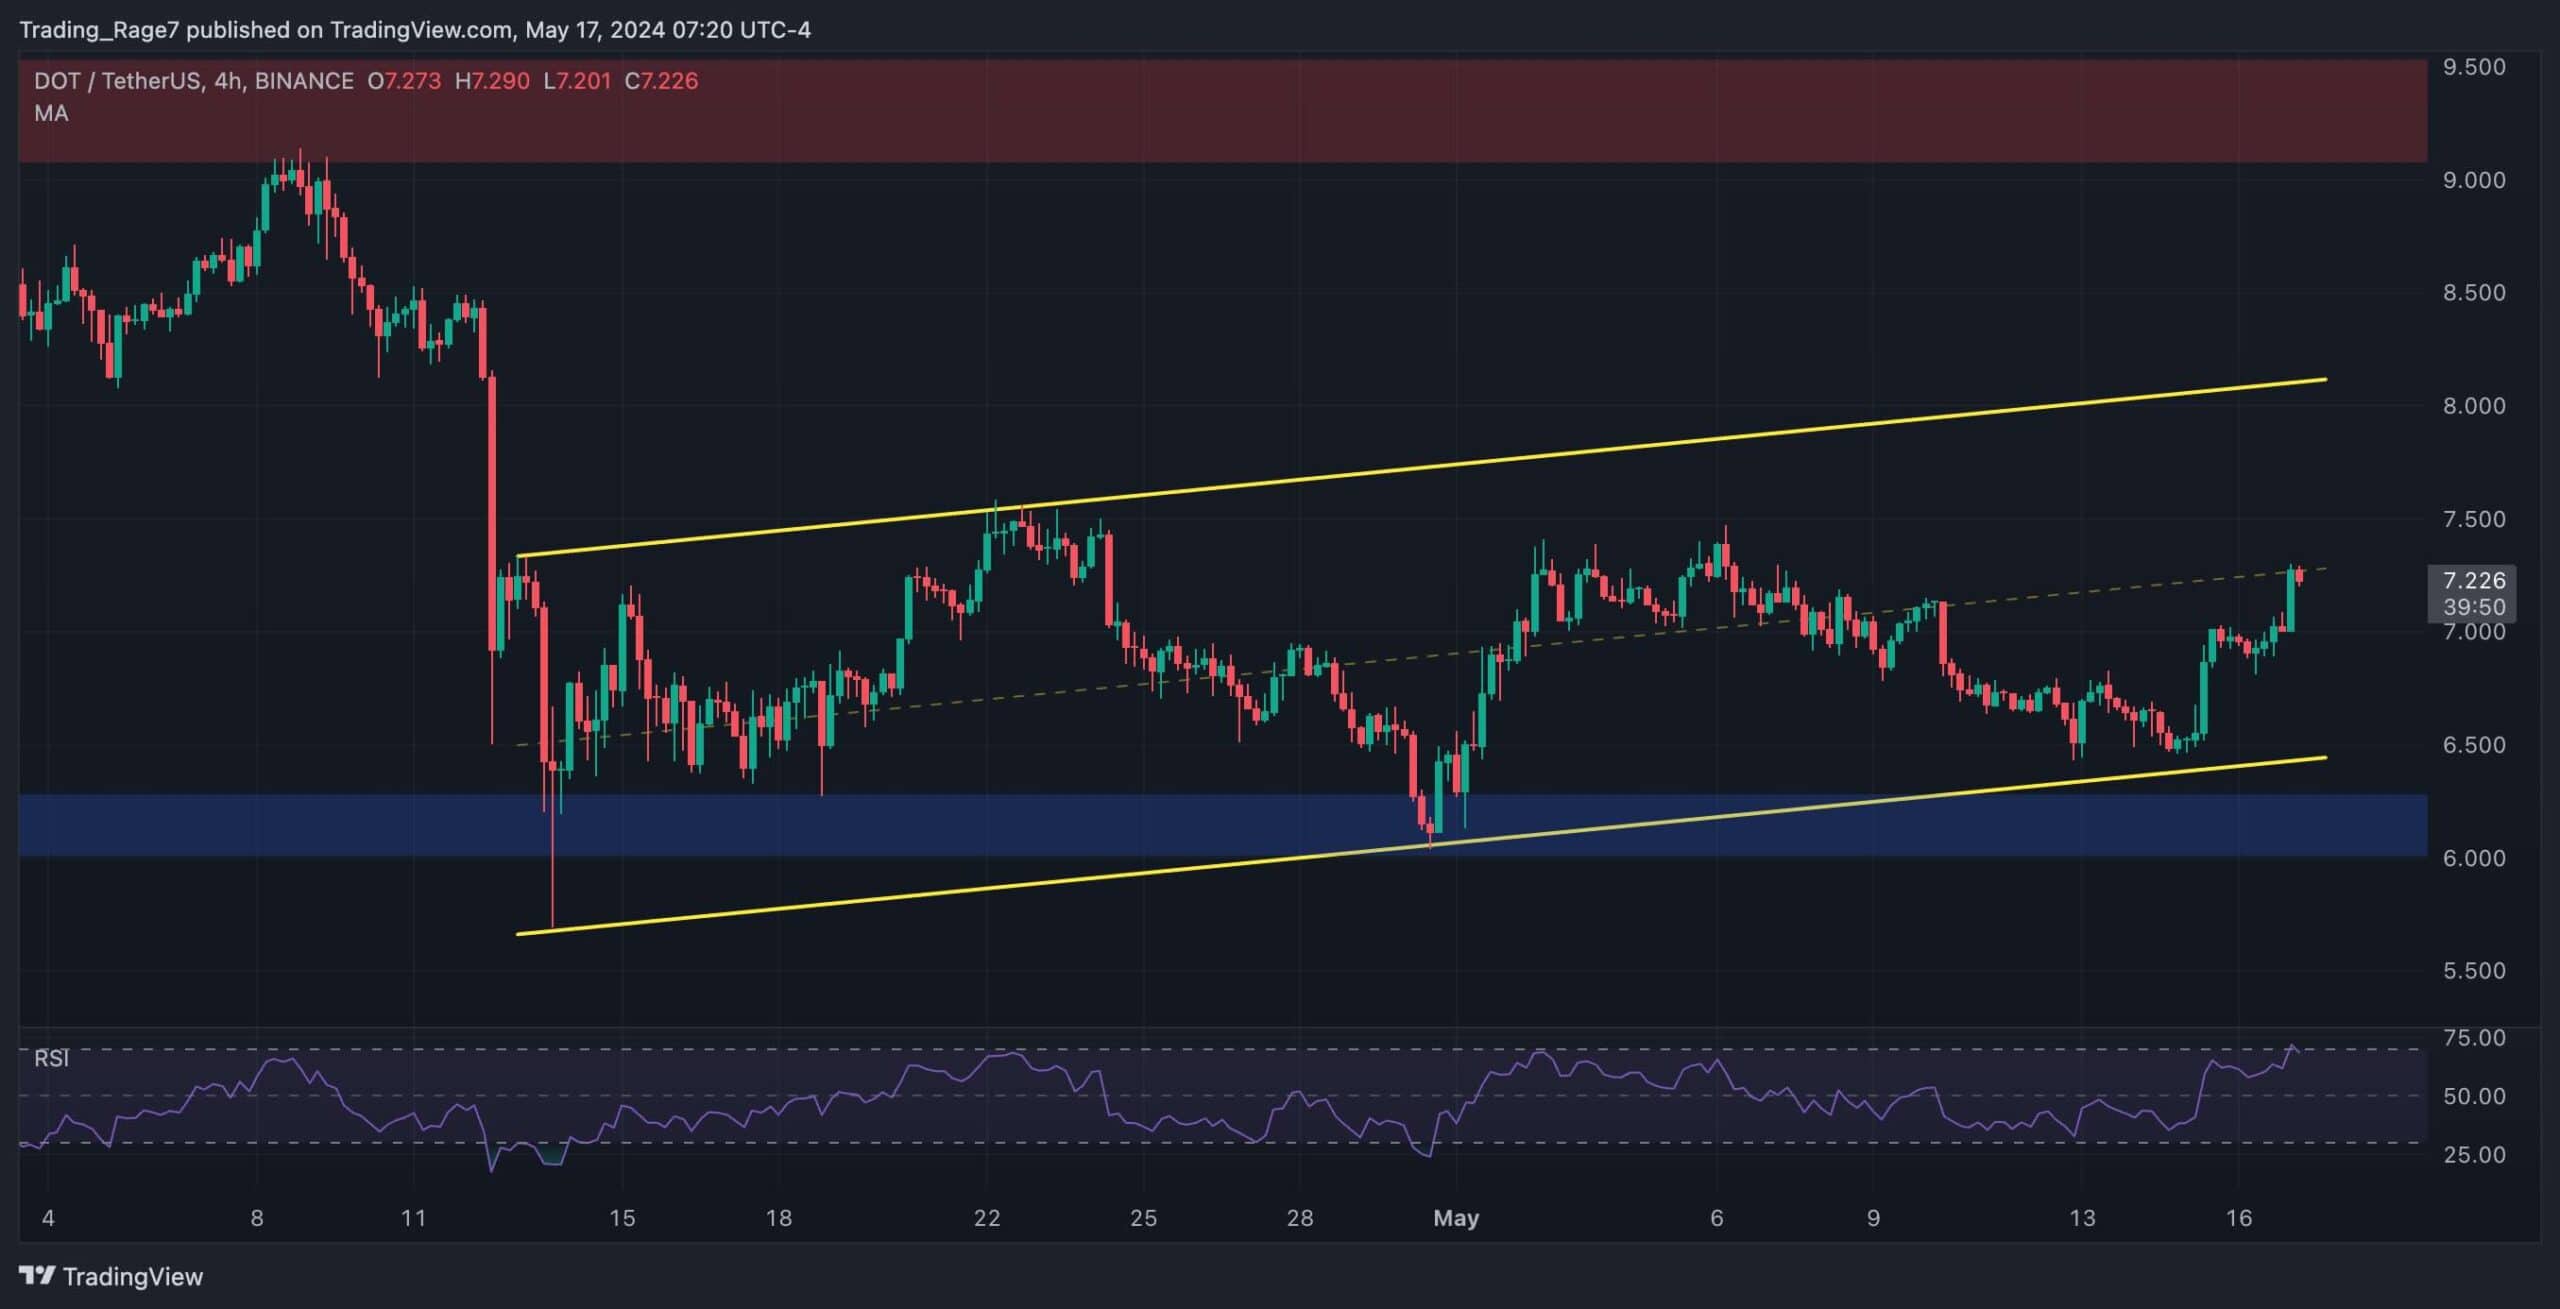
The 4-hour timeframe clearly shows the recent price action. The market has been gradually rising in a large ascending channel. Following a rebound from the lower boundary, Polkadot tested the channel’s midline.
A rally toward the higher boundary and the $8 price mark could be expected if a breakout occurs. Yet, investors should be wary of the Relative Strength Index reaching the overbought region, as short-term correction could also take place.
Futures Market Analysis
By TradingRage
Polkadot Binance Liquidation Heatmap
Analyzing the futures market could deliver valuable insights about key levels to watch, with the DOT price seemingly finding a bottom. This chart shows the Binance DOT/USDT perpetual pair’s liquidation heatmap. It indicates where the most liquidity resides.
A considerable amount of liquidity is found above the recent high of $7.5. Therefore, it could be a target for the market to clear in the short term. Consequently, an increase above this area could lead to a short-liquidation cascade that would probably push the price toward the $9 region.

The post DOT Soars 4% Daily as the Bulls Target This Level Next (Polkadot Price Analysis) appeared first on CryptoPotato.