DOT Price Is at Critical Juncture With Potential Retracement to $6 in Sight (Polkadot Price Analysis)
Polkadot recently encountered significant selling pressure at a key resistance region, encompassing the 100-day moving average and the crucial $7.4 level.
This resistance has led to a potential continuation of the bearish retracement.
Technical Analysis
By Shayan
The Daily Chart
A detailed examination of Polkadot’s daily chart reveals a bearish sentiment, with the price being rejected after a period of sideways movement around the critical $7.4 resistance level and the significant 100-day moving average. Sellers appear to be dominating the market, with a continued bearish retracement towards the $6.5 threshold looking increasingly likely.
However, in a broader context, the asset remains confined within a decisive range marked by the $7.4 resistance and the $6.5 support. A definitive breakout from this range will likely set the direction for a sustained trend.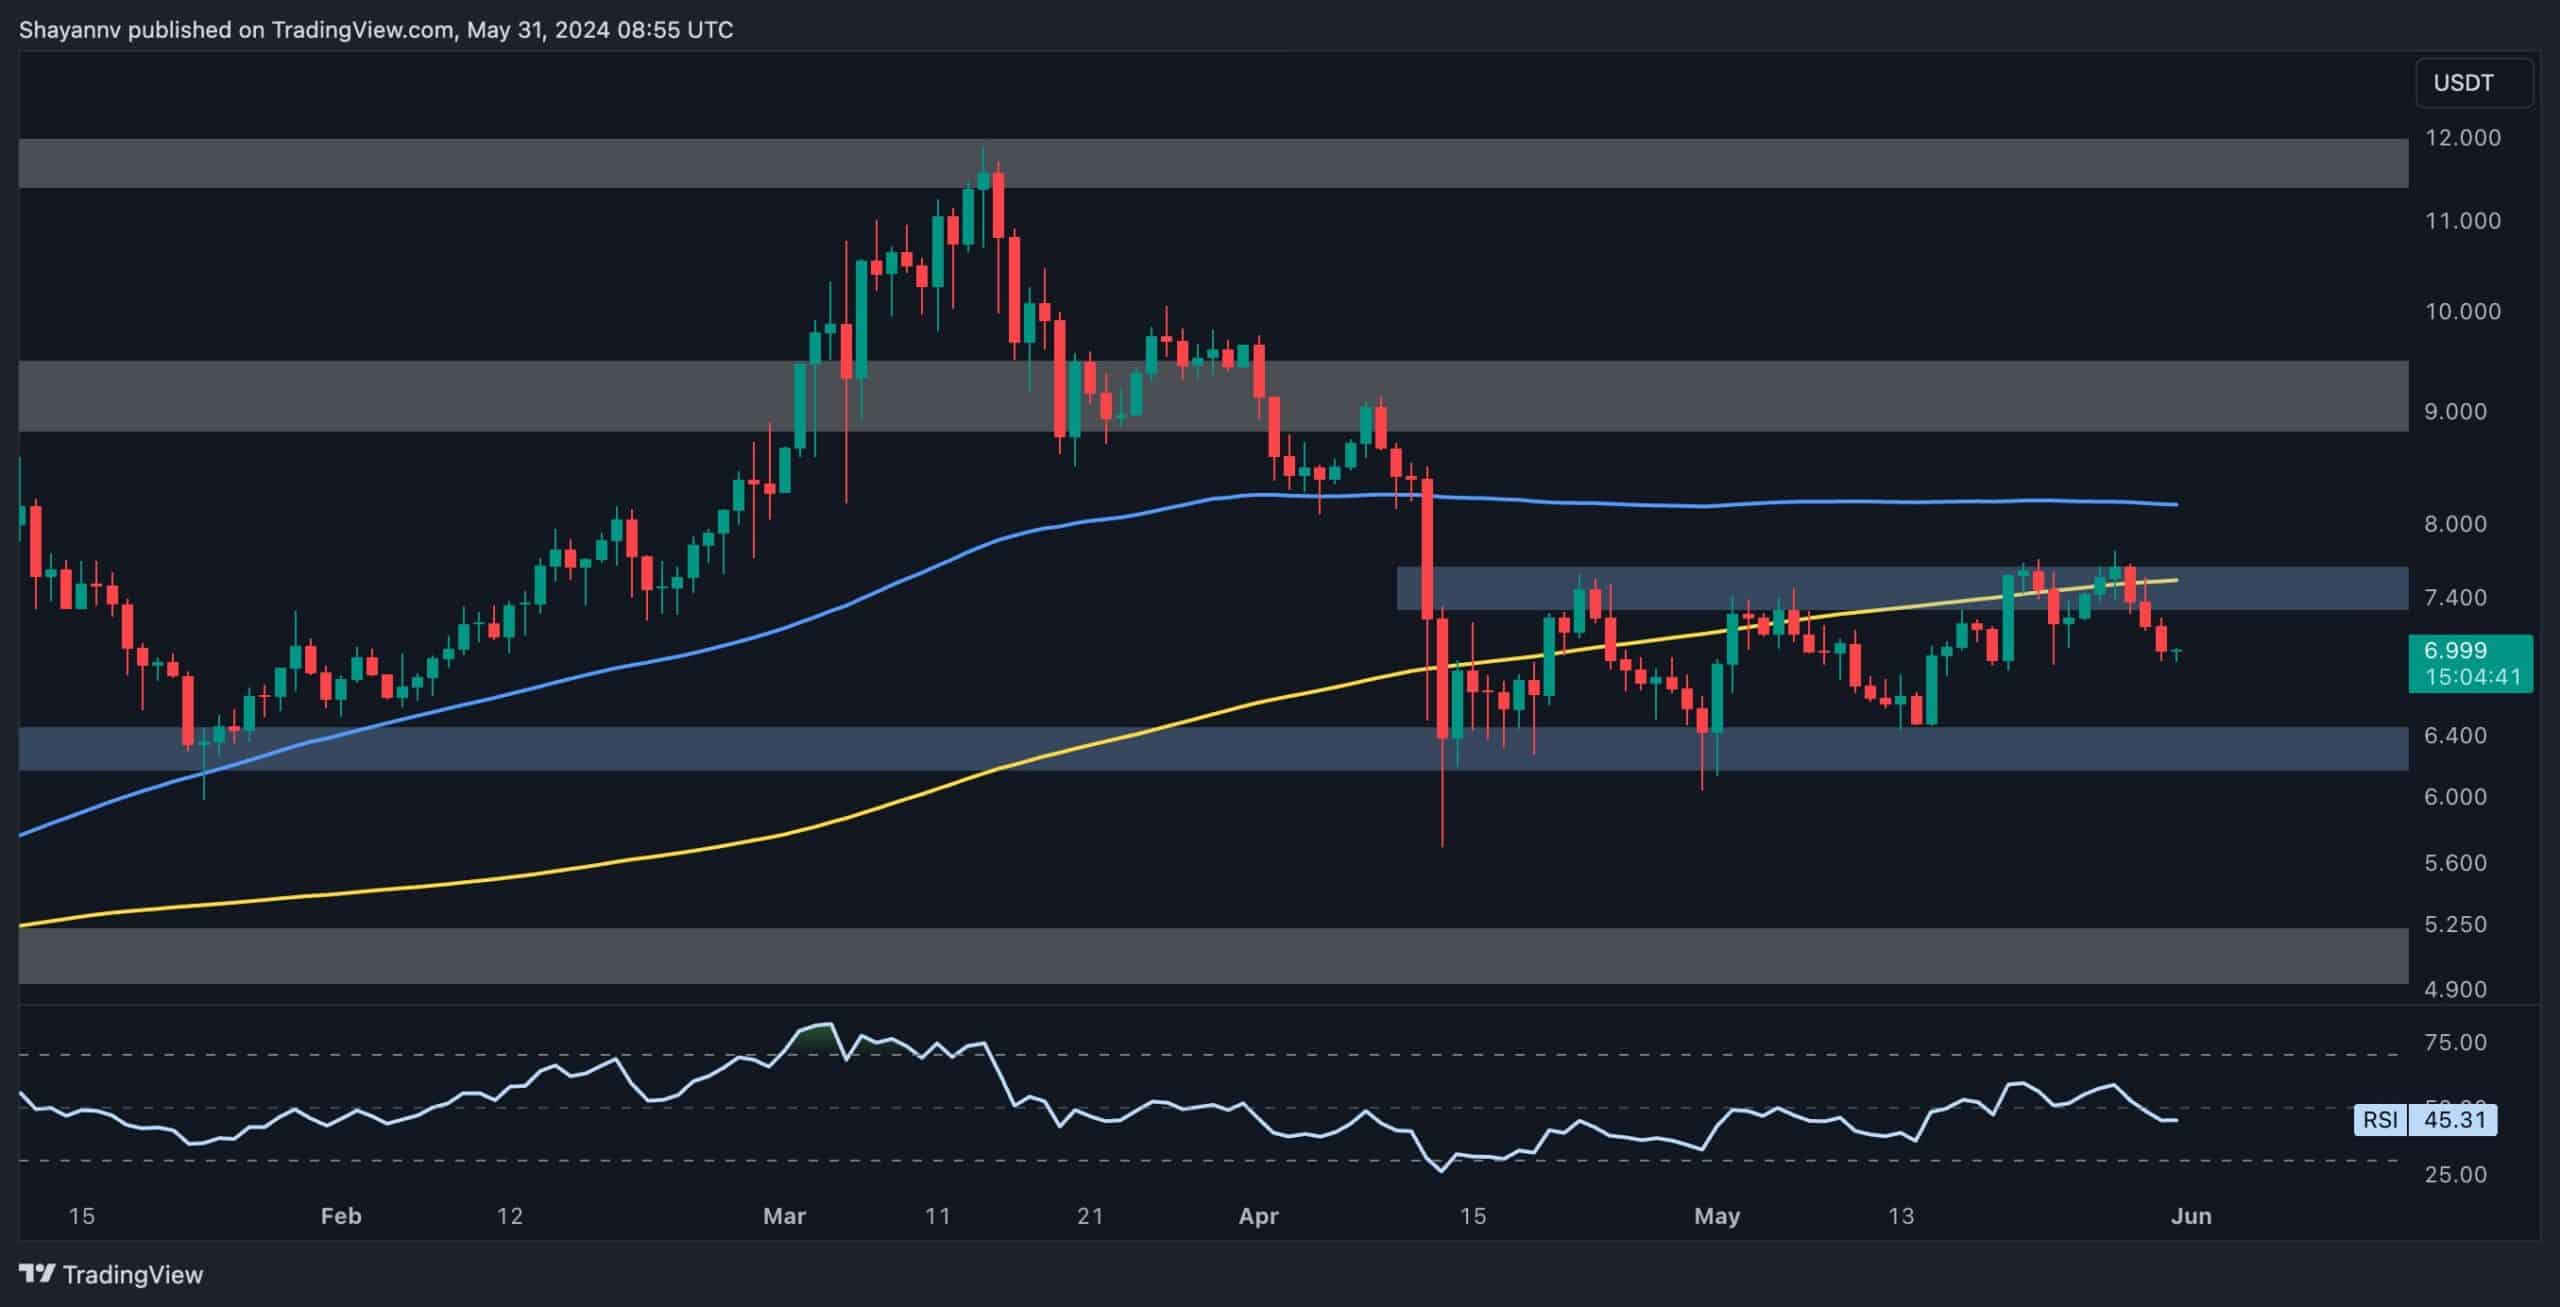
The 4-Hour Chart
On the 4-hour chart, Polkadot buyers have been unable to overcome the crucial resistance region defined by the 0.5 ($7.4) and 0.618 ($7.8) Fibonacci levels, facing intensified selling pressure. This selling activity has led to a notable rejection, initiating a bearish retracement towards the lower boundary of an ascending wedge at $7.
The price is currently struggling against this substantial support, and if sellers succeed in breaking below the wedge’s lower boundary, an impulsive bearish decline toward the $6 support region is imminent.
In summary, Polkadot is at a critical juncture. A failure to hold current support levels could lead to further declines, while a successful defense might allow for consolidation and potential recovery.
Sentiment Analysis
By Shayan
Analyzing the futures market metrics alongside Polkadot’s price fluctuations can indeed provide valuable insights for traders. The liquidation heatmap for the DOT/USDT Binance pair, as depicted in the chart, offers a visualization of significant liquidity pools that may influence price movements.
Currently, Polkadot’s price is confined within a critical range, with resistance around $7.4 and support near $6.5. The heatmap indicates that within this range, the $6.9 and $7.2 levels contain the most substantial liquidity close to the current price.
Therefore, any breakout from either of these levels could trigger a cascade of liquidations, potentially fueling the move and leading to a breakout from the range. Such a breakout could initiate a sustained trend in the direction of the breakout.
The post DOT Price Is at Critical Juncture With Potential Retracement to $6 in Sight (Polkadot Price Analysis) appeared first on CryptoPotato.