DOT Crashes by 8% Weekly but is a Bear Trap Possible? (Polkadot Price Analysis)
Polkadot has seen a lack of demand and intensified selling activity, indicating a bearish sentiment in the market. A sudden breach below the crucial $6 support region has occurred, triggering a cascade of long liquidations and potentially leading to a sustained bearish trend unless it turns out to be a false breakout.
Technical Analysis
By Shayan
The Daily Chart
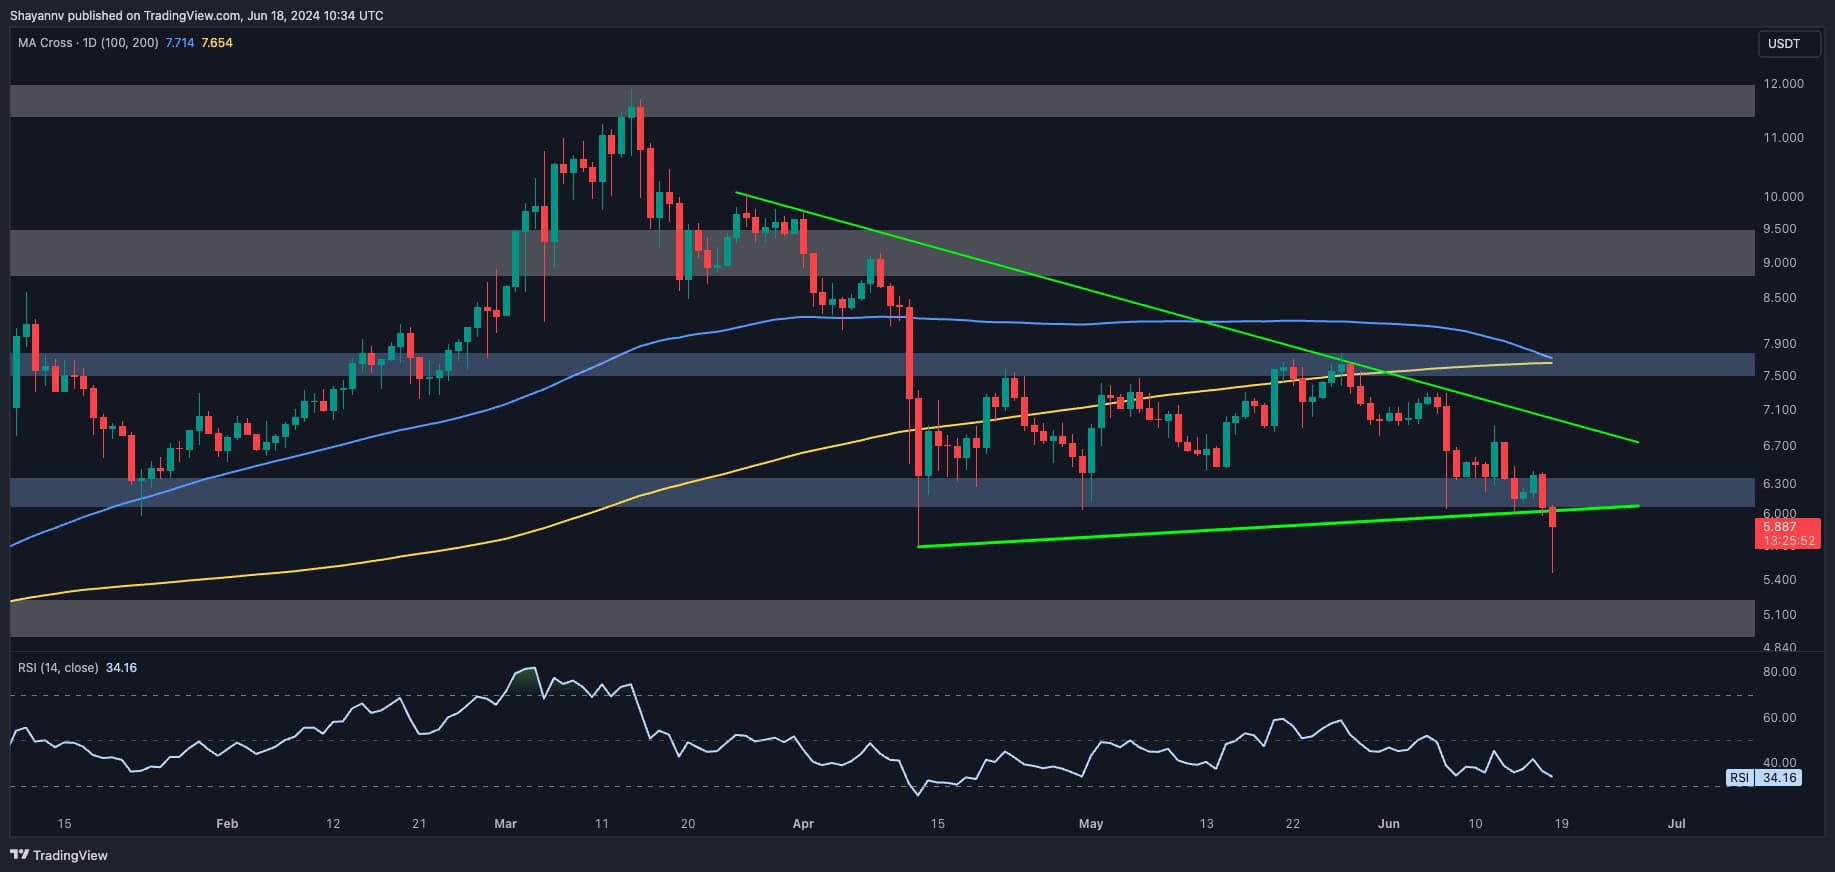
The daily chart reveals that Polkadot has faced aggressive selling near the critical $6 support region and has experienced bearish retracements, underscoring the lack of sufficient demand.
The price has breached the substantial $6 support, aligning with the lower boundary of a multi-month triangle and previous major swing lows, flashing a notable bearish sign.
Additionally, the 100-day moving average is on the verge of crossing below the 200-day moving average, signaling a death cross. This development further indicates prevailing bearish sentiment in the market. A sustained bearish trend toward lower price levels is likely if the breakout is confirmed with a successful pullback.
The 4-Hour Chart
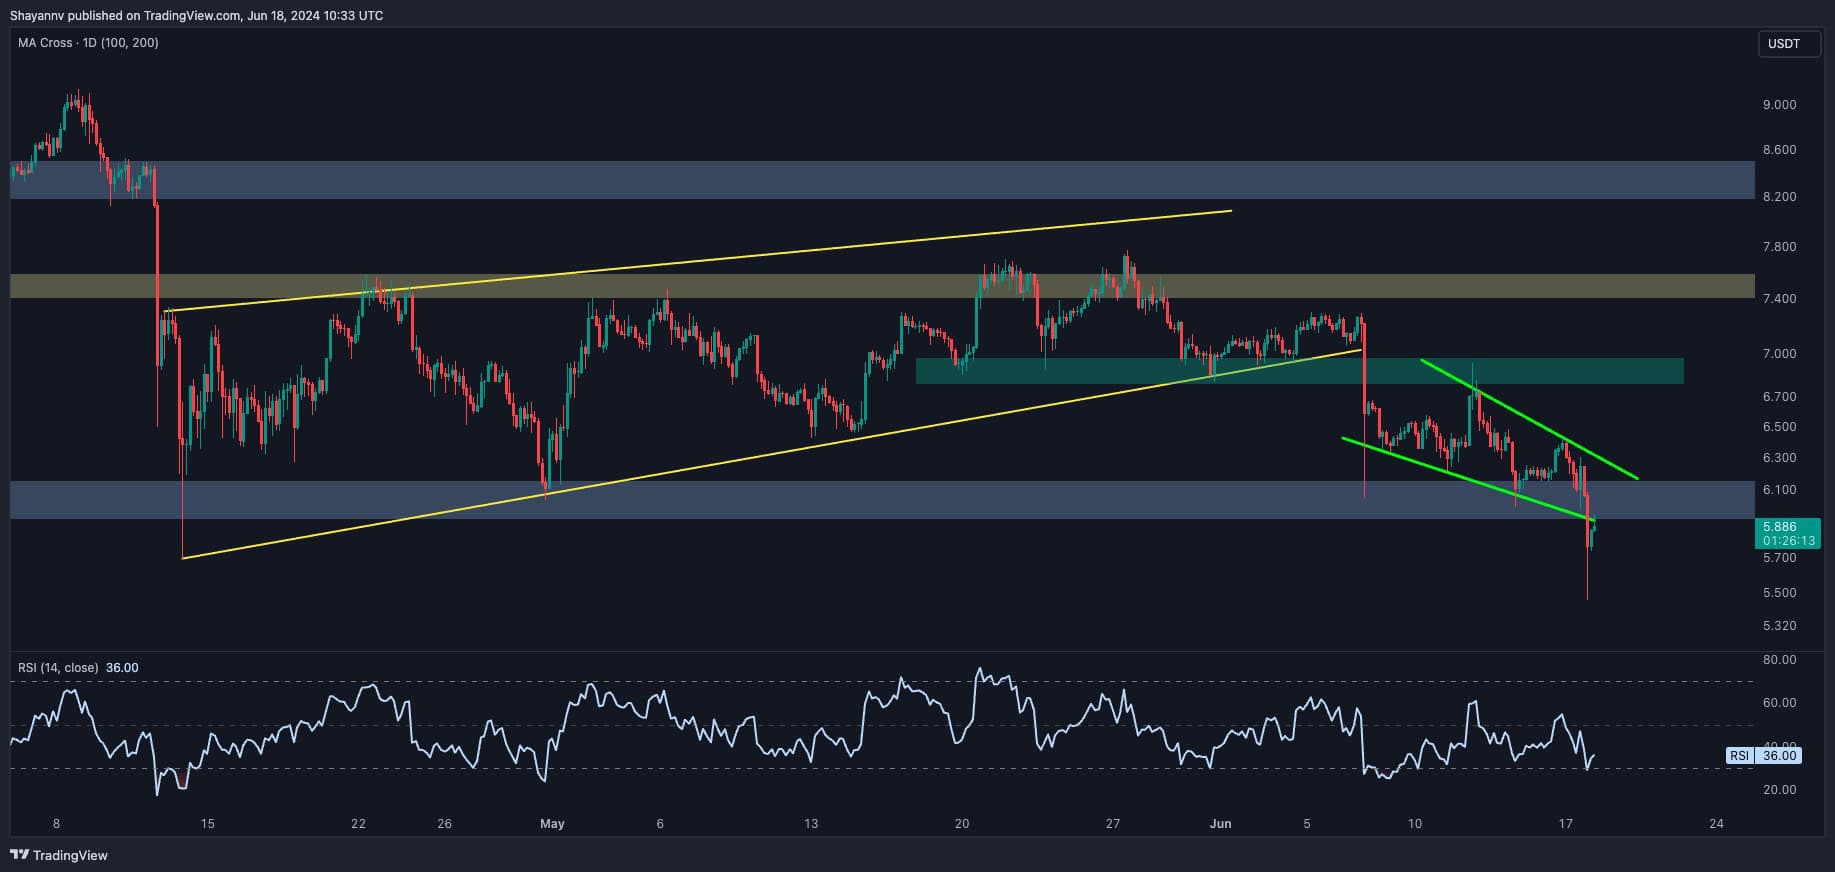
On the 4-hour chart, Polkadot faced significant rejection near the $6.8 supply zone after an impulsive surge, completing a pullback to the broken region and verifying the initial breakout, indicating the sellers’ dominance.
Upon reaching the crucial $6 support region, the bearish momentum initially faded, leading to slight fluctuations. Near this pivotal threshold, the price had formed a descending wedge pattern, suggesting the potential for a bullish reversal.
However, sellers ultimately dominated, breaching the pattern’s lower boundary and the significant $6 support region. This bearish breakout might end up being a false one, indicating a bear trap.
Hence, the price action in the coming days will determine the breakout’s validity. If a pullback occurs and holds below the $6 mark, the continuation of the bearish trend will be imminent.
Sentiment Analysis
By Shayan
Polkadot’s price is going through significant bearish activity and has broken below the crucial $6 support region. Analyzing the futures market sentiment can provide valuable insights into the cryptocurrency’s potential future path.
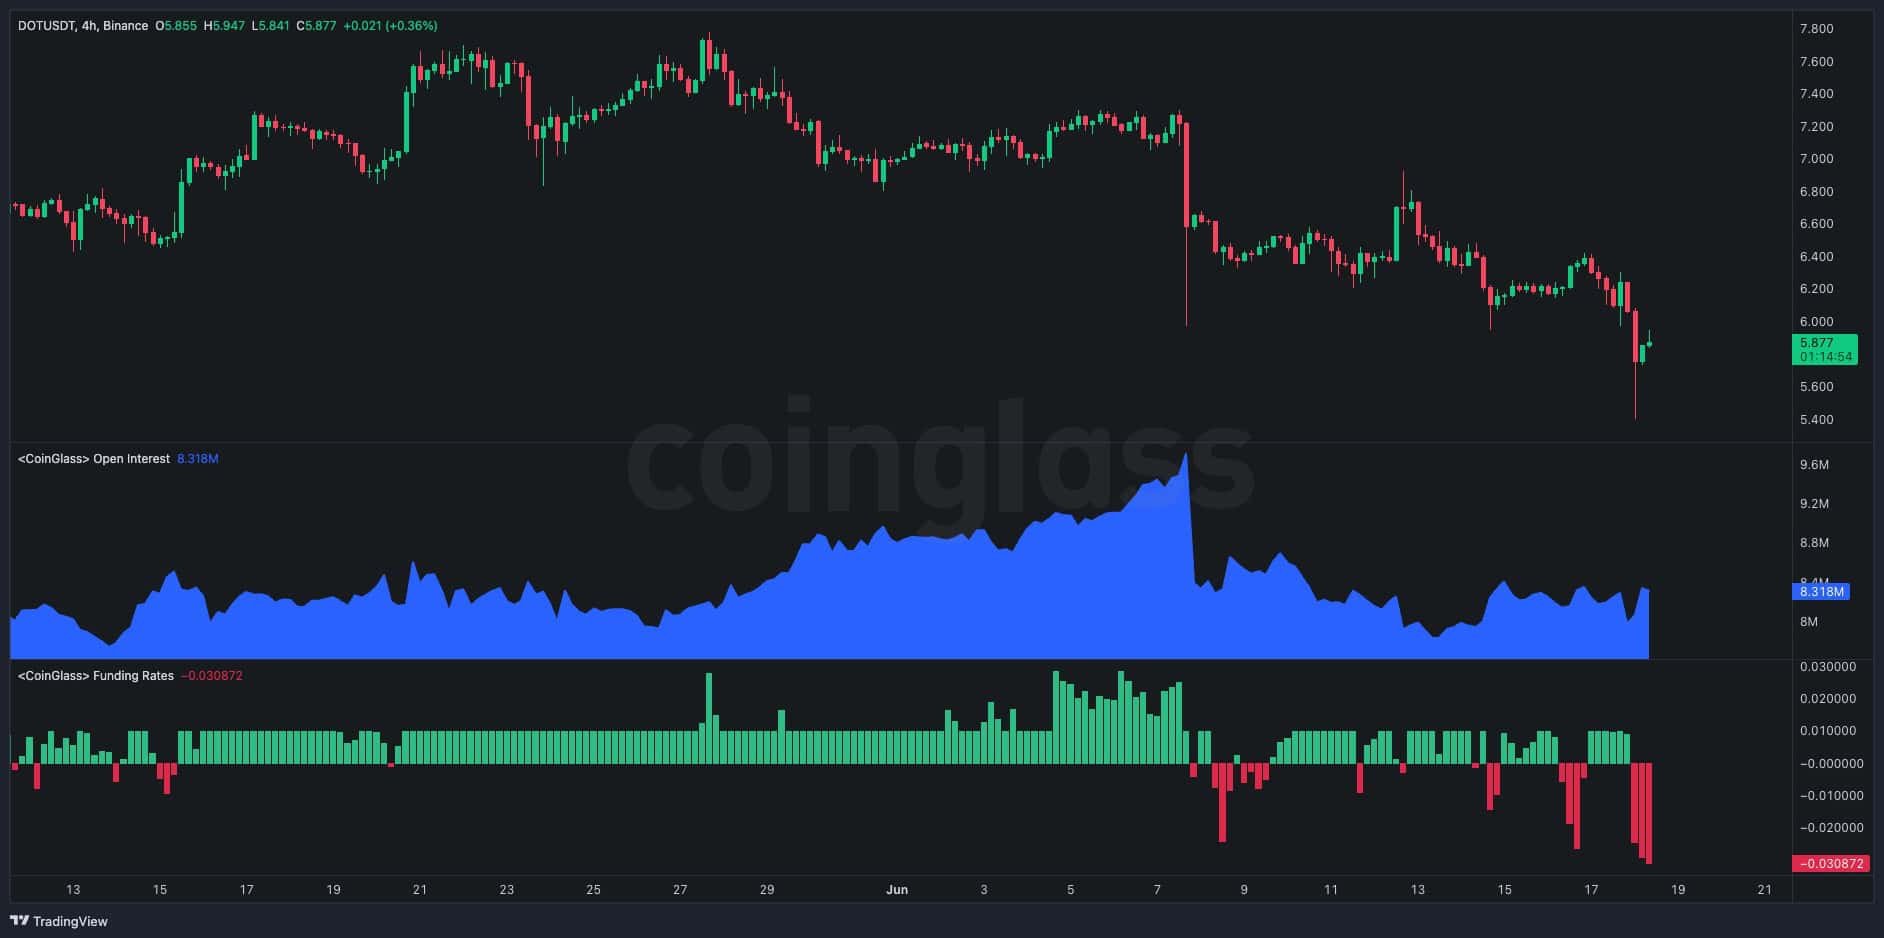
The accompanying chart presents Polkadot’s price alongside the Open Interest (OI) and Funding Rates metrics. The recent bearish descent is mirrored by a significant plunge in the OI metric, reaching its lowest value. This indicates a lack of interest from market participants in taking aggressive long positions, suggesting that the futures market has cooled down with minimal activity.
Typically, this scenario is not favorable for the price, especially when it is accompanied by negative or near-zero funding rate values. Low open interest coupled with negative funding rates suggests a prevailing bearish sentiment in the market. Unless a change in the upcoming days brings demand back into the market, the bearish trend is likely to continue.
The post DOT Crashes by 8% Weekly but is a Bear Trap Possible? (Polkadot Price Analysis) appeared first on CryptoPotato.