Do or Die For BTC: Another Retest of the Long-Term Support Line
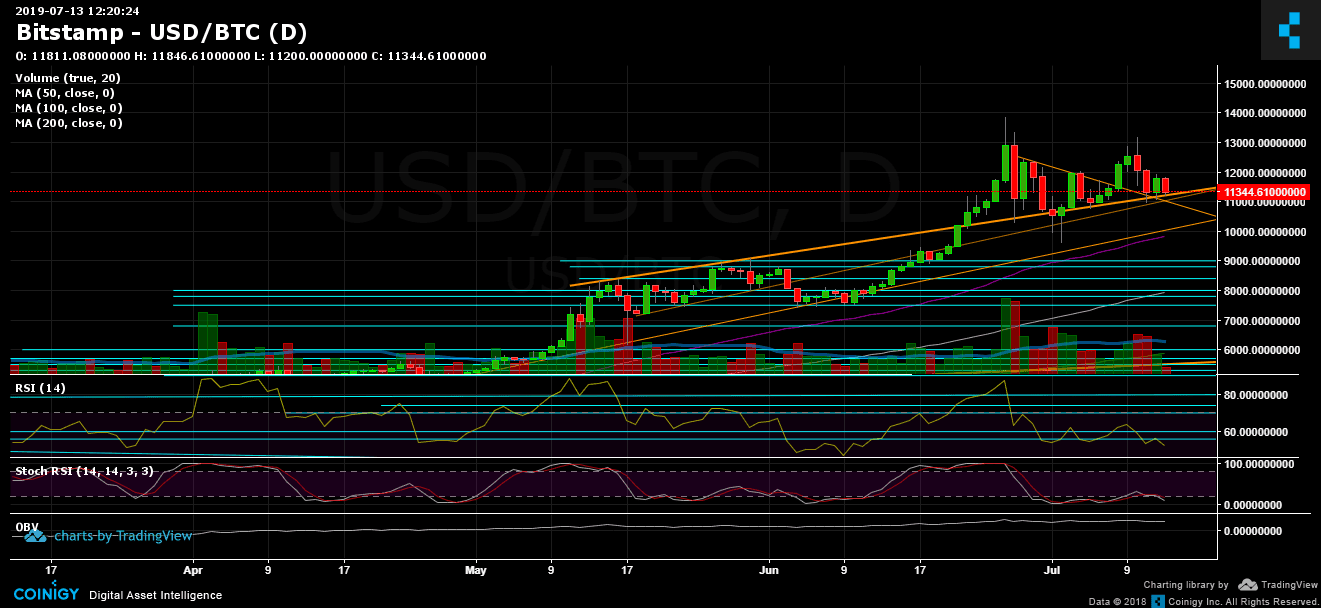
Bitcoin’s extreme volatility continues: After the $2,000 24-hour drop two days ago, Bitcoin has found support above the ascending trend line on the daily chart.
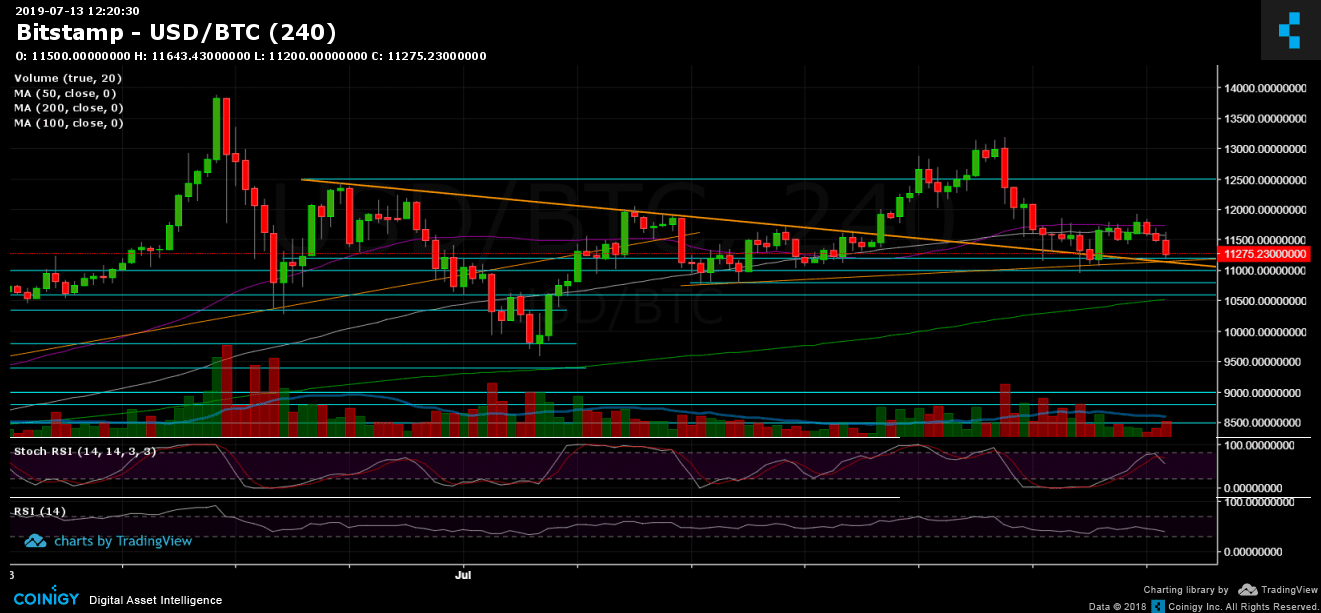
The correction was considerable: Bitcoin almost touched the $12,000 resistance but was rejected, plunging to $11,300 at the time of writing. Not surprisingly, this brings us to another retest of the ascending trend line.
From here, lower support areas are next to be tested. However, I won’t consider this a change of momentum (from bullish to bearish) as long as the $9,400 – $9,600 level is maintained and we don’t see a lower low pattern, which would be bearish.
What is impressive is that despite the plunging Bitcoin price, BTC dominance has remained steady. The situation for the altcoins couldn’t be worse. Ethereum’s price relative to Bitcoin is located at legendary support zones from back in December 2017. The XRP/BTC market has experienced a complete crash since the start of 2019.
Total Market Cap: $309 billion
Bitcoin’s Market Cap: $201.5 billion (still above $200 billion!)
BTC Dominance Index: 65.1%
*Data from CoinGecko
Key Levels to Watch
Support/Resistance: Bitcoin is now facing the long-term ascending trend line (marked in orange on the daily chart). This line has been forming since the middle of May. Below, the next level of support is $11,000. Further down are $10,800, $10,500 (along with the MA-200, marked in green on the 4-hour chart) and $10,000. Below $10K, there are three critical levels to watch: $9,800 along with the 50-day moving average (marked in purple); $9,600, which is the low of the current parabolic move; and $9,400, a significant support level from the previous double top from June.
From above, support-turned-resistance levels exist at $11,500 – $11,600, $12,000, and $12,500. Above the latter is yesterday’s high at $13,000 – $13,200.
Daily chart’s RSI: The RSI is near 50, and a move below 50 could indicate a change from bullish to bearish conditions. The RSI hasn’t been this low since June 11 and is poised to create its first lower low since then (which would be bearish).
Trading Volume: It’s the weekend, which is when there is a high chance of market manipulation. However, volume is relatively low as of now.
Bitfinex open short positions: After recording a yearly low below 5K, the amount of BTC short positions has increased a bit to 6.5 BTC. However, we can’t ignore the past week’s sudden 65% drop in the shorts number.
BTC/USD Bitstamp 4-Hour Chart
BTC/USD Bitstamp 1-Day Chart
The post Do or Die For BTC: Another Retest of the Long-Term Support Line appeared first on CryptoPotato.