Despite the Crash to $25K, is a Bitcoin Bull Market Still in Play? (BTC Price Analysis)
Bitcoin’s price has recently crashed, losing nearly $5,000 in one day.
The following analysis looks at the details behind the crash and how it affects the overall market’s trend.
Technical Analysis
By Edris
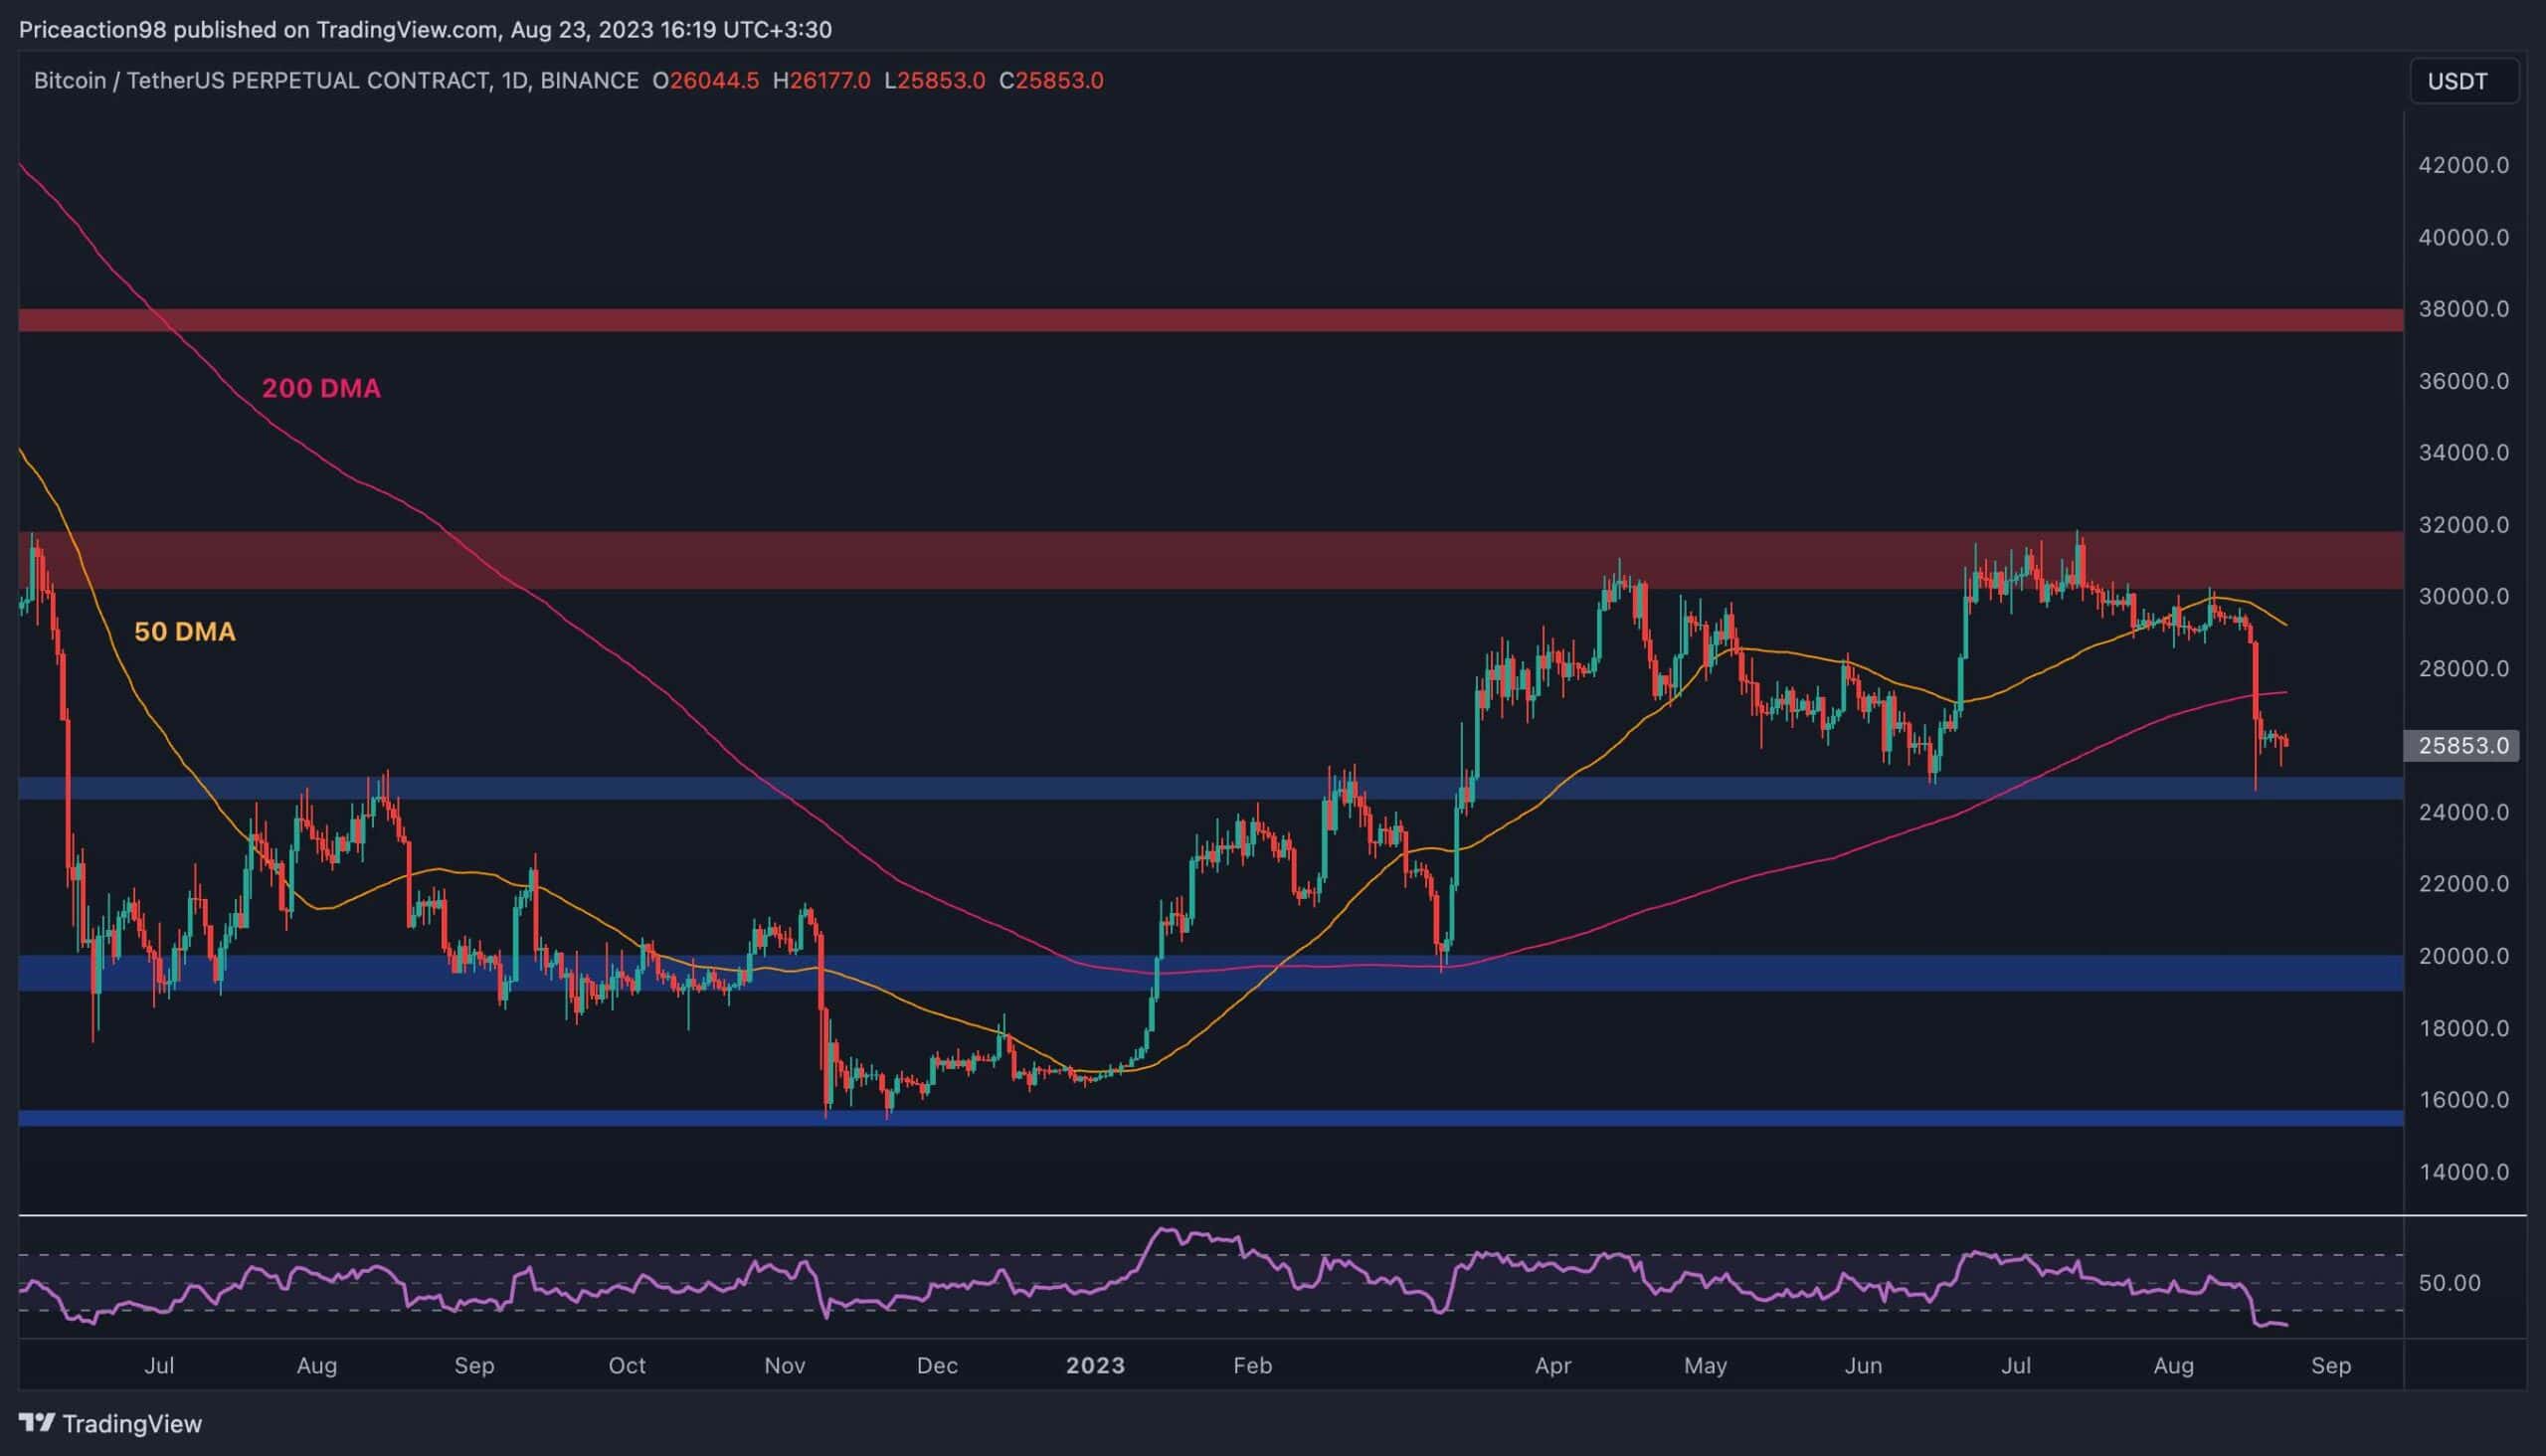
The Daily Chart
On the daily timeframe, the price has been rejected from the $30K resistance level multiple times in recent months.
The last rejection from this level and the 50-day moving average near the same price have initiated a significant drop to the downside. BTC has broken below the critical 200-day moving average around the $28K mark. This is a vital trend indicator, and a drop below it points to a potential bearish shift.
Meanwhile, The $25K support currently holds the price, preventing it from dropping deeper. Still, with the overall market structure looking bearish, there is a considerable probability for a pullback to the 200-day moving average and a further continuation lower in the coming weeks.
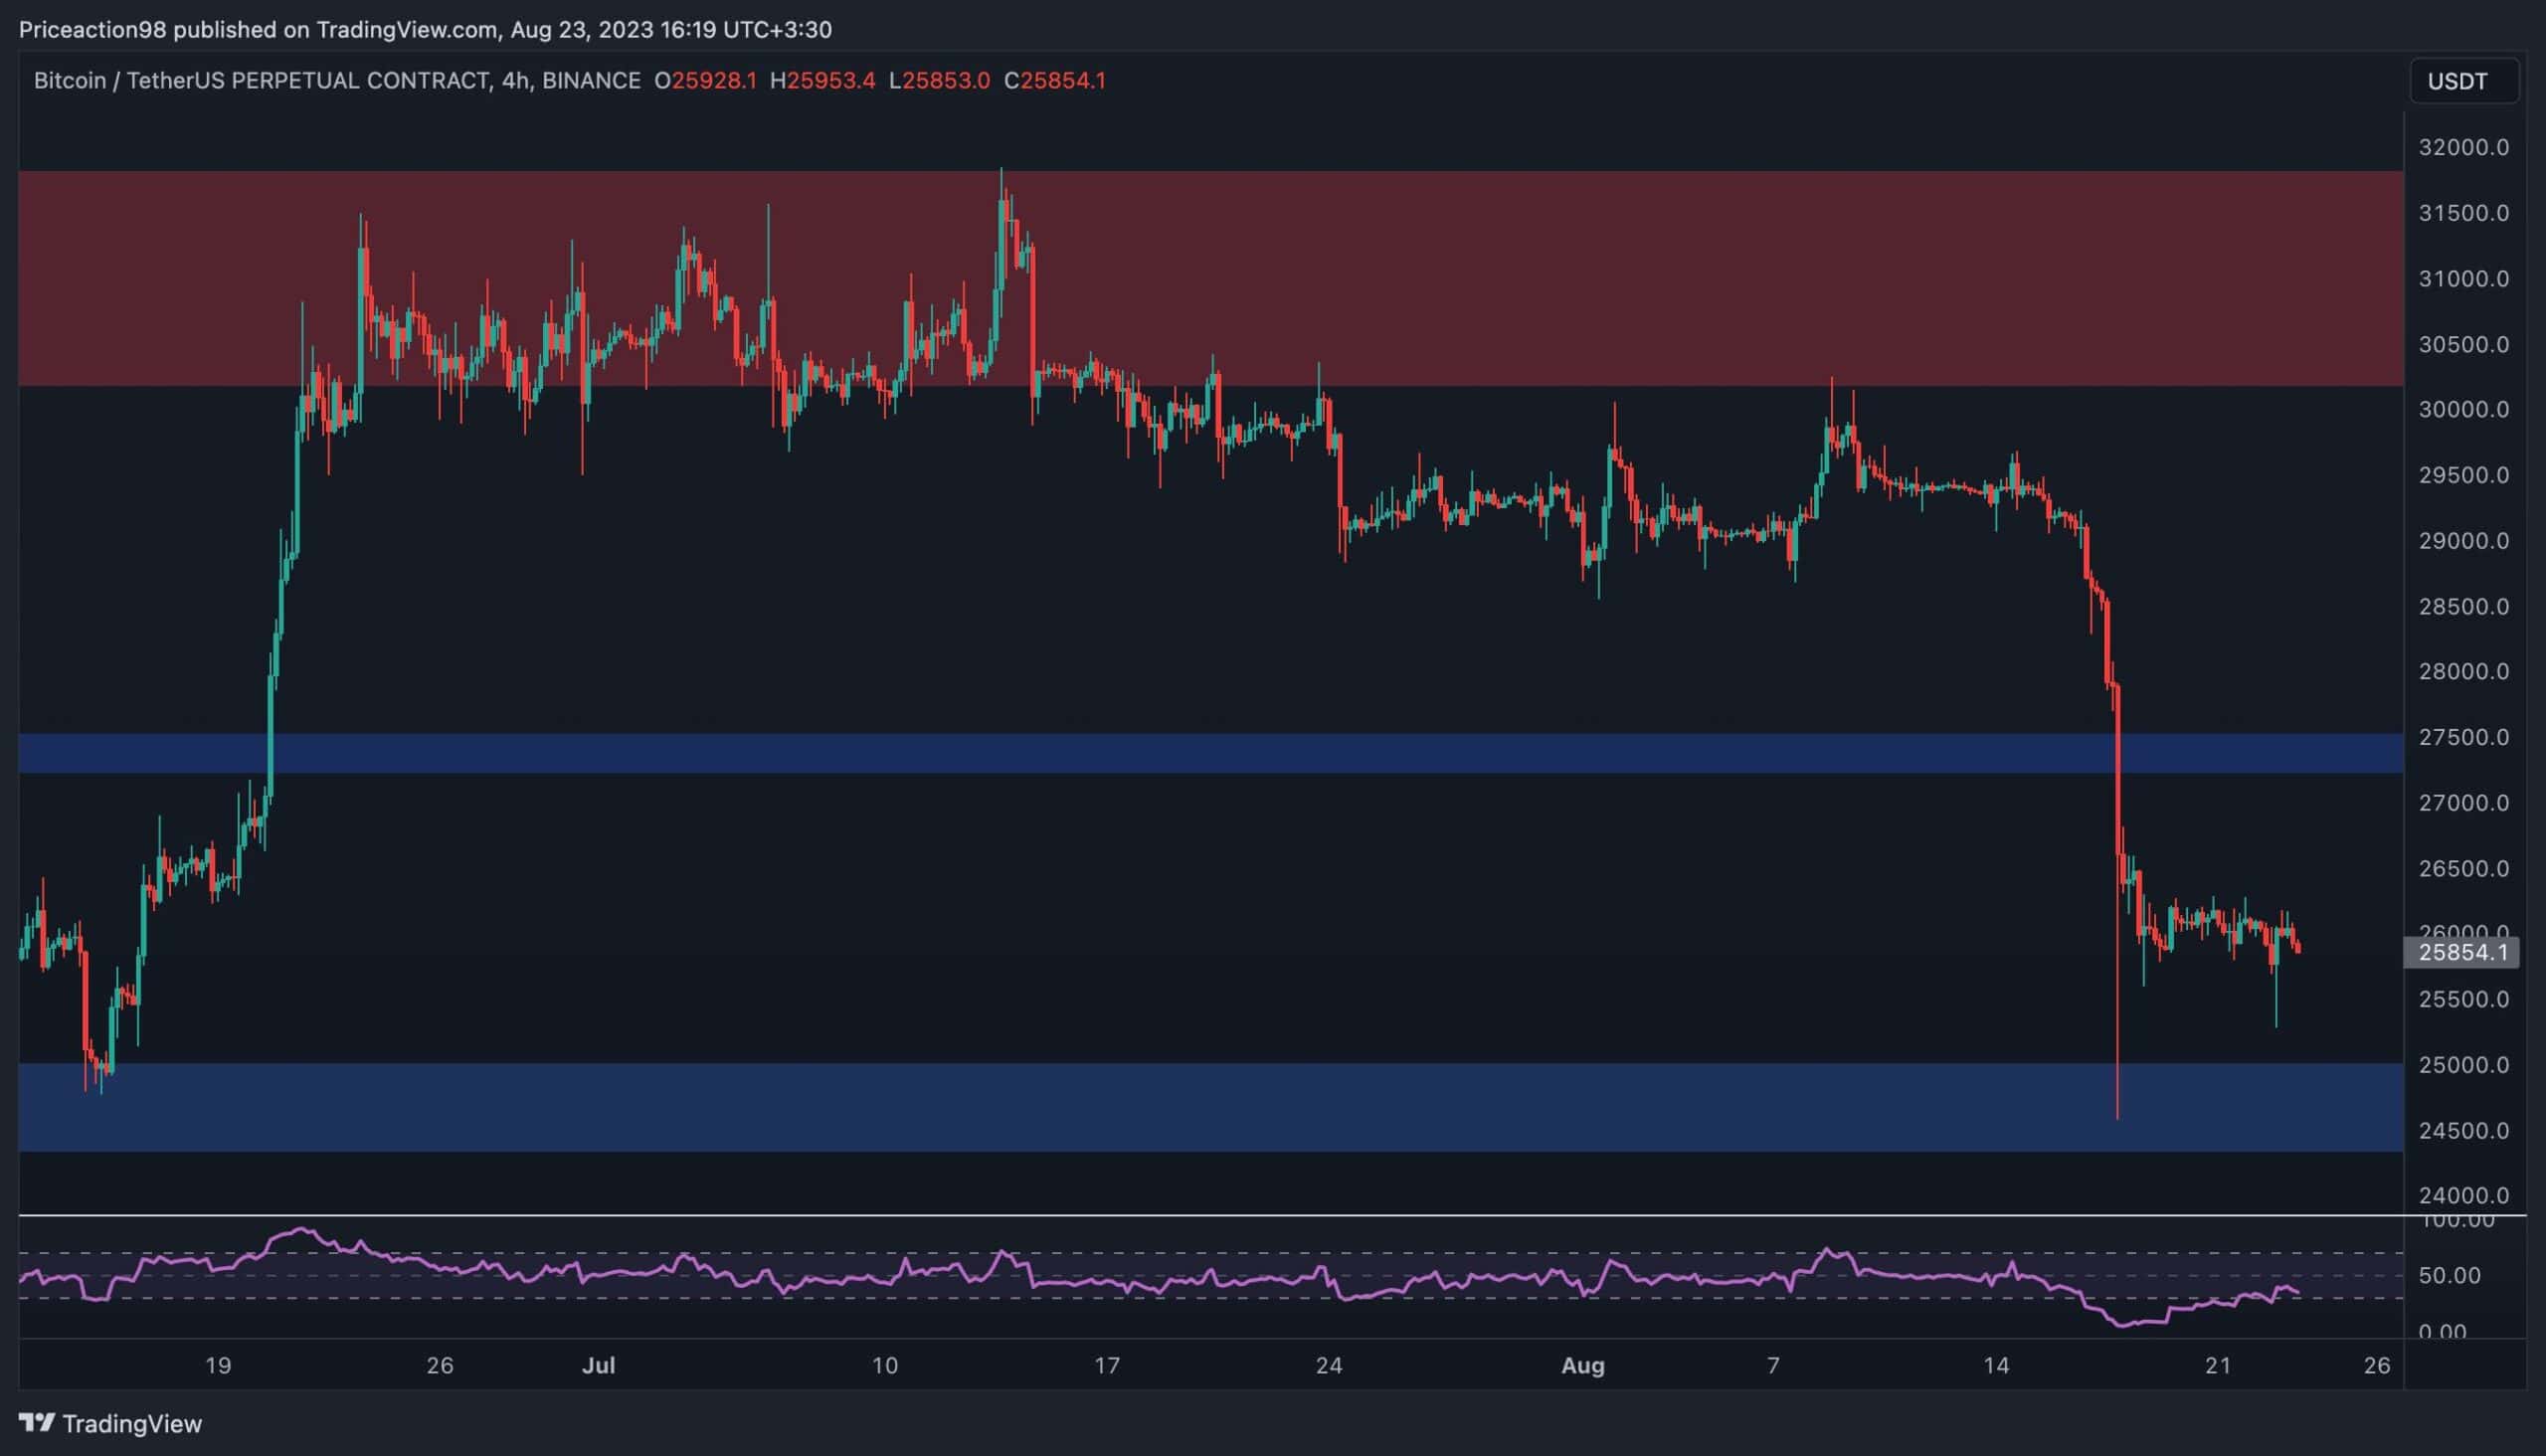
The 4-Hour Chart
The recent decline looks more dramatic when analyzing the 4-hour chart.
The price has easily broken through the $27,500 support level and pierced through the $25K level with a long wick. Yet, the market is in the consolidation phase on this timeframe, as the $25K area has prevented the price from dropping lower successfully.
The RSI indicator has recovered above the oversold region but is still below the 50% threshold. This means that while the price is currently ranging, the momentum is still bearish overall, and the market would likely attack the $25K zone again in the short term.
Sentiment Analysis
By: Edris
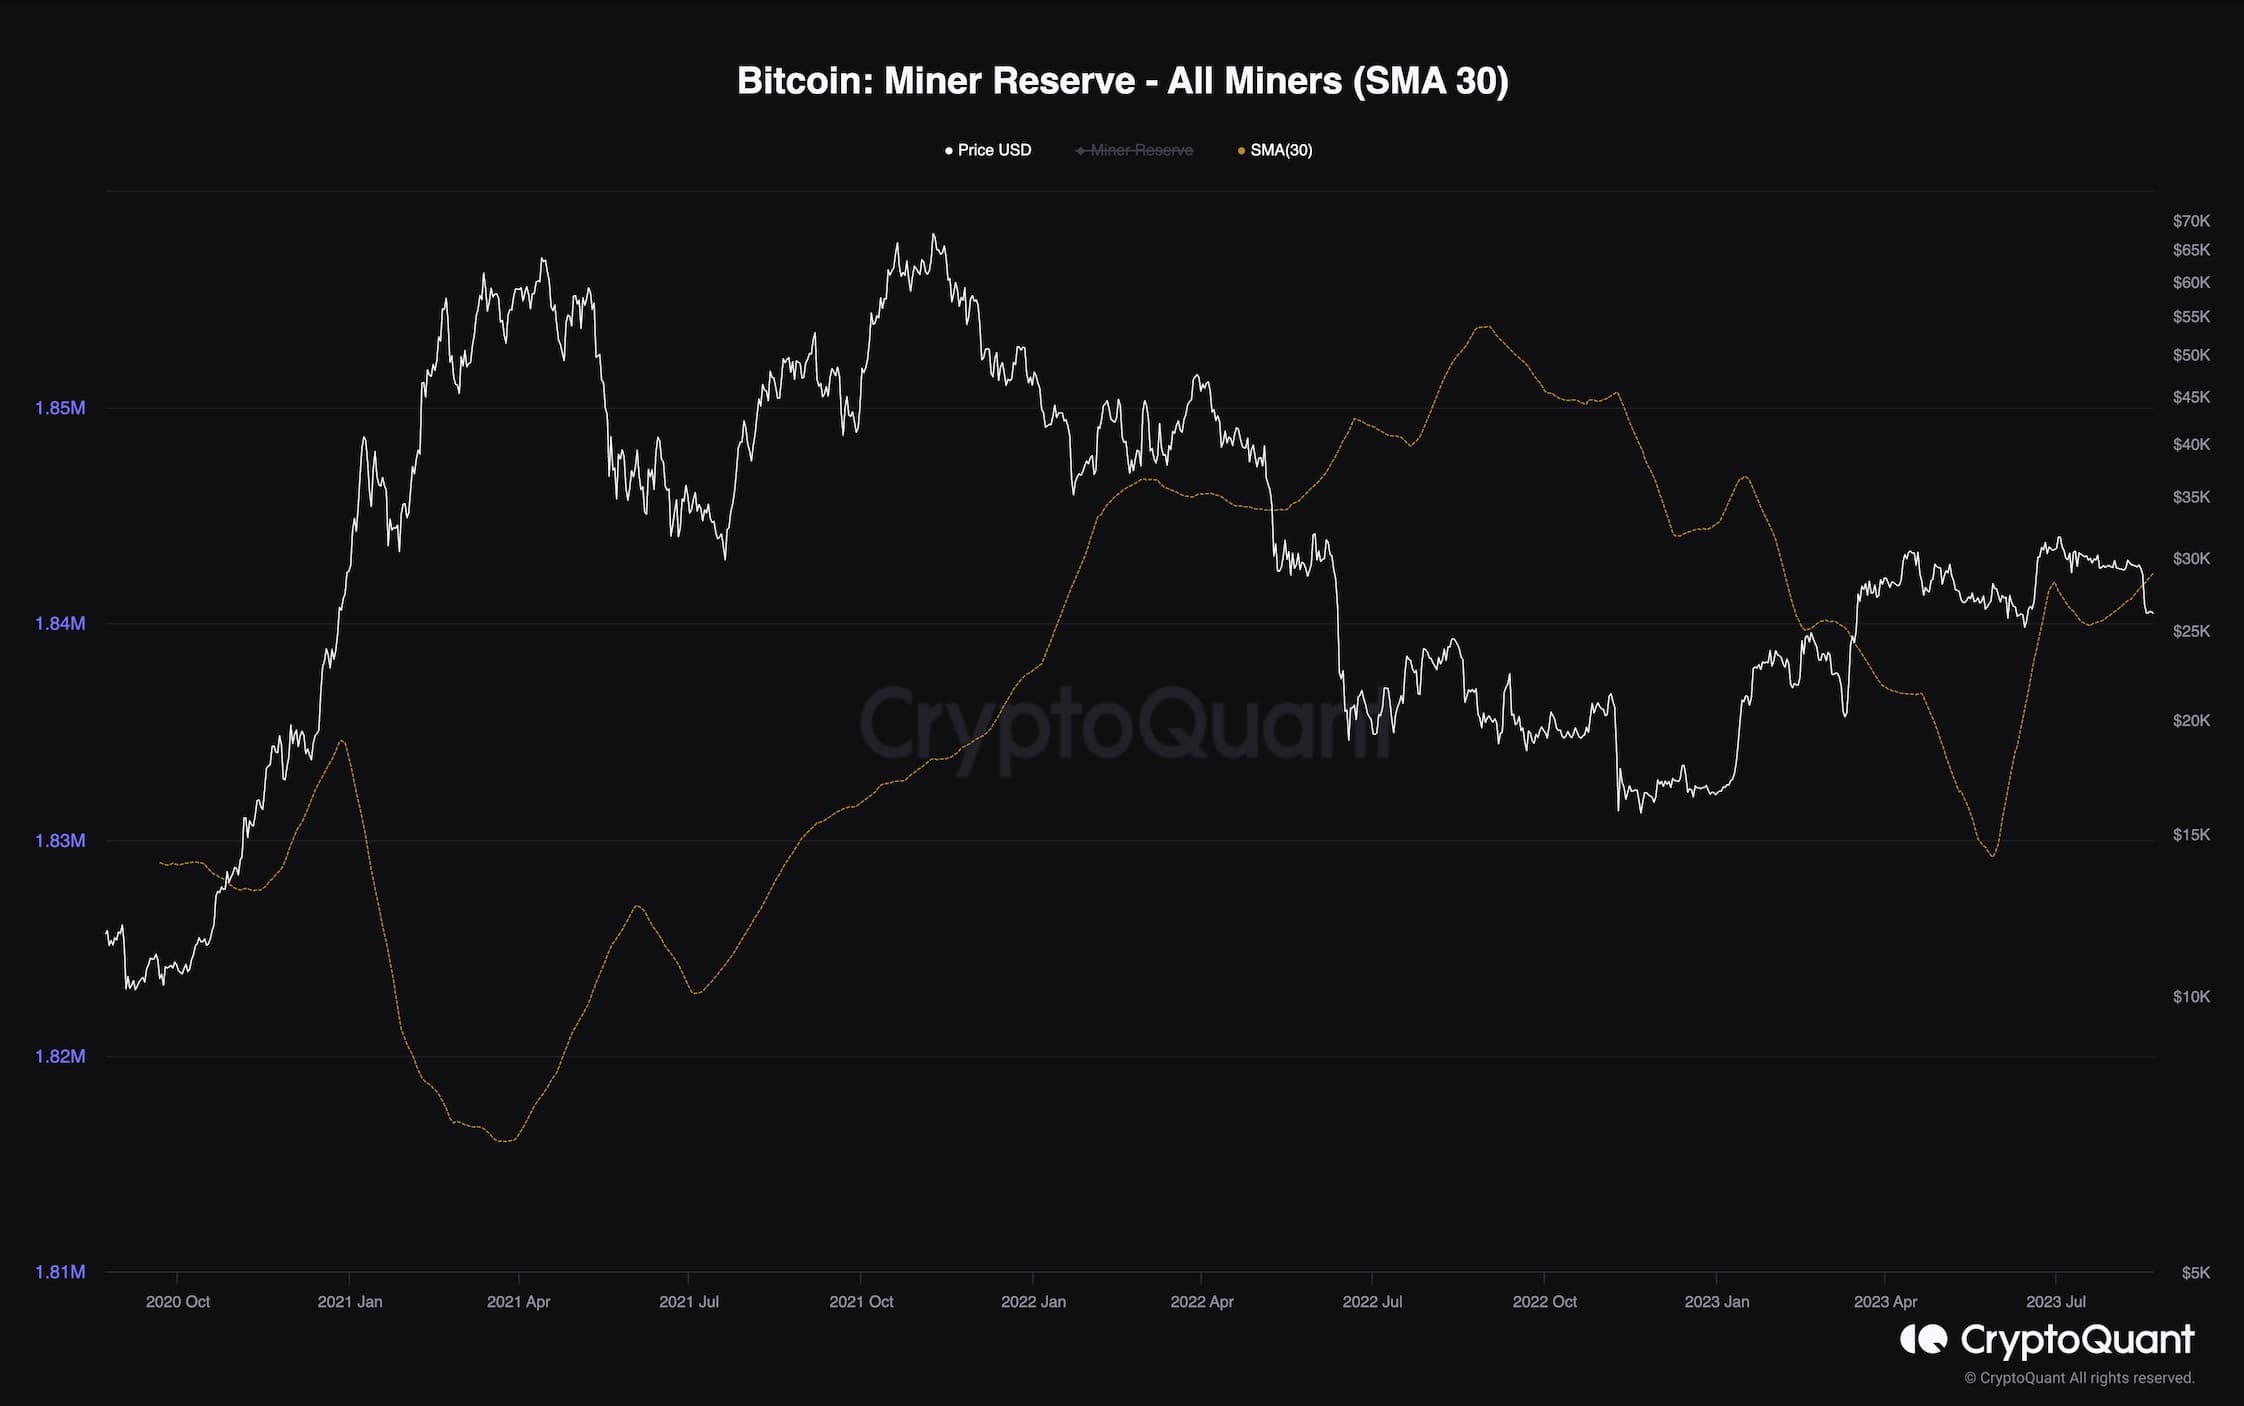
Bitcoin Miner Reserve
Bitcoin’s price has shown little intention to move higher in the last few months, as it has been consolidating below the $30K level. This analysis aims to assess whether the recent price action has affected miners’ behavior.
The chart below depicts the miner reserve metric with a 30-day standard moving average applied for better visualization. The miner reserve metric measures the amount of BTC miners hold in their wallets.
It is evident that in the past few months, miners have somewhat stopped selling. They have been accumulating BTC at a significant rate. This trend indicates that miners, arguably the most important cohort in the Bitcoin network, are optimistic about future price action and are under no pressure to sell their coins to cover operational expenses.
The resulting decrease in supply could be beneficial for the market in the long term, as a new bull market might be on the horizon if sufficient demand comes in.
The post Despite the Crash to $25K, is a Bitcoin Bull Market Still in Play? (BTC Price Analysis) appeared first on CryptoPotato.