Decoupling: Crypto in Deep Red Despite Wall Street’s Relief Rally (Market Watch)
The past few days saw a considerable disparity between the cryptocurrency market and traditional stocks. Unlike Wall Street, though, crypto remains deep in red without a sign of relief.
Bitcoin Struggles at $29K
At the time of this writing, Bitcoin’s price is charting roughly a 1% decrease in the past 24 hours and continues struggling around $29,000.
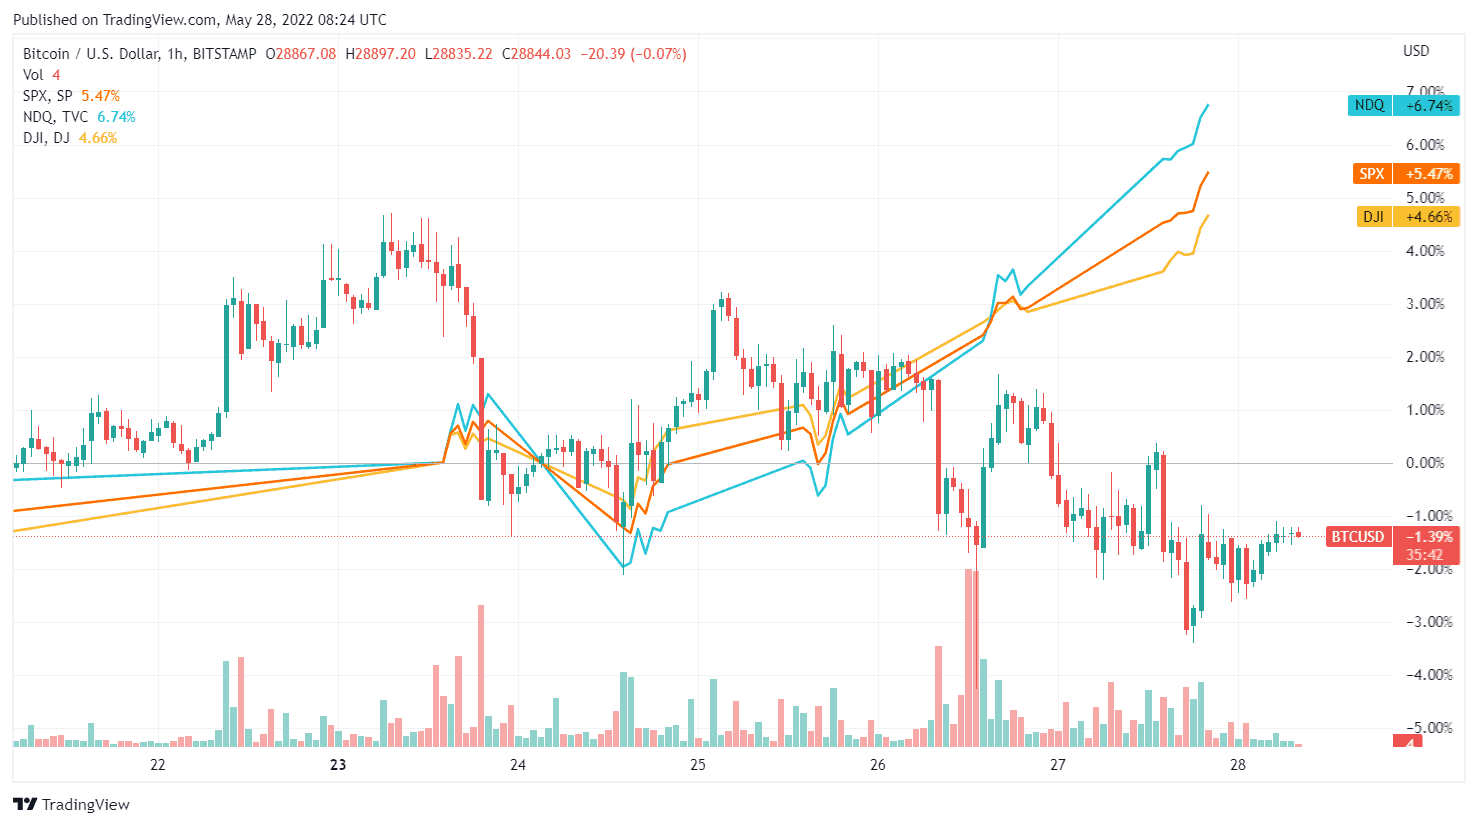
Interestingly enough, this happens during days of an evident relief rally for Wall Street as major indices are well in the green following the previous declines.

As seen in the chart above, BTC is highly uncorrelated to the S&P 500, NASDAQ, and the Dow Jones Industrial Average (NDQ), all of which managed to find some relief after the considerable slumps of earlier this month.
This is even more highlighted with altcoins, which chart more considerable declines.
Altcoins Deep in Red
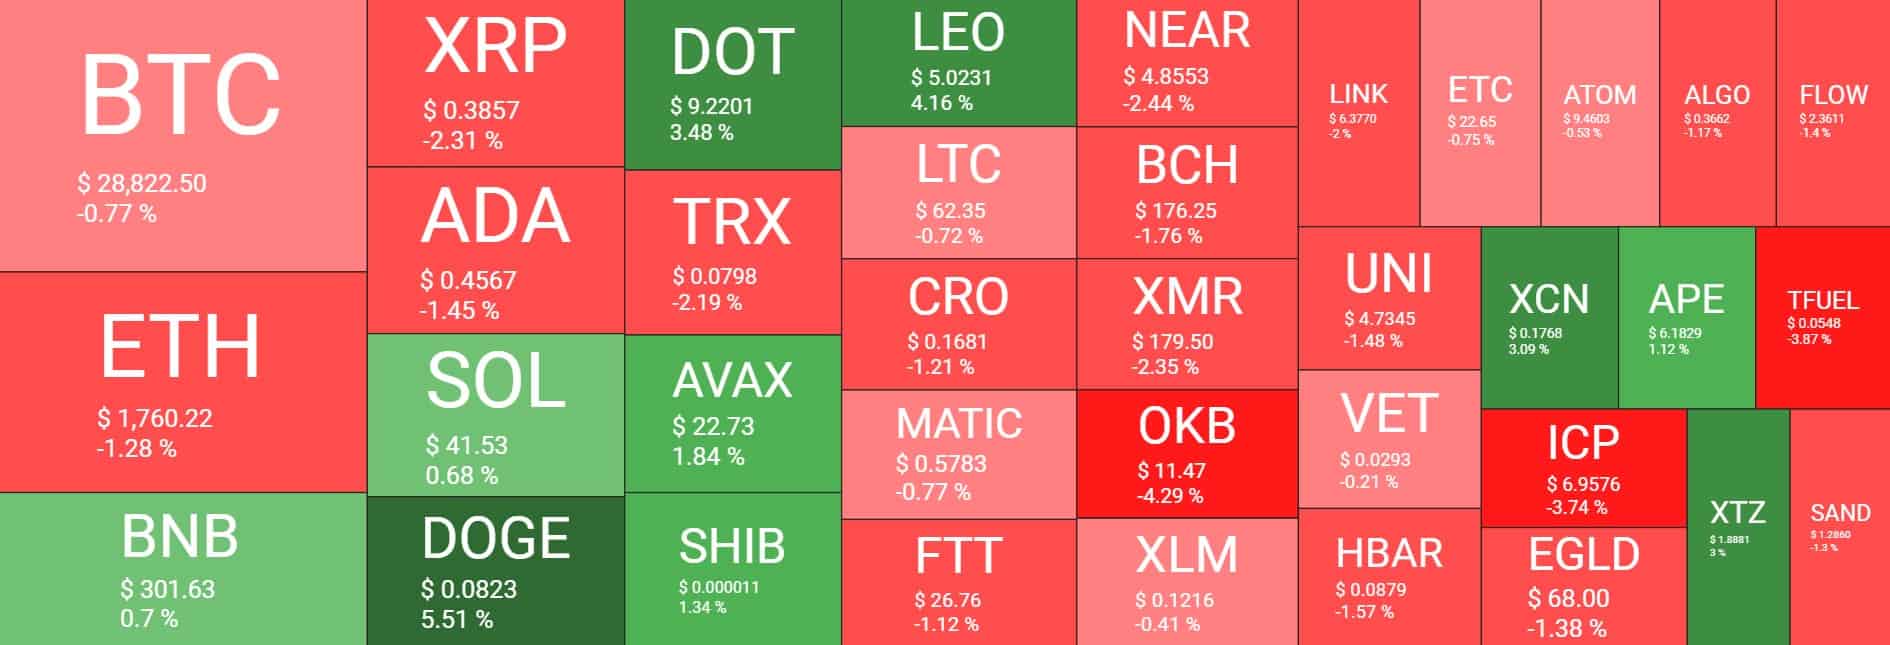
The majority of altcoins are trading in deep red, charting much more considerable decreases compared to Bitcoin.
Even though the market remained rather flat over the past 24 hours, ETH lost 10% during the last week, ADA – 11%, SOL – 16%, XRP – 6%, and so forth.
This is what the past day looks like with some of the altcoins being able to chart insignificant gains, but, as mentioned, the market remained rather flat:

In any case, the unconvincing performance of alternative coins has caused Bitcoin’s dominance – the metric that tracks its share relative to that of the entire market – to soar over the past week. In fact, it was recently trading at levels that we hadn’t seen since last October.


